COMPARISON OF VARIOUS MEDIA IN TEACHING
ENGINEERING PRINCIPLES: DESIGN OF A
D.C.
MOTOR
TORQUE/SPEED CURVE DISPLAY MECHANISM
BYPETER T. LEE
S.B.M.E., MASSACHUSETTS INSTITUTE OF TECHNOLOGY, 1996
SUBMITTED TO THE DEPARTMENT OF MECHANICAL ENGINEERING IN PARTIAL FULFILLMENT OF THE REQUIREMENTS FOR THE DEGREE OF
MASTER OF SCIENCE
AT THE
MASSACHUSETTS INSTITUTE OF TECHNOLOGY
SEPTEMBER 1998
/7
SIGNATURE OF AUTHOR
DEPARTMENT OF MECHANICAL ENGINEERING,
PETER T. LEE AUGUST 7, 1998
CERTIFIED BY
PROFESSOR WOODIE C. FLOWERS PAPPALARDO PROFESSOR OF MECHANICAL ENGINEERING THESIS SUPERVISOR
ACCEPTED BY
PROFESSOR AIN A. SONIN PROFESSOR OF MECHANICAL ENGINEERING CHAIRMAN, DEPARTMENTAL GRADUATE COMMITTEE
MASSACHUSETTS INSTITUTE OF TECHNOLOGY
JUL 121999
EfG
LIBRARIES
-COMPARISON OF VARIOUS MEDIA IN TEACHING
ENGINEERING PRINCIPLES: DESIGN OF A
D.C.
MOTOR
TORQUE/SPEED CURVE DISPLAY MECHANISM
by
Peter T. Lee
Submitted to the Department of Mechanical Engineering On August 7, 1998 in Partial Fulfillment of the Requirements for the Degree of Master of Science
ABSTRACT
Improving product development education depends on finding effective media with which to teach. In my thesis, I focused on a comparison between the physical intimacy with a mechanical system and a computer simulation of the same system
-specifically DC motors and their torque/speed characteristics. I built a fully mechanical dynamometer that draws the torque/speed curve of a DC motor as a student grabs the motor shaft. I also designed an interactive dynamic computer simulation of the same device using a modeling and animation software package.
The design of the mechanical mechanism was a task that required engineering analysis, industrial design, human factors, and a focus on the education of students. There were a number of design challenges in this device that led me to build a fairly
sophisticated mechanical mechanism that draws a torque/speed curve while being simple enough to understand. The design approach and analysis method was heavily stressed in creating this model. The computer simulation was modeled directly from the mechanical model.
In order to compare the teaching effectiveness of the models, I ran experiments with students comparing the mechanical device, the computer simulation, and a control, a written textbook explanation of DC motor torque/speed characteristics.
From the experiments, I found that the mechanical model was most effective in teaching students, followed by the computer simulations, and finally the control test. Students felt that the hand-on aspect of the mechanical model was the most important feature that distinguished it from the others. The results from this thesis can help to guide how media might be used more effectively in education.
Thesis Supervisor: Woodie C. Flowers
ACKNOWLEDGEMENTS
To my parents who taught me to aim high and settle for nothing less than my best. Thanks for your faith, support, and love.
To Woodie, thanks for your wisdom and for trusting my judgement in my work. You taught me to be self-reliant but also unafraid to ask for help when I needed it.
To Ben, Julie, and John, thanks for your advice and input. My thesis would not have been the same without your advice and help.
And finally, to Minna, for listening to me complain and putting up with my bad moods, for your innocence and honestly in all things, and for your unconditional love and support. I love you.
TABLE OF CONTENTS
TITLE PA G E ... .. 1 A B STR A C T ... ... .... 3 ACKNOWLEDGEMENTS ... 4 TABLE OF CONTENTS ... ... 5 TABLE OF FIGURES ... 8 1 INTRODUCTION ... .. 99... 1.1 Background ... 91.1.1 Product Development Education ... 9
1.1.2 Center for Innovation in Product Development - Thrust 4 ... 9....
1.1.3 Torque/Speed Curves ... ...10
1.1.4 MIT 2.007 Students ... 11
1.2 Overall Project Goal ... 13
1.2.1 Purpose of Device ... 13
1.2.2 Description of Model ... ... 14
1.2.3 Matrix of Devices ... 15
1.3 Structure of Thesis Report ... 17
2 Design of Mechanical System ... 18
2.1 Overall Purpose ... 18 2.2 Overall Description ... 21 2.3 Torque Meter ... 24 2.3.1 Description of Mechanism ... 24 2.3.1.1 Analytical Design ... 25 2.3.1.2 Qualitative Design ... 26 2.3.1.3 Decision Flowchart ... 28 2.3.2 Screwdriver Example ... 29 2.3.3 Alternative Designs ... ... 30 2.4 Velocity Meter ... 32 2.4.1 Description of Mechanism ... 32 2.4.1.1 Analytical Design ... ... 33 2.4.1.2 Qualitative Design ... 35 2.4.1.3 Decision Flowchart ... 37 2.4.1.4 Fan/Mixer Examples ... 37 2.4.2 Alternative Designs ... ... 38
2.5 Mathematical Model of Mechanical System ... 40
2.5.1 Predicted Versus Actual Curve ... 40
2.5.2 Explanation of Non-linearity ... 45
2.5.3 Dynamic Analysis of Frequency Response ... 45
2.5.3.1 Torque Meter ... 45
2.5.3.2 Velocity Meter ... 46
2.6 Industrial Design ... 50
2.6.1 Aesthetic Shapes ... 50
2:6.3 Human Factors ...51
2.7 Further Features ...53
2.7.1 Damper ...53
2.7.2 R otation Lim iter ... ... ... 54
2.7.3 Safety Shield ... ... ... ... 54
2.8 Other Design Issues ...55
2.9 Design Revisions ... 56
2.9.1 Shaking of Velocity Meter ... ... ... 56
3 DESIGN OF COMPUTER SIMULATION ... ... ... 58
3.1 O verall Purpose ... ... ... 58 3.2 Initial Approach ...61 3.3 WorkingModel 3D ... ... 62 3.4 Rendering/Computational Issues ... 64 4 Design of Experiment ... ... ... 66 4.1 Background of Testers ... ... 67
4.1.1 Local High Schools ... ... 67
4.1.2 M ITES ... ... 67 4.2 Protocol ... ... 68 4.2.1 Scenario ... ... ... 68 4.2.2 Models ... 70 4.2.2.1 Control ... ... ... 70 4.2.2.2 M echanical Device ... 70 4.2.2.3 Computer Simulation ... 71 4.2.3 Questions ...71 4.3 Evaluation ... ... ... .... ... ... ... 73 5 RESULTS OF EXPERIMENT ... ... 74
5.1 Initial Analytical Aptitude Test ...75
5.2 Comparison of Media in Understanding ... 77
5.3 Discussion of Results ... .... , ,.. .. .... ... ... ... 80
5.4 Input on Mechanical Device ... ... 81
5.5 Input on Computer simulation ... 82
6 BACHELOR'S THESES ... ... 83
6.1 Torque and Speed Sensors ... 84
6.2 Electromechanical Brake ... ... .... ... 87
6.3 Videoconferencing ...89
7 C O N C LU SIO N ... ... 90
8 RECOMMENDATIONS ... 91
8.1 Further Mechanical Design Revisions ... 92
8.1.1 Existing Device ... 92
8.1.1.1 Toggle to Separate Torque and Velocity Meters ... 92
8.1.1.2 Cable versus Ribbon ... ... ... 92
8.1.1.3 Damper on Tablet ... 93
8.1.1.4 Adjustable Masses and Spring Constants for Governor ..93
8.1.2 Overhead Projector Version ... ... 94
8.1.3 D isplay V ersion ... 94
8.1.4 Other Engineering Topics to Model ... ... 94
8.2 Further Computer Simulation Revisions ... 96
8.2.1 Web based model ... 96
8.2.2 Flexible System ... 96
8.2.3 Computational Issues ... 96
8.3 Further Experimental Revisions ... ...98
8.3.1 Computer Model Independent of Mechanical System ... 98
8.3.2 Haptic Versus Visual Input in Video ... 98
8.3.3 Gender Differences ... ... 98
8.3.4 Active Versus Passive Understanding ... 99
9 APPENDIX ... ... 100
9.1 Mechanical Design ... 100
9.1.1 ProEngineer Drawings and Assembly ... 100
9.1.2 Parts List ... ... 115
9.1.3 D.C. Motor Specifications ... ... 116
9.2 Analysis of Design ... 117
9.2.1 Linearity Analysis of Governor ... 117
9.2.2 Dynamic Model of Second Order System ... 119
9.2.2.1 Discussion of the Physical System ... 119
9.2.2.2 Torque Meter Dynamic Analysis ... 121
9.2.2.3 Governor Dynamic Analysis ... 122
9.2.2.4 Block Diagram of the dynamic equation ... 124
TABLE OF FIGURES
Figure 1.1: Figure 1.2: Figure 1.3: Figure 1.4: Figure 2.1 Figure 2.2 Figure 2.3: Figure 2.4: Figure 2.5: Figure 2.6: Figure 2.7: Figure 2.8: Figure 2.9: Figure 2.10: Figure 2.11: Figure 2.12: Figure 2.13: Figure 2.14: Figure 2.15: Figure 2.16: Figure 2.17: Figure 2.18: Figure 2.19: Figure 2.20: Figure 2.21: Figure 3.1: Figure 3.2: Figure 4.1: Figure 4.2: Figure 5.1: Figure 5.2: Figure 5.3: Figure 5.4: Figure 6.1: Figure 6.2: Figure 9.1: Figure 9.2: Figure 9.3: Figure 9.4: Figure 9.5: Figure 9.6: Figure 9.7: Figure 9.8:Torque/Speed Curve of a DC Motor ... ... 11
Spectrum of Learning and Understanding ... 13
Mechanical Device and Computer Simulation ... 15
Matrix of Devices ... 16
M echanical Device ... . ... ... 19
Actual Graph Drawn by Mechanical Device on Post-It Note ... 22
Maxon DC Motor ... ... ... ... 23
Torque Meter ... 25
CAD Assembly of Mechanical Device with Forces ... 26
Pin in Track Feature on Actual Device and CAD Model ... 27
Design Flowchart for Torque M eter ... 28
Electric Screwdriver ... ... ... 29
Comparison of Torsional and Linear Springs ... 30
Comparison of Cable and Ribbon Wrap ... 31
Velocity Meter - Flyball Governor ... 33
Governor in Slow Speed State and Full Speed State ...34
Analytical Graph of Governor Performance ... 35
Pen Attachment on Velocity Meter ... ... 36
Nonlinear Spring ... 39
Predicted Torque/Speed Curve of Mechanical System ... 40
Overlaid Predicted and Actual Curves of Mechanical System ... 43
Governor Natural Frequency at Various Speeds and Spring/Mass Pairs .47 Gripping Piece ... 52
Airpot Adjustable Damper ... ... ... 53
Before and After Curves of Mechanical Device ... 57
Computer Simulation ... ... 59
Mouse Slider Bar from Computer Simulation ... 62
Table of Student Initial Performance Rating ... 69
Table of Final Understanding of Concepts ... 72
Histogram of Students' Initial Performance ... 75
Student Group Comparison ... 76
Final Comparison of Understanding Between Three Models ... 77
Comparison of Understanding for Student Groups ... 79
Torque and Speed Sensor M odel ... 85
Electromechanical Brake ... ... 88
CAD Models of Parts from ProEngineer ... 101
Parts List ... ... ... 115
Maxon DC Motor Specifications ... ... 116
Free Body Diagram of Governor ... ... 118
Free Body Diagram of Torque M eter ... 121
Diagram of Governor for Dynamic Analysis ... 122
Block Diagram of Differential Equation for Governor in Simulink ... 124
1 INTRODUCTION
1.1 Background
1.1.1 Product Development Education
Dispersal of new product development improvement in industry has traditionally been ineffective in transferring new information and processes. Large company wide teaching seminars seem to be the most widely used. These seminars, often lasting two or three days, require enormous time and resources to organize and run. In order for
companies to capitalize on new product development improvements fully, they must incorporate effective ways of teaching this information in their company culture.
1.1.2 Center for Innovation in Product Development - Thrust 4
The Center for Innovation in Product Development (CIPD) was formed at MIT with the goal of becoming "the world leader in creation and deployment of breakthrough product development science, processes, and tools. The Center will lead in education and
learning to increase product development knowledge and leadership skills. US industry, by applying the Center's output, will gain a privileged competitive position." Specifically in Thrust 4: Accelerating Capabilities Improvement, there is an emphasis on improving the speed and quality that an organization's product development capabilities are
improved through the creation and implementation of new knowledge and processes. It is with this ultimate goal that my thesis addresses and attempts to answer some of these challenges.
For my thesis, I focused on various media that are available and are currently being used to teach. By comparing the pros and cons of these media in terms of teaching effectiveness for a given subject, much can be learned about how companies should focus their efforts in teaching product development. I decided to focus on an engineering concept that students were having difficulty grasping and applying. For this, I chose the characteristic torque/speed curves of DC Motors.
1.1.3 Torque/Speed Curves
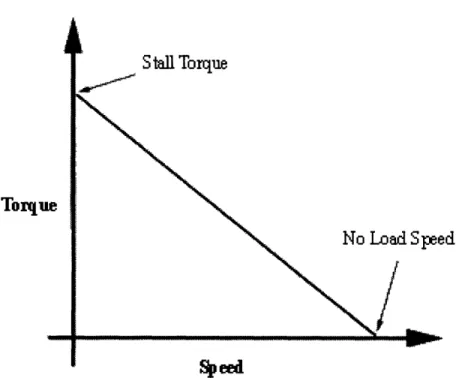
The principles being taught through this thesis deal with DC motors. In many engineering classes, students must design and build machines that employ these motors as actuators driving their machines. The torque/speed characteristic exhibited by DC motors represents a linear inverse relationship. As seen in the graph, there is a tradeoff that occurs between the torque the motor can apply and the speed at which the motor runs. Often, motors characteristics are given as two points on the no-load speed and the stall torque. These two points represent the end points on the graph. As can be read from the curve, the no load speed represents the point where the motor is running at its
maximum speed but applying zero torque. The stall torque represents the point where the motor is providing the maximum torque but is not spinning. These two endpoints are connected by a line, and the motor must run somewhere at or between these two points. Ignoring any hysterisis, there is a unique torque for every speed at which the motor runs and vice versa.
Torque/Speed Curve of DC Motor
S tall Torque
Torque
No Load Speed
Figure 1.1: Torque/Speed Curve of a DC Motor
In terms of actually using this information in a design, a student must understand that when using DC motors, there is a tradeoff that occurs between torque and speed. Understanding this, a student would then design using this information to calculate the correct gearing and transmission for the motor.
1.1.4 MIT 2.70 (2.007) Students
The problems of understanding these concepts can be observed in the introductory design class at MIT, 2.007 (also known as the 2.70 Robot Building Contest). In this class, mostly sophomore mechanical engineering students are asked to put their understanding of engineering and physics to use and actually build a machine that competes against other machines. For many students, this is the first time that they are actually putting their theoretical knowledge of physics to concrete practice. It is here that numerous professors mentioned that many of the fundamental ideas of motors and their performance
characteristics were not well understood based on the mistakes that students made in designing and building their machines.
One scenario that often occurs involves a student misunderstanding the motor's performance characteristics that they are given. For example, a student may need to build a small vehicle using their motor to drive the wheels. The student would take the motor, connect it to power, and record the speed that the motor runs - not realizing that there is not any load on the motor. The student would then design their car's wheels and
transmission to get their car to move at a specific speed based on the speed of their motor. The problem is that they do not take into account the loading of the motor caused by friction, inertia of their vehicle, and forces caused by inclines in the driving surface. Because of these loads, the motor has to provide a torque. This torque reduces the speed at which the motor runs based on the inverse relationship between torque and speed as described in the previous section. When the student actually drives their vehicle, it doesn't drive as fast as he originally thought. This scenario is very common and rests in the fact that students do not actively understand the torque/speed relationship in a concrete way.
1.2 Overall Project Goal
1.2.1 Purpose of the Device
This thesis attempts to bridge a gap that currently exists in many students' conception of torque and speed. MIT Mechanical Engineering students should all have had a course that teaches torque, speed, and electric motors by the time they graduate. Many of these students still only have a theoretical understanding of these concepts, which gets quickly forgotten unless supported by experienced phenomena in real life. It is reasonable to assume that most students have had enough exposure to "real" objects to have a fundamental understanding of torque and speed without the equations. The point of this thesis and the devices that I have built is to bridge the gap between what the students already know and what they learn in academic classroom settings. My device attempts to do exactly that. It creates a connection from actual, physical mechanisms in which the student has experienced and translates that into a graph that the student learned about in classes. This device hopefully gives the student a better overall understanding of the subject. The graphic below shows a spectrum of understanding and learning. My
device attempts to bridge several blocks together to help students carry knowledge from one domain to another. In my device, I am trying to bridge the gap from what students learn about in classroom lectures to what they see in everyday life. The model uses hands-on learning tools with mechanisms that are similar to what students may see everyday. The contents of each block from left to right show the change of understanding from concrete to abstract.
e Concrete Abstract ->
Everyday observaions Obervations and abjisai Clsarcom laboratory Claeror lecure Book or ineair uctLional and objecl that are that are similar o but handa-on InEtruclian. ineiruciion. Theoaical no4e~ and ather reading
farailiar and 'nnaltel' lightly less cortonrr than Physical interaction or mathemaical based material. unde stood and accepted. thnga thal are alten seen with d eices. Graphical and auditory.
Figure 1.2: Spectrum of Learning and Understanding
The knowledge gained about how students learn engineering principles with various kinds of media can help us understand what forms of teaching are best of certain
kinds of subjects. This will eventually lead to improved product development education in industry by allowing companies to provide an optimal combination of live
presentations, computer simulation, and reading - with cost and learning being the metrics.
1.2.2 Description of Models
In this thesis, I present two alternative forms for teaching students about DC motor torque/speed curves. The traditional method used at MIT and probably many engineering universities consists of a textbook explanation or a lecture describing the torque/speed characteristic for a motor. In my thesis, I built a completely mechanical model that allows a student to interact with the spinning motor shaft. In this device, there are several mechanisms that move as the student grabs the motor shaft. The device then draws the torque/speed curve of that motor on a Post-It Note as the student interacts with it. This device was built with the goal of making the mechanical movements representing torque and speed operationally transparent to the student so that by solely interacting with the model, the student could get an immediate understanding of the torque and speed tradeoff. My next model was a 3-D computer simulation of the mechanical device that I programmed using WorkingModel 3-D, a modeling and animation program. This computer simulation mirrors the mechanical model exactly except for the fact that the student's only interaction with the device is through the mouse. By comparing these two models with each other and with the control, I compared physical, computer, and
Figure 1.3: Mechanical Device and Computer Simulation
1.2.3 Matrix of Devices
In addition to these two basic models that I built, I helped to supervise three bachelor's thesis students in building some related models. These models would help fill in some of the gaps in the matrix and clarify the models and what student learn from them. The models can be broken down as follows. My physical model has both a physical input (the student grabbing the shaft of the motor) and a physical output (the mechanisms that display torque and speed). My computer model has both a computer input (the student using a mouse slider bar to simulate grabbing the motor shaft) and a computer output (the animation of the mechanisms). To fill in the matrix formed from the physical
and computer versus input and output, a device that allows for physical input but computer output may be useful. This device consists of an actual motor that the student can interact with, but rather than the physical mechanisms as output, there is a torque
sensor and an rpm sensor mounted on the motor. These sensors are hooked to a computer and actively display the torque and speed of the motor. The other node in the matrix consists of a computer input and a physical output. This is done by having an
electromechanical brake controlled by a student through a computer. The brake is hooked up to the original device to simulate the student grabbing the shaft. With this matrix of devices, tradeoffs between how various inputs and outputs affect learning.
INPUT
Mechanical
Computer
OUTPUT
Mechanical
Mechanical Device - Electromechanical BrakeMotor with Mechanisms with Mechanical Device
Computer
Motor with Torque Computer Simulationand Speed Sensor with Mouse Slider Bar
Figure 1.4: Matrix of Devices
There are many tradeoffs between all the modules in addition to how effective they are in teaching. These include cost and ease of widespread use. For the mechanical model, because the user needs to physically touch the device and also see the physical output, there is a necessity for having a model dedicated to a specific site. (Ignoring the possibility of haptic robotic feedback including the Phantom robot developed at the MIT Artificial Intelligence Laboratory.). The computer model represents the opposite extreme where one computer model could be distributed all over the world through the internet as a web site. This allows for low cost and high ease of distance learning and self paced learning. The physical input and computer output version of the model which uses sensors to read torque and speed, requires some hardware but also computer interaction. The computer input and physical output model incorporates an electromechanical brake in conjunction with the mechanical model. If videoconferencing capability was added, there could be one mechanical model in a remote site with a videocamera, and brake all controlled over the internet from remote computer site. This would reduce the number of models needed and also allow for distance learning.
1.3 Structure of Thesis Report
Chapter 2 describes the design and building of the mechanical device. I discuss the torque and the speed modules, perform a mathematical analysis of the device, discuss
the industrial design and language of the device, and some detailed descriptions of various design features. I then go into some of the design issues and problems I faced in building and assembling the device.
Chapter 3 describes the design and modeling of the computer simulation of the mechanical system. I discuss some of my earlier methods of creating the simulation, both before deciding on using WorkingModel 3-D and once I started using this program. I end the chapter with some rendering and computational issues of computer simulations.
Chapter 4 describes my experimentation method to test the effectiveness of the devices that I designed. I then go into my experimental protocol.
Chapter 5 describes the results of my experiments.
Chapter 6 describes the work of three bachelor's thesis students that I supervised.
Chapter 7 gives an overall conclusion to the work done in the thesis.
Chapter 8 provides some recommendations for further work on the mechanical model, the computer simulation, and the experiments.
2 DESIGN OF MECHANICAL SYSTEM
2.1 Overall Purpose
The design for this device, as compared to other products, has slightly different criteria in determining its performance and quality. Because this device is used in teaching an engineering principle, the main overriding criteria in the design is to be educationally transparent to the student. Also, because the students who will be using this device are mechanical engineers, there is an emphasis on design elements. Industrial design and human factors are also heavily considered. The aim of the device is to teach students about DC motor torque/speed curves in a way that bridges the gap that exists between the theory that the students learn in classes and the physical phenomena that they observe occurring in everyday products. Because this device is intended to be used in classroom demonstrations, the machine must be rugged enough to withstand abuse from students, constant use, and possible bumps and bangs.
As in Frank Lloyd Wright's philosophy in designing buildings, form follow function. This device uses aesthetics and industrial design elements to guide the student's understanding and approach to the device. The tradeoff between simplicity of design and the intrigue of interesting mechanisms was weighed to have a device that from first glance is straightforward in its function, but upon closer inspection contains many interesting mechanisms dealing with mechanical design. It was with this intent that I designed the device.
In building this device, I went through several prototypes and breadboards of the subassemblies. A tremendous amount was learned from these prototypes - not only in terms of design elements, but also in terms of students' responses to the device and their interaction with it.
C3r CDt 0t 40 CDb& ovm 0~ _7
2.2
Overall Description
The device contains two main subsystems each with its own unique design considerations and language. Because the device is to teach about torque/speed curves, the first and most noticeable feature of the device is the layout of the machine. Mirroring the axes of the torque/speed curve that students learn about in classes, my device consists
of a spatial separation of the torque and speed subsystems that align to form the axes of a graph. This architectural feature of separating subsystems according to function allows for more clarity in understanding of the overall device by allowing students to focus on each system independently, and then superimpose the motions to get the final motion. Coloring of the mechanism also further clarifies the separation between the systems and the base of the machine.
The first subsystem is the torque measuring mechanism that consists of a spring-loaded cable wrapped around the motor. The second subsystem is the speed measuring mechanism that consists of a spring-loaded flyball governor. There are several other interesting mechanisms and features that I will also highlight that affect the performance or aesthetics of the device.
In order for this device to effectively bridge the gap between what students learn in classes and what they already have an understanding of from interacting with everyday products, I had the mechanism draw a graph of the torque/speed curve on paper. The movement of the mechanism was the physical part of the machine that transparently demonstrates torque and speed. The graph on paper links this motion to the graph that the students learn about in classes. In this way, the torque/speed curve becomes less
Figure 2.2: Actual Graph Drawn by Mechanical Device on Post-It Note
The layout of the tablet where the torque/speed curve is drawn is inclined at a 450
angle so that it is easily viewed by students. With the motor mounted at the bottom of the track that the tablet rides on, there is an even presentation of the tablet graph and the motor -the two main features of the entire device. This user-friendly view of the device is effective in presenting the graph to the student.
The student interacts with the device by squeezing a grip that is attached to the motor shaft. By allowing the student to adjust his gripping strength to range from zero grip (letting the motor shaft freely spin) to a full grip (stalling the motor shaft so that it stops spinning), the device actively maps out in real time the exact torque and speed state of the motor on the graph. This haptic input is a very visceral and intimate interaction between the student and the device. This device falls in the matrix category of physical input and physical output.
The DC motor being used in the device is one of the motors that is used in the
2.007 Introduction to Design (2.70) class at MIT
2.3 Torque Meter
2.3.1 Description of Mechanism
The torque measuring mechanism is the first subsystem of the overall device. The goal of this mechanism is to measure the torque output of the DC motor. Some of the criteria of in the design include linearity of the torque measurement, clarity in
understanding how it works, an aesthetic design language that matches the rest of the device, and robustness of design so that it can last through class demonstrations, students, and accidental bumps.
The torque meter consists of a carriage connected to a cable that is wrapped around the body of the DC motor. The motor is mounted on bearings so that not only does the motor shaft spin but also the motor itself is allowed to spin. The carriage rides on two shafts through linear bearings and is connected to the motor by a steel cable. The carriage is connected to a back mounting piece with an extension spring.
~Supprt S td
m
S
iTablet Carniage
Post-It Note
Figure 2.4: Torque Meter
2.3.1.1 Analytical Design
The torque meter uses the counter acting torque of the motor and the student's resisting grip to map out the torque that the motor is applying. As the student grips the knob, the motor wants to spin the opposite direction as the motor shaft in order to counteract the gripping torque that the student is applying. As the motor tries to spin on its bearings, the steel cable gets wrapped around the motor body. This wrapping of the cable pulls the carriage piece down the along the linear guides. There is an extension spring that is attached between the carriage and a grounded back mounting piece that resists this pulling.
Reaction Force
rippij Torlue
Figure 2.5: CAD Assembly of Mechanical Device with Forces
The extension of the spring is now related to the gripping torque that the student applies to the knob. This translates into the motion of the carriage. Assuming that we have a linear extension spring, the distance that the carriage travels will also be linear with the torque of the motor.
2.3.1.2 Qualitative Design
Once the concept design was finalized, the exact specifications for each component part were set. Because there are an infinite number of possibilities of components to choose from, I had to start with some assumptions. With the mechanical analysis confirmed, the design shifted towards a human factors and robustness decision. Once a few design criteria were set, the other specifications fell into place.
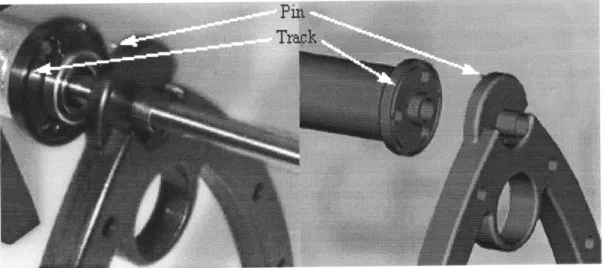
Considering that the motor must spin to wrap the cable, in a real life setting, there is the possibility of the motor spinning backwards or more than what was designed. Possible causes of this include dynamic effects, students who manually try to turn the
motor, or breaking of some components such as the spring, cable, or the interconnects. In order to do this, I designed a pin and track stop that limits the motor's turn to a little less than 3600. This set the maximum turn of the motor to be just under one revolution.
Figure 2.6: Pin in Track Feature on Actual Device and CAD Model
Once this specification was set, I decided that for aesthetics and clarity, the cable should wrap directly around the motor rather than having a collar piece. This led to a calculation of the maximum amount the motor could pull the cable equal to just less than the circumference of the motor body. Because the carriage is attached to the cable, the carriage could move this distance. In designing the spring, an extension spring was chosen to be large enough to stretch just under this amount based on the maximum stall torque.
Because the carriage piece acts as the board in which the torque/speed curve would be drawn, I wanted to ensure from a usability perspective that the graph would be large enough to see. From my previous calculations, it was confirmed that the carriage
would move about 2." Also, because I wanted the student to be able to take the graph of the torque/speed curve with them, Post-It Notes were used as the graphing paper. This feature added convenience to the design of the device.
Once the basic design of the device was getting settled, I started creating the parts in ProEngineer, a three-dimensional computer aided design software package. The drawings of my parts are in Appendix 9.1.1. The CAD package allowed me to create and review
my parts before they were machined. Also, it has the capability of creating assemblies to ensure that my model would fit together once built.
2.3.1.3 Decision Flowchart
As can be seen, the design of mechanisms can often follow numerous paths that all satisfy analytical engineering. From there, the design must follow a decision path that satisfies other criteria such as cost, convenience, human factors, aesthetics, and usability.
I felt that my decision flowchart was an optimal solution for this device given the criteria
that I felt were most important. If these criteria changed so that maybe minimizing size was the main concern then the decision tree would have varying outcomes. The torque meter was a good example of qualitative criteria being the main deciding factors with the engineering analysis used to confirm its validity.
Design Criteria
1, Linearity of Torque Meter
2, Accuracy and Repeatability
3. Robust
4, Clarity of Meter
5. Aesthetics
6. Motor Torque Limit
Criteria
Linear
1. Linearity --- extension
spring
2, Accuracy and 1 in tf g* A litto less tIhan
Repetabilty -,feature elimirte , 360 degrees
3. Robust any overrotation rotation of motor
Mtter &othan ribbon
4Circtmfe oft ca b Spring stretch Spring constant
5, Aesthetics Wrap directy Crumfrn of distance s about for torque meter
to motor (no - .motor is travel circumference - to get full travel
colote piecO dstanve of meter o motor on tablet
6. Motor Torque
Limit
2.3.2 Screwdriver Example
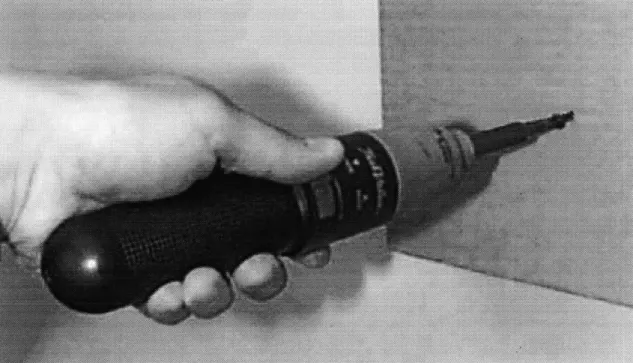
In looking at the device from a student's perspective rather than a designer's perspective, I tried to come up with an example of this mechanism commonly seen in everyday life. By using a commonly occurring example, students can readily relate what they are learning about to what they already are familiar with. This led to the electric screwdriver example. When someone uses a handheld electric screwdriver (or a similar device such as a power drill), they hold the screwdriver in one hand. As they turn on power, the driver turns its bit and thereby screws the bolt into the material. Initially, if the bolt is easy to twist into the material, there is little torque resistance, but as the resistance to turning the bolt into the material increases, there is a counteracting torque that the person feels in their hand.
Figure 2.8: Electric Screwdriver
By relating this to my device. The screwdriver is represented by the motor. The resistance of the bolt going into the material is represented by the student grabbing the shaft of the motor to slow it down. The person's hand is represented by the motor
resistance. In having my device reflect this real life example, I was able to bridge another gap in the spectrum of learning which I described earlier.
With my device, I am able to map the space from the very mathematical and analytical information given in classes in the form of the torque/speed curve to a physical model. Then, by relating this physical model to something that the student probably has personally experienced in everyday life, a connection between what the student learned
about in classes and what he experiences in normal activities is made.
2.3.3 Alternative Designs
In brainstorming for various mechanisms that would display the torque of the motor from a student grabbing the motor shaft, I went through several design concepts. These design alternatives were based on a user's perception and how effectively and clearly they demonstrated the torque measuring principle. The main criteria for this design were linearity of torque measurement and clarity in how the mechanism worked.
In order to display a torque measurement on a graph, there should be a spring element to satisfy the equation F=kx where F is the force, k is the spring constant, and x is the displacement. Because my device displays the torque/speed curve, the spring element is used to transform the torque to a distance that is then shown on the graph. For the spring element, both torsional and linear spring elements were considered.
In terms of performance, both springs would work, but looking at clarity of
understanding, the linear spring is much more commonly used so would probably be more obvious to students.
In terms of the connection of the spring to the motor, I compared the use of a cable and a ribbon. In terms of performance in making the torque measurement linear, there was an issue of the ribbon wrapping over itself thereby changing the diameter of the moment arm around the motor. This could easily be solved by using a thin enough ribbon
so that the error would be negligible. Also, because the motor rotation is limited to less than one rotation, there won't be an overlap of layers to change the diameter. The use of the cable was chosen from personal preference.
2.4 Velocity Meter
2.4.1 Description of Mechanism
The velocity measuring mechanism is the second subsystem of the overall device. The goal of this mechanism is to measure the velocity output of the DC motor shaft. Along with the torque measuring mechanism, this subsystem will allow the torque/speed curve of the DC motor to be drawn. Similar to the torque measuring device, some of the major criteria of this design include linearity of the velocity measurement, clarity in understanding how it works, an aesthetic design language that matches the rest of the device, and robustness of design.
The velocity meter consists of a mechanism known as a flyball governor. The flyball governor works on the principle of the centripetal acceleration of a mass revolving around a center point. In my device, the flyball governor is attached to the output shaft of the DC motor. It consists of two masses connected by a linkage to the shaft in a way that allows the masses to spin with the motor shaft, but also move radially outwards as the centripetal force increases due to an increasing rotational velocity of the motor shaft. A linear extension spring is attached to one end of the linkage to provide a restoring force to the centripetal forces being transferred through the linkage. At the end of the moving linkage, a pen from a plotter is attached through an arm so that the velocity of the motor
Figure 2.11: Velocity Meter - Flyball Governor
2.4.1.1 Analytical Design
The velocity meter uses the principle of centripetal acceleration to instantaneously map out the rotational velocity of the motor's output shaft. Because centripetal
acceleration increases as the rotational velocity increases, I designed a device that takes advantage of this phenomena to measure the velocity of the motor. In order to design the device effectively so that the design criteria were satisfied, an analysis of the flyball governor was performed to determine its characteristics. In an Excel spreadsheet, the behavior of the device was mathematically mapped out.
The equation for centripetal acceleration is a=ro2 where a is the centripetal acceleration, r is the radial distance from the center of rotation of the shaft, and co is the rotational velocity of the shaft. Given that the principle of centripetal acceleration is used,
a mass is needed to convert the acceleration to a force by F=ma where F is the force, m is the mass, and a is the acceleration. From this force, a spring is needed to convert the force
to a distance similar to the torque measuring device. From F=kx, where F is the force, k is the spring constant, and x is the displacement, the force would be converted to a distance. Putting this together, I as able to move from the motor shaft velocity to centripetal
acceleration then to force and then to distance.
Going back to the first design criteria for the velocity meter, the movement of the pen in drawing the velocity of the device on the tablet should be linearly related with the velocity of the motor shaft. As can be seen from the above equation, the centripetal
acceleration is related to the square of the velocity. Because of this, unless there is some mechanism that can linearize this, the velocity meter will not be completely linear.
In order to compensate for this there were several approaches that were
considered. The one chosen for my device was a linkage that would automatically adjust to compensate for the squared term to linearize the velocity meter. Some of the other approaches are discussed in the section on alternative designs. The linkage is a fairly simple system that helps to adjust for this squared term using a factor that includes a tangent function.
Figure 2.12: Governor in Slow Speed and Full Speed States
As can be seen from the picture, when the rotational velocity of the motor shaft is low, the masses are closer to the shaft. In this position, a small amount of force radially from the masses creates a large axial force at the sliding piece. Then, when the rotational velocity of the motor shaft is high, the masses are farther from the shaft. In this position, a force radially fiom the masses due to centripetal acceleration creates a small axial force at the sliding piece. This mechanism reacts this way due to the changing direction of the forces being transmitted through the linkages. From trigonometry, the changing angles of the linkages changes the magnitude of the forces. This characteristic of the mechanisms helps to linearize the squared term of the centripetal acceleration equation. I derived an equation of this mechanism and calculated its force characteristic on an Excel
spreadsheet. Below is the graph comparing the velocity of the shaft and the pulling force at the sliding piece. See Appendix 9.2.1 for a complete derivation of the characteristic equation and discussion of the mechanism design.
Governor Analysis
Figure 2.13: Analytical Graph of Governor Performance
Assuming the restoring spring is linear, the displacement of the sliding piece is linear with the force. As can be seen from the graph, the response of the mechanism is fairly accurate with some non-linearity at low speeds below about 150 rpm.
From the equation and spreadsheet, I designed the velocity meter around the motor characteristics of having a maximum no-load speed of about 600 rpm. By changing the masses, the linkage length, and the spring constant, I was able to design the device to move in a way to fit on a Post-In note.
2.4.1.2 Qualitative Design
In addition to the analytical design that went into designing the velocity meter, there were several design features and criteria that went into building the mechanism. In addition to having the device respond in a linear manner, the device had to be intuitively obvious, interesting to look at, and robust. These design features have some aspects of
450 500 550 600 650 700 0 50 100 150 200 250 300 350 400
Velocity (rpm)
analytical design, but fall more into human factors and how students respond emotionally to the device.
Not only does the linkage system compensate for most of the non-linearity of the centripetal acceleration equation, its symmetry is aesthetic and has a very balanced feel. The colors and shapes of the pieces help in making it fairly obvious what the device does. The spinning masses demand attention. Also, because the device has bearings and steel band linkages, the device is strong and sturdy to withstand bumps and continued use. The robust look of the device allows the student to feel comfortable with approaching the device and interacting with it.
The pen attachment is linked to the velocity meter through a bearing. This bearing allows the pen to move laterally with the sliding piece but not spin with it. The same mechanism is used to attach the sliding piece to a damper. When the motor shaft spins, the masses and linkages spin with it, but the pen does not so that it can write on the carriage tablet to plot out the velocity measurement of the motor.
2.4.1.3 Decision Flowchart
The design of the velocity meter followed a series of decisions similar to the torque meter. Depending on the analytical and qualitative considerations that I set as criteria, the flow of design decisions were guided by the importance of the varying considerations. Once I had analyzed the mathematical model of the governor in Excel, various design parameters were manipulated to optimize the design.
Based on some of my initial architectural and human factors decisions, the width of the graphing area was set to be similar in dimension as the vertical height of the graph. Because the vertical graphing area of the torque is about 2", I set the horizontal
dimension of the velocity meter to be similar. With this dimension set, I was able to manipulate variables in my mathematical model. The variables that determined the horizontal travel of the governor were the linkage length, the mass, and the spring constant. Also, because I wanted to have the governor fairly small, the smallest linkage length that was still in the linear region of the predicted model was chosen. This turned out to be about 3". Once this variable was set, the spring constant and the masses of the
two spinning weights needed to be set. There was a direct tradeoff between the spring constant and the masses. Because I wanted the masses to be fairly visible to the student, I concentrated on the industrial design of the masses and then set the spring constant so that at the motor's maximum velocity of about 600rpm, the governor would move the pen about 2" as can be seen from the graph in Figure 2.13.
There were other considerations to take in to account such as the dynamic
response of the system. This is essentially a second order system of a spring-mass system. In order to control for possible resonances, a damper was added which I discuss in a later section. The dynamic analysis of the governor is discussed in Chapter 2.5.3.
2.4.1.4 Fan/Mixer Examples
Similar to the screwdriver example for the torque meter, it is advantageous to the student to have a real life product with which he can compare the device. This allows the
student to bridge another gap in their understanding from a real product to a mechanical device to a theoretical topic that they learn in their classes.
In the mechanism that displays the velocity of the DC motor, I used the principle of centripetal acceleration in the form of a flyball governor. This device operates by having masses attached to a spinning shaft. When the velocity of the shaft increases, the masses have a tendency to pull further away from the shaft due to this centripetal
acceleration. In looking at this principle, I looked around for products that I had seen that use this idea of centripetal acceleration on masses. Two products that immediately came into mind were small fans and mini-mixers. In the fans, the fan blades are attached to the shaft through hinges. These hinges allow the fan blades to lay flat when not in use to conserve space. When the fan is turned on, the fan blades flap out due to this centripetal acceleration on the blades. In the mini-mixer, there is a plastic rod that is split down its middle. This rod is attached to the shaft of the motor. When the motor is turned on, the two split halves of the rod spread apart and create a mixer. Both of these two real life products use principles similar to what I used in my device.
2.4.2 Alternative Designs
In designing for the velocity meter, there were several design alternatives that were considered. The criteria that eliminated most of them was the linearity requirement. There were several options that I had to make these devices linear, but I decided on my device based on ease of understanding, ease of manufacturing, and robustness.
Because the displacement of the pen is related to the velocity of the motor, even though there is a non-linear relationship between the centripetal acceleration and the rotational velocity, a non-linear spring with a varying spring constant could have been used. By manufacturing a spring that exactly compensates for the governor non-linearity, a linear device could have been made. Rather than have the spring constant k be a
constant value, a spring constant would have been chosen that varied according to displacement. I chose not to follow this route because of the difficulty in manufacturing this spring exactly to specification.
2.5
Mathematical Model of Mechanical System
2.5.1 Predicted Versus Actual Curve
In order to determine how my device would respond based on my initial designs, I derived a mathematical dynamic model of the system. By modeling the geometric
relationships of the various forces and moving parts of the device, I was able to predict with a fair level of accuracy the resulting curve that my device drew on the Post-It note. After deriving an equation of the relationships between the components of my device, I modeled the dynamic states of the device in Excel. The resulting graph of my theoretical dynamic model is shown below.
Predicted Torque/Speed Curve of Mechanical System
3 - _--- - -- - - - - -- --,- -- - -- -2.75 2.5 2.25 . 1.75 1.5 1.25-1 0.75 0.5 0.25 0 50 100 150 200 250 300 350 400 450 500 550 600 650 Speed (rpm)
As can be seen from the graph, my model predicted extremely accurately the actual response of the mechanical system including the non-linearity of the torque/speed curve at low speeds. In the figure below, the predicted curve is overlaid with the plot from an actual Post-In note plot from the mechanical system. The curve in red is the predicted curve from my mathematical model in Excel. The black curve is a scanned in image of the actual curve from a Post-It note overlaid on the same graph. As can be seen, the two curves match up fairly well.
Predicted and Actual Torque/Speed Curves
of the Mechanical System
3 2 --175 05 0 50 -i0 150 200 )S0 3C 350 400 450 SW 5OF 600 650 Speed (rpm)
Figure 2.17: Overlaid Predicted and Actual Curves of Mechanical System
2.5.2 Explanation of Non-linearity
The non-linearity of the torque/speed curves in both the predicted and the actual models both derive from the governor's geometry. Essentially, the torque meter is
completely linear assuming that the spring used to counteract the cable is linear. From the spring supplier specifications, given the stretch range that it is using in, it is linear. The governor performance is slightly non-linear at low speeds as was shown in the previous section on the governor analysis. This governor non-linearity translates to a slight upward sweep in the torque/speed curve at speeds below about 150 rpm. Further explanation can be found in the Appendix 9.2.1.
2.5.3 Dynamic Analysis of Frequency Response
For the design of the mechanical device, the dynamic response of the system was important in determining its frequency response to excitations. This analysis provided a description of how the device would perform given certain inputs. For the mechanical system, the two subassemblies of the torque meter and the velocity meter were both analyzed. The results of this analysis confirmed the design that was implemented. See Appendix 9.2.2 for a detailed discussion and derivation of the frequency response.
2.5.3.1 Torque Meter
The torque meter was a fairly simple second order system with one mass and one spring. Given this, the dynamic response of the system was calculated in terms of its natural resonant frequency. Given the system, the tablet with bearings was the inertial
k
(element and the linear spring element. spring was the From the
equation, the natural
frequency of a second order spring/mass system can be calculated given the spring constant and the mass. In the torque meter, the mass of the tablet is 0.266 lbs, the spring constant of the linear extension spring is 1.87 lbs/in. Converting these to kg and N/m respectively, the natural frequency of the system wn is 23.67 hertz.
Given this frequency, it seems unlikely that a student could pulse his grip on the motor shaft 23 times a second. The highest frequency that a student could pulse the system at would probably be around 5 hertz. Because of this, the design of the torque meter was well out of the excitation range of a student. From actually running the device, the torque meter was not able to be excited to a resonant frequency. One consideration that must be made is a step input which is fairly common for this device when a student grabs very quickly and firmly to the motor shaft. This step input can excite resonances, but from my device, it can be seen that the damping in the linear bearing is high enough and the overshoot low enough not to be a problem. Hence, it was not necessary to put in a damping unit on the torque meter.
2.5.3.2 Velocity Meter
The velocity meter consists of a flyball governor and an extension spring. This second order system essentially has a mass element and a spring element, but unlike the torque meter, the velocity meter is extremely nonlinear. The reason for this rests mostly on the property of the governor in exhibiting behavior where the masses and forces are no longer constant values but are dependent upon the position of the governor. The
derivation of the dynamic response of the system resulted in a nonlinear second order differential equation as follows.
2+ (s )X +
+
3 -Ik
+
3mb
2 2 + 2 20
4
2
4
8
4
Where x is the displacement of the governor sliding mass, ms is the mass of the slider, 1 is the linkage length, mb is the mass of the governor balls, k is the spring constant, and o is the rotational velocity of the governor. See Appendix 9.2.2.3 for a full derivation.
With this differential equation, Simulink - a Matlab program that specializes in modeling, simulating, and prototyping dynamic systems was used. With this program, I
made a block diagram for the system and recorded the step response of the system at different speeds and positions. From this data, I was able to get the natural frequency of the governor at different states and for different pairs of governor masses and springs that would work in my design.
Governor Natural Frequency 16 14 12 0 m=0.00386 kg; k=2.4550 N/m > --- m=0.00966 kg; k=0.6138 N/m : 10 m=0.01932 kg; k=12.276 N/m --.- m=0.03860 kg; k=24.55 N/m *8 S8 --- m=0.07727 kg; k=49.105 N/m S6 -@- m=0.15450 kg; k=98.21 N/m --- m=0.38600 kg; k=245.5 N/m 4 0 0 100 200 300 400 500 600 Motor Speed (rpm)
Figure 2.18: Governor Natural Frequency at Various Speeds and Spring/Mass pairs
As can be seen from the graph, for a given spring/mass system that satisfies the governor performance requirement, the natural frequency increases as the speed of the motor increases. For my device, a governor ball mass of 0.0386 kg and a spring constant of 24.55 N/m was used. As can be from the figure, when the governor is spinning at full speed and the x displacement is at its maximum displacement of about 2", the natural frequency is around 5.5 hertz. In all the cases, the natural frequency tends towards zero as the motor speed approaches zero. Also, in the graph, the natural frequency of the entire system increases as the masses and spring constants increase.
With respect to my design, I did not want my device to have an oscillatory response when a student grabs the motor shaft. From my analysis, it can be seen that my
governor design falls within a range of natural frequencies that students are probably capable of producing with their hands. When this occurs, the governor exhibits resonant behavior and will overshoot its steady state response. In order to compensate for this, I added an adjustable Airpot damper. This allowed me to create a damped second order system to control for this overshoot. The tradeoff that exists is in the time response of the governor which is slightly slowed down.
In order to eliminate resonant behavior, it is desired to have the natural frequency of my device to be higher than what a student is capable of producing with his fingers. This turns out to be around 5 hertz. In order to do this, a large spring and mass pair could have been used so that at least at higher speeds, there would be a higher natural frequency and less chance of overshoot. Of course, for all the spring/mass pairs, at low motor speeds, the natural frequency drops to a region where resonant behavior becomes very possible. Given this I could have chosen the mass to be similar to the line of the 0.386 kg mass and the 245.5 N/m spring constant. Of course, this turns out to be a mass ten times larger than the one presently used. This in itself could have caused other adverse affects such as acceleration problems of the motor being able to spin the governor up to speed. This in itself could have caused a large slow down in the time response of the system.
Looking at the graph and the actual governor system, it makes sense that this varying natural frequency occurs. For a given spring/mass pair when the governor's speed is high, the x displacement is large and the masses of the governor balls become less dominant from geometry. Because the spring constant stays constant, and the effective mass decreases, there is an increase in natural frequency. At low speeds, the governor geometry tends to drive the effective mass towards infinity thereby making the natural frequency tend towards zero. In terms of the natural frequency increasing as the
spring/mass pairs increase, because the spring constant is fixed while governor mass becomes less dominant at high speeds, the spring constant is large relative to the effective mass of the system. This drives the natural frequency higher. No matter the spring/mass pair used, there is a region that the governor enters which it is possible for a student to excite the natural frequency of the governor thereby requiring a damper.
In using the device, the damper can be adjusted while driving an oscillating input. This results in oscillatory behavior at low damping. As the damping is increased the
oscillations decrease and then disappear all together. If the damping is increased further, there is an obvious time response delay for the velocity meter. For my system, the damper can be adjusted so that there is negligible overshoot and time response lag.
2.6 Industrial Design
The industrial design of the components of this device was a crucial area of its effectiveness. I spend a large amount of time and effort into creating a machine whose aesthetics matched its functionality to enhance its overall impression. There were several areas in which I focused my efforts. These included the shapes of the machined parts as well as the overall architectural design and layout of the device. Human factors also had a large affect on how the device ended up looking. By studying how and in what situations students would be using the device, I designed its layout and feel to create an interesting as well as educational model. Coloring of the components and subassemblies also had a great deal to do with the design language of the device. An effective functional design without good industrial design would have been a failure. Because of the situation in which this device was being used, aesthetics and human factors became a major contributor to its final appearance.
2.6.1 Aesthetic Shapes
The shapes of the components in my device were designed with the intention of grabbing attention. There were several functional aspects of the design, but once the functional elements of the parts were satisfied, the rest of the design depended on creating a design language and creating a specific impression. There were several areas that each had specific requirements and functions. These included the supports, the carriage tablet, the velocity masses, and the pen.
The supports of the device include four pieces that hold the rest of the machine up. The basic design language I wanted to convey was that of stability yet gracefulness. I decided to use an arch as the basic design element to build upon. I design the parts with this common design language in mind yet added elements specific to each piece. The circular endplates on the motor were designed to be the same diameter as the motor endplate. When the motor was mounted on the supports, it had the appearance of resting on the supports. This helped to make the motor stand out rather than be hidden in the design.
The carriage tablet was designed to be very elegant yet sturdy. The tablet holds a board to which I can attach Post-It Notes. This makes it very simple to draw a graph to show people. Then the student could take off the Post-It Note to keep for future
reference. The cylindrical shapes on the carriage that hold the linear bearings are similar to the top mounting bracket that hold the two steel shafts.
The masses on the velocity meter were designed to be sleek but also large enough to grab the attention of a student. These masses must stand out so that the velocity
mechanism is easily seen. The image of spinning masses is very real for most students, and this device is effective in that. By having the steel linkages not colored and very thin, the masses tend to feel like they are almost floating and are not attached to anything.
The pen is attached to the velocity meter through a bearing so that the pen moves laterally with the velocity meter, but does not rotate with it. The angular linkage is used to set it apart from the rest of the device which is laid out orthogonally. In this way, the shaft of the motor and the linear shaft guides for the carriage are perpendicular. The pen was also built so that it can rotate on its bearing down off the tablet in case the student does not want the device to draw.
2.6.2 Coloring of Modules
In order to effectively design the device to be educationally clear to the students, color was incorporated as a crucial design element in the device. An anodizing process was used to color the aluminum pieces. Because the torque meter and the velocity meter are the main elements of the device, I felt that they should have very different colors to separate visually. The carriage piece of the torque meter was anodized blue and the velocity meter pieces were anodized red. The support structure pieces were colored black. This anodizing not only made the model look nice, but also served an important function of separating functional elements in the design.
The human factors design had some affect on the layout of the device. Because of many of the other design decisions already made, I designed with the philosophy of form follows function. With the layout of the device shaped similar to the axes of a graph, the grip of the motor shaft was placed at the right end of the model. This was more
convenient for right handed users, but due to the simplicity of the act of grabbing the shaft, would not be awkward for left handed students. Also, because this device would be used in front of a classroom as a demonstration device as well as a device that an
individual student could use, the tablet was angled at a 450 so that it was easy to see. The motor was positioned below the carriage with the governor to the right as these were the parts of the model on which the student should focus most.
The other area of the model that the human factors affect most was the gripping mechanism. The way the student physically interacts with the device was important so that it was completely obvious what the student should do. Also, the tactile feedback of being able to intimately interact with the device was important to how the student learns. In my device I decided on a long thin grip so that a student could use their entire hand to grab the piece. I did not want the student to be able to stop the motor too easily, so the gripping piece was designed thin enough to require a fair gripping force to stall the motor.