HAL Id: hal-03157892
https://hal.sorbonne-universite.fr/hal-03157892
Submitted on 3 Mar 2021
HAL is a multi-disciplinary open access
archive for the deposit and dissemination of
sci-entific research documents, whether they are
pub-lished or not. The documents may come from
teaching and research institutions in France or
abroad, or from public or private research centers.
L’archive ouverte pluridisciplinaire HAL, est
destinée au dépôt et à la diffusion de documents
scientifiques de niveau recherche, publiés ou non,
émanant des établissements d’enseignement et de
recherche français ou étrangers, des laboratoires
publics ou privés.
Multimodal FDG-PET and EEG assessment improves
diagnosis and prognostication of disorders of
consciousness
Bertrand Hermann, Johan Stender, Marie-Odile Habert, Aurélie Kas, Mélanie
Denis-Valente, Federico Raimondo, Pauline Pérez, Benjamin Rohaut, Jacobo
Diego Sitt, Lionel Naccache
To cite this version:
Bertrand Hermann, Johan Stender, Marie-Odile Habert, Aurélie Kas, Mélanie Denis-Valente, et al..
Multimodal FDG-PET and EEG assessment improves diagnosis and prognostication of disorders of
consciousness. Neuroimage-Clinical, Elsevier, 2021, 30, pp.102601. �10.1016/j.nicl.2021.102601�.
�hal-03157892�
NeuroImage: Clinical 30 (2021) 102601
Available online 23 February 2021
2213-1582/© 2021 Published by Elsevier Inc. This is an open access article under the CC BY-NC-ND license (http://creativecommons.org/licenses/by-nc-nd/4.0/).
Multimodal FDG-PET and EEG assessment improves diagnosis and
prognostication of disorders of consciousness
Bertrand Hermann
a,b,c,*, Johan Stender
a, Marie-Odile Habert
d,e,f, Aur´elie Kas
d,e,f,
M´elanie Denis-Valente
a,g, Federico Raimondo
a,h,i, Pauline P´erez
a, Benjamin Rohaut
a,d,
Jacobo Diego Sitt
a, Lionel Naccache
a,d,gaInstitut du Cerveau et de la Moelle ´epini`ere – ICM, Inserm U1127, CNRS UMR 7225, F-75013 Paris, France bFacult´e de M´edecine, Universit´e de Paris, Paris, France
cService de M´edecine Intensive et R´eanimation, Hˆopital Europ´een Georges Pompidou, Assistance Publique des Hˆopitaux de Paris (AP-HP), Paris, France dFacult´e de M´edecine Piti´e-Salpˆetri`ere, Sorbonne Universit´es, UPMC Universit´e Paris 06, Paris, France
eLaboratoire d’Imagerie Biom´edicale, Sorbonne Universit´e, UPMC Universit´e Paris 06, CNRS, INSERM, F-75013 Paris, France fService de M´edecine Nucl´eaire, Groupe hospitalier Piti´e-Salpˆetri`ere, Assistance Publique des Hˆopitaux de Paris (AP-HP), Paris, France gService de Neurophysiologie, Groupe hospitalier Piti´e-Salpˆetri`ere, Assistance Publique des Hˆopitaux de Paris (AP-HP), Paris, France hComa Science Group, GIGA Consciousness, University of Li`ege, Belgium
iCentre du Cerveau2, University Hospital of Li`ege, Belgium
A R T I C L E I N F O Keywords:
Disorders of consciousness Positron emission tomography Electroencephalography Diagnosis
Cognitive-motor dissociation
A B S T R A C T
Introduction: Functional brain-imaging techniques have revealed that clinical examination of disorders of
con-sciousness (DoC) can underestimate the conscious level of patients. FDG-PET metabolic index of the best pre-served hemisphere (MIBH) has been reported as a promising measure of consciousness but has never been externally validated and compared with other brain-imaging diagnostic procedures such as quantitative EEG.
Methods: FDG-PET, quantitative EEG and cognitive evoked potential using an auditory oddball paradigm were
performed in minimally conscious state (MCS) and vegetative state (VS) patient. We compared out-sample diagnostic and prognostic performances of PET-MIBH and EEG-based classification of conscious state to the current behavioral gold-standard, the Coma Recovery Scale – revised (CRS-R).
Results: Between January 2016 and October 2019, 52 patients were included: 21 VS and 31 MCS. PET-MIBH had
an AUC of 0.821 [0.694–0.930], sensitivity of 79% [62–91] and specificity of 78% [56–93], not significantly different from EEG (p = 0.628). Their combination accurately identified almost all MCS patients with a sensi-tivity of 94% [79–99%] and specificity of 67% [43–85]. Multimodal assessment also identified VS patients with neural correlate of consciousness (4/7 (57%) vs. 1/14 (7%), p = 0.025) and patients with 6-month recovery of command-following (9/24 (38%) vs. 0/16 (0%), p = 0.006), outperforming each technique taken in isolation.
Conclusion: FDG-PET MIBH is an accurate and robust procedure across sites to diagnose MCS. Its combination
with EEG-based classification of conscious state not only optimizes diagnostic performances but also allows to detect covert cognition and to predict 6-month command-following recovery demonstrating the added value of multimodal assessment of DoC.
1. Introduction
Disorders of consciousness (DoC) are common consequences of se-vere brain injury. They comprise heterogeneous conditions, with pa-tients either suffering from a complete loss of awareness, as in the vegetative state (also termed unresponsive wakefulness syndrome – VS/ UWS) (Jennett and Plum, 1972; Laureys et al., 2010), or patients
exhibiting minimal but definite signs of external awareness, as in the minimally conscious state (MCS) (Giacino et al., 2002). The differential diagnosis is mainly based on behavioral assessments, among which the coma recovery scale – revised (CRS-R) is the current gold-standard (Kalmar and Giacino, 2005). However, recent advances indicate that behavioral evaluation alone may be inadequate, as residual signs of awareness can be identified using brain-imaging techniques in
* Corresponding author at: Brain and Spine Institute, 47 boulevard de l’hˆopital, 75013 Paris, France.
E-mail address: bertrand.hermann@aphp.fr (B. Hermann).
Contents lists available at ScienceDirect
NeuroImage: Clinical
journal homepage: www.elsevier.com/locate/yniclhttps://doi.org/10.1016/j.nicl.2021.102601
NeuroImage: Clinical 30 (2021) 102601
2
~15–25% of clinically unresponsive patients (Cruse et al., 2011; King et al., 2013b; Owen et al., 2006). The presence of covert cognition furthermore appears to hold important prognostic significance (Sitt et al., 2014; Claassen et al., 2019). In light of these considerations, neuroimaging tools are essential both to complement the clinical diag-nosis and to investigate the neurophysiological basis of the disorders (Hermann et al., 2020a). Among the available tools, 18
F-fluoro-deoxy-glucose positron emission tomography (FDG-PET) has consistently demonstrated a metabolic reduction to approximately 50% of brain glucose uptake across various unconscious conditions, from anesthesia, to sleep, to DoC. As such it has been proposed as a diagnostic tool for DoC patients (Stender et al., 2014, 2015). Yet, in the aforementioned studies, diagnostic labels relied on the subjective assessment of PET results and/or seed-based normalization procedures, prone to odd re-sults in this specific population. In 2016, Stender et al., proposed a novel normalization procedure resulting in a simple measure of cerebral metabolic activity, which showed the best diagnostic performances to date (Stender et al., 2016). Alas, this measure, which requires on-site acquisition of healthy controls, has never been validated outside the initial center and its generalizability remains unknown. Other diagnostic tools, easier to implement at bedside, have been proposed. Electro-physiology allows reliable and robust automatic classification of conscious versus unconscious states based both on EEG brain activity (Engemann et al., 2018; Sitt et al., 2014) and event-related potentials (ERP) during cognitive tasks such as the auditory local–global paradigm (Bekinschtein et al., 2009a; Faugeras et al., 2011, 2012). As these techniques develop and become more readily available, it is increasingly necessary to understand the interrelation of the physiological data they provide. In this context, glucose metabolism as measured by FDG-PET has been previously associated with EEG-derived network metrics of interconnected central hubs (Chennu et al., 2017) and correlated with resting-state fMRI connectivity maps (Soddu et al., 2016). While such comparative studies remain rare, they are nonetheless critical to the wider implementation of multimodal neuroimaging techniques in routine care as recommended in the latest guidelines (Giacino et al., 2018).
We here aimed to determine the external validity of the FDG-PET metabolic index for DoC diagnosis, in comparison with EEG-based classification. We further explored whether a multimodal approach combining PET and EEG would add value to the diagnosis and prog-nostication of DoC.
2. Material and methods
2.1. Ethics statement
The protocol conformed to the Declaration of Helsinki, to the French regulations, and was approved by the local ethic committee (Comit´e de Protection des Personnes n◦ 2013-A01385-40) Ile de France 1 (Paris,
France) under the code ‘Recherche en soins courants’ (routine care research). Informed consent was obtained from patient’s relative. 2.2. Population inclusion and exclusion criteria
We prospectively included patients with prolonged DoC, admitted to the Neurological Intensive Care Unit of the Piti´e-Salpˆetri`ere university hospital (Paris, France) between January 2016 and October 2019. All patients were transferred for specialized diagnosis, in order to determine their state of consciousness. The admission lasted approximately one week, during which they undergone repeated behavioral assessment, high-density EEG recording and FDG-PET. Only patients without me-chanical ventilation could be scanned and were included. Patients who received sedation in the 48 h prior to acquisition were excluded. Pre-viously acquired PET images from 32 healthy subjects without history of neurological disorders were used as controls.
2.3. Behavioral assessment
Behavioral evaluation relied on the gold-standard CRS-R (Giacino and Kalmar, 2005). This scale evaluates the patient’s response to a set of hierarchically ordered items in six different domains: auditory, visual, motor, language and oromotor, communication and arousal. During the hospitalization, several CRS-R were performed by trained physicians in order to increase diagnostic accuracy. The reference standard was the highest detected level of consciousness, as defined by the best response obtained among all CRS-R scorings. We collected the 6-month outcome by phone interview of the treating physician and/or family. Since re-covery of consciousness is expected to be rare in this short timeframe for chronic DoC, we focused on a more reasonable yet clinically relevant outcome, the recovery of command-following (defined as the repro-ducible response to command following CRS-R scoring guidelines) in initially unresponsive patients as in Claassen et al. (2019).
2.4. PET acquisition and image analysis 2.4.1. Acquisition
PET images were acquired on a Philips Gemini GXL scanner (Philips Medical Systems) in the nuclear medicine department. Patients and controls received a bolus injection of FDG adjusted to body weight (2 MBq/kg) and were kept at rest in a dark and quiet room. PET images were recorded starting from 20 min to 1 h after the circulation of the tracer using two different protocols: the first consisted in the static acquisition of a single 15 min frame, the second, used in restless patients in order to minimize motion artifacts, consisted in the acquisition of three consecutives frames of 5 min each. Images were then recon-structed using iterative LOR-RAMLA algorithm (2 iterations), with a « standard » post-reconstruction filter. All corrections (attenuation, scat-ter and random coincidence) were integrated in the reconstruction. 2.4.2. Quantitative normalization procedure
Quality of PET images was assessed by nuclear medicine physicians, blinded to the patients state of consciousness and PET data of insuffi-cient quality were discarded. PET acquired more than one hour after the tracer injection were also discarded according to standard clinical practice. The uptake quantification procedure followed steps described by Stender et al. (2016). The image is hereby normalized to match uptake-histograms of extracerebral cephalic tissues, as opposed to common methods normalizing brain metabolism to a specific cerebral region (such as the cerebellum). First, images were registered to a common template in MNI space by affine and non-linear trans-formations. They were then segmented (left and right cerebral cortices and extracerebral tissue) and normalized on the metabolism of the extracerebral tissue in reference to controls (by minimization of the Jensen-Shannon divergence between patients and the control distribu-tion). Finally, brain metabolic activity was scaled by setting the mean activity of extracerebral regions to an index value of one. Metabolic index of the best preserved hemisphere (MIBH) was computed as the highest mean metabolic activity of the two hemispheres. For the dy-namic acquisition, the quantification procedure was performed on each one of the three frames and the resulting normalized images were then averaged.
2.5. EEG acquisition and analysis 2.5.1. Acquisition and preprocessing
High-density (256 electrodes) scalp EEG were recorded at bedside the during local–global auditory oddball paradigm. This paradigm probes the unconscious and conscious processing of auditory novelty through the manipulation of two temporal levels of auditory regularities violation, respectively on a short-time scale (local, within a series of five sound, the last one being either a standard or a deviant tone according to the four preceding sounds) or on a long-time scale (global, across series
of five sounds) (see Supplementary Material 1a). The latter is able to elicit the P3b signature of conscious auditory processing (Bekinschtein et al., 2009a; King et al., 2013a). EEG were preprocessed using a pre-viously described pipeline (epochs segmentation, automated rejection of artifacted epochs and channels based on amplitude and variance of the signal, bad channels interpolation, discarding of EEG of insufficient quality based on a priori specified criteria and lastly, baseline correc-tion) (Engemann et al., 2018, 2015) (see Supplementary Material 1b). 2.5.2. EEG-based automatic classification of conscious states
112 features reflecting averages and fluctuations in time and space of 28 markers of spectral power (normalized and raw δ [1–4 Hz], θ [4–8 Hz], α [8–12 Hz], β [12–30 Hz], and γ [30–45 Hz] power, spectral
en-tropy, median spectral frequency, spectral edge 90th and 95th), con-nectivity (weighted symbolic mutual information in the theta-alpha range [4–10 Hz] (King et al., 2013b), complexity (Kolmogorov-Chaitin complexity and permutation entropy) and evoked responses (contingent negative variation, P1, P3a, P3b and contrasts from the local–global oddball paradigm including mismatch negativity) were computed from the EEG signal and subsequently used to predict the patients state of consciousness using a linear support vector machine (SVM) algorithm as previously described (Sitt et al., 2014; Engemann et al., 2018) (see Supplementary Material 1c for details regarding the markers computa-tion and the SVM algorithm).
2.5.3. Auditory oddball local and global effect
Evoked responses to the local and global contrasts were computed using t-tests for unequal variance over the whole time-series. To deter-mine the presence of a local and/or global effect in individual subjects,
we used the previously published stringent triple-threshold criteria (Faugeras et al., 2012). An effect was considered present, if a significant difference (p-value ≤ 0.01) was observed on at least 5 consecutive time samples and 10 adjacent electrodes starting from the onset of the fifth sound and if this difference was stronger than any differences observed during the baseline period (either lower minimal p-value or if equal, longer duration). Accordingly, three groups of patients were identified: absent local and global effect, local effect only and global effect (regardless of the presence of a local effect, as the global effect indexes a higher level in the auditory novelty processing hierarchy).
2.6. Statistical analysis
We assessed in-sample and out-of-sample diagnostic performances of two index tests, the FDG-PET MIBH and the EEG-based prediction of conscious state, using the standard following discrimination metrics with their 10,000 bootstrapped 95% confidence interval (CI95%): area under the ROC curves (AUC), sensitivity, specificity, positive and negative predictive values, positive and negative likelihood ratios, and accuracy. For the FDG-PET, in-sample performances were derived from the optimal MIBH threshold according to the ROC curve, while out-of- sample performances were derived from the use of the 3.18 MIBH threshold value set by Stender et al. based on data from Li`ege University Hospital (Stender et al., 2016). For in-sample EEG performances, the SVM algorithm was trained and tested on the same patients, namely the cohort of patients included in the study. Out-of-sample performances were obtained by training the SVM classifier on a previously published dataset (Engemann et al., 2018) from which we excluded the patients included in the study to avoid overfitting, yielding a total of 341 Fig. 1. Flow chart. CRS-R: coma recovery
scale – revised; EMCS: emergence from minimally conscious state; FDG-PET: 18
F-flu-oro-deoxyglucose positron emission tomog-raphy; MCS: minimally conscious state; MIBH: metabolic index of the best preserved hemisphere; VS/UWS: vegetative state/unre-sponsive wakefulness syndrome. In order to diagnose MCS (target condition), the new diagnostic procedure, the FDG-PET MIBH (index test), was compared to the best state of consciousness observed across the repeated CRS-R (reference standard).
NeuroImage: Clinical 30 (2021) 102601
4
recordings (VS/UWS n = 170, MCS n = 171 acquired from 267 inde-pendent subjects). Predicted probability of MCS classification (as opposed to VS/UWS) was obtained from the SVM output through Platt scaling. Since this output is probabilistic, discrimination metrics were computed for a 0.5 threshold in both conditions. ROC curves compari-sons were tested using 10,000 bootstrapped replicates. Sensitivities and specificities were compared using McNemar test for paired design. Quantitative data were expressed as median [interquartile range] and compared through Mann-Whitney-U and categorical data were expressed as number (percentage) and compared through chi-squared
test or Fisher’s exact test as appropriate. Correlation between the MIBH and the CRS-R was performed using spearman correlation coefficient.
3. Data and software availability
Ethic committee does not allow the open sharing of raw human pa-tients data (notably of brain-imaging data). However, post-processed anonymized metadata are provided in supplementary material. The list of software used can be found in Supplementary material 1d.
4. Results
4.1. Population
Among the 182 DoC patients evaluated during the study period, 89 were eligible for PET, 74 were scanned and 57 were included in the analysis: 23 in VS/UWS and 34 in MCS (Fig. 1). Additionally, 7 FDG-PET recordings of patients in EMCS were available. Diagnostic performance measures of the FDG-PET and EEG were restricted to the VS/UWS and MCS population. Importantly, no significant differences were found between VS/UWS and MCS patients in terms of number of CRS-R per-formed, CRS-R arousal score, delay between PET and best CRS-R, and PET acquisition parameters (acquisition protocol, tracer dose and time from tracer injection, concomitant drugs), except for the blood glucose concentration which remained within normal range (5.9 [5.2–6.6] in VS/UWS patients vs. 5.3 [4.8–5.8] in MCS patients, p = 0.019, Table 1 and Supplementary material 2a, b & c).
4.2. Validation of the FDG-PET metabolic index as a reliable diagnostic tool
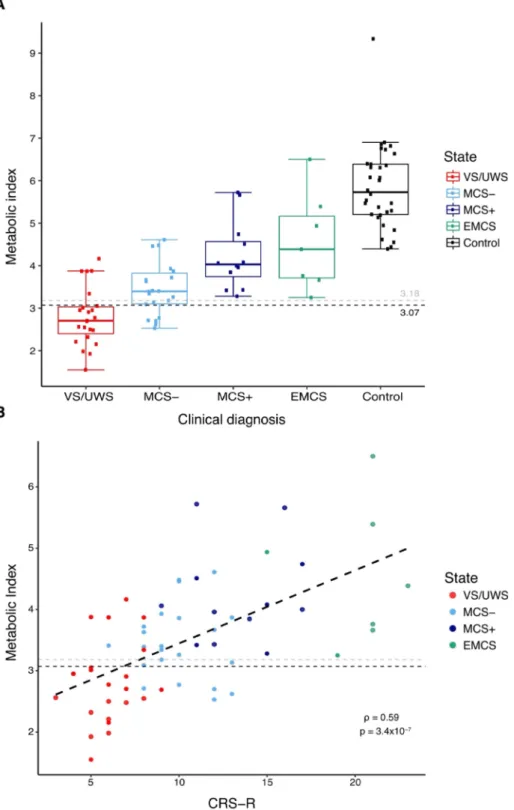
We first evaluated the in-sample FDG-PET performances of the MIBH to diagnose MCS, as compared to the reference gold-standard, i.e. the best state of consciousness observed over CRS-R measurement(s). VS/ UWS patients had a significantly lower MIBH than MCS patients (median MIBH of 2.70 [2.40–3.03] vs. 3.65 [3.26–4.04], p < 10−4), with an AUC
of 0.821 [0.694–0.930]).
At the optimal MIBH cut-off of 3.07, corresponding to 54% of the healthy controls metabolism (5.73 [5.20–6.39]), accuracy was 84% [71–92], positive predictive value was 85% [69–95], negative predic-tive value was 78% [56–93], sensitivity was 85% [69–95] and speci-ficity was 78% [56–93]. Similar discrimination performances were found when adjusting for blood glucose levels and scanning protocol (see Supplementary Material 2d). Using the previously published diag-nostic threshold of 3.18 for external validation still resulted in good discrimination performances with an accuracy of 79% [66–89], positive predictive value of 84% [67–95], negative predictive value of 72% [51–88], sensitivity of 79% [62–91] and specificity 78% [56–93]. As expected, all EMCS patients had a score above threshold (4.39 [3.71–5.16]) and interestingly, all MCS patients with a score below threshold were MCS minus patients (MCS-), that is MCS patients without clinical evidence of language preservation, contrary to MCS plus patients (MCS+) (Fig. 2A). MIBH also correlated strongly with the CRS-R score (spearman ρ = 0.59, p < 10-4, Fig. 2B). These reliable performances validate the FDG-PET as a robust method to diagnose MCS across centers.
4.3. FDG-PET outperforms EEG-based classification
In order to evaluate the added value of the FDG-PET, we compared its diagnostic performances to a validated and robust EEG-based clas-sification tool (Sitt et al., 2014) which demonstrated its ability to generalize to different settings: centers, paradigms, number of EEG channels and length of recordings (Engemann et al., 2018). Among the 57 EEG recordings, 5 did not pass the automated preprocessing and Table 1
FDG-PET Population characteristics.
Variable All
N = 57 VS/UWS N = 23 MCS N = 34 p
Demographic characteristics
Age, years, median
[IQR] 45.6 [28.9–56.2] 47.2 [28.8–56.2] 45.2 [31.3–55.9] 0.715 Sex, M/F ratio 1.6 1.9 1.4 0.834 Etiology, n(%) -Anoxia -Traumatic -Vascular -Other* 21 (37%) 18 (32%) 8 (14%) 10 (17%) 15 (65%) 6 (26%) 0 (0%) 2 (9%) 6 (17%) 12 (35%) 8 (24%) 8 (24%) <10- 3 ˚
Time since injury,
days 209 [103–77] 194 [105–500] 340 [104–940] 0.317 Behavior Nb of CRS-R 3 [2–4] 3 [2–4] 3 [2–4] 0.653 CRS-R total score 9 [6–12] 6 [5–7] 11 [9–13] <10- 3 CRS-R arousal score 2 [1–2] 2 [1–2] 2 [1–2] 0.679 FDG-PET acquisition
Delay from best CRS-R − 1 [-1–1] 0 [-1–1] −1 [-1–1] 0.973 Weight, kg 64 [55–77] 70 [53–78] 60 [55–76] 0.474 Blood glucose, mmol/L 5.4 [4.8–6.1] 5.9 [5.2–6.6] 5.3 [4.8–5.8] 0.019 Tracer dose, MBq 134 [122–159] 140 [126–159] 133 [121–155] 0.366 Protocol -Static -Dynamic 45 (79%) 12 (21%) 17 (74%) 6 (26%) 28 (82%) 6 (18%) 0.663 Injection delay, minutes 37.0 [32.0–42.4] 37.5 [31.5–48.2] 37.0 [32.3–42.0] 0.929 EEG
Delay from best
CRS-R 0 [0–0] 0 [0–0] 0 [-2.5–0] 0.904 Acquisition -Recorded -Analyzable 57 (100%) 52 (91%) 23 (100%) 21 (91%) 34 (100%) 31 (91%) 1.0 1.0 Preprocessing -Nb of rejected channels -Nb of rejected epochs 15 [11.75–23.5] 109 [31–216.75] 15 [13–23] 105 [14–228] 16 [11.5–23] 129 [37.5–203] 0.588 0.569 Local-global paradigm (n = 52) -Global effect -Local effect -No effect 16 (31%) 15 (29%) 21 (40%) 5 (24%) 5 (24%) 11 (52%) 11 (26%) 10 (32%) 10 (32%) 0.402˚
CRS-R: coma recovery scale – revised; EEG: electroencephalogram; MCS: mini-mally conscious state; Nb: number; VS/UWS: vegetative state/unresponsive wakefulness syndrome.
Quantitative data are expressed as median [interquartile range] and compared Mann-Whitney-U test. Categorical data are expressed as number (percentage) and compared through chi-squared test (except when˚in which case Fisher’s exact test was used).
*Other etiologies are: hypoglycemia (n = 2), status epilepticus (n = 2),
neurologic sequelae of craniopharyngioma surgery (n = 1), tuberculosis men-ingitis (n = 1), opioid toxic encephalopathy (n = 1), cerebral fat embolism syndrome (n = 1), acute demyelinating encephalomyelitis (n = 1) and leu-coencephalopathy of unknown origin (n = 1).
quality control pipeline, leaving a population of 52 patients (21 VS/UWS and 31 MCS) in which we compared FDG-PET and EEG performances (Table 2 and Fig. 3).
In-sample FDG-PET performances in this population were similar to the one of the whole PET population and EEG and FDG-PET perfor-mances were not significantly different (p = 0.218). EEG out-of-sample discrimination performances were: AUC of 0.770 [0.619–0.896], accu-racy of 67% [53–80], sensitivity of 58% [39–75] and specificity of 81% [58–95]. While AUC were not significantly different (p = 0.628), the FDG-PET had a higher sensitivity than EEG (paired McNemar test p = 0.033) with no difference in specificity (p = 0.655).
4.4. A multimodal approach identifies covert consciousness and improves prognostication
Ideally, a perfect brain-imaging diagnostic tool for DoC patients should first identify all clinically MCS patients. We thus tested if multimodal brain-imaging combining FDG-PET and EEG (MIBH higher than Li`ege threshold for MCS and/or EEG-based predicted probability of MCS > 0.5) could outperform any of the two imaging modality taken in isolation. The combination of the PET MIBH with the EEG-based clas-sification indeed accurately identified almost all MCS patients, yielding an improved sensitivity of 94% [79–99%] with a specificity of 67% Fig. 2. FDG-PET metabolic index and
conscious-ness. (A) Higher metabolic index of the best pre-served hemisphere values are obpre-served with increasing state of consciousness, from vegetative state/unresponsive wakefulness syndrome (VS/ UWS), minimally conscious state minus (MCS-), minimally conscious state plus (MCS+) to emer-gence from minimally conscious state (EMCS) pa-tients (control papa-tients used for the normalization are in black). Dashed lines optimal in-sample (black) and out-of-sample (gray) thresholds for VS/UWS discrimination. (B) Significant correlation of the metabolic index with the Coma Recovery Scale – revised (CRS-R) scores, Spearman’s rho = 0.59, p < 10-4.
NeuroImage: Clinical 30 (2021) 102601
6
[43–85], a positive predictive value of 81% [62–99] and negative pre-dictive value of 88% [62–98]. Sensitivity of the combination was significantly higher than the one of EEG alone (paired McNemar test p < 0.001) and there was a trend towards a higher sensitivity than the one of FDG-PET alone (p = 0.083). But more importantly, since residual ac-tivity in higher-order cortical areas (higher-order cortex motor dissoci-ation [HMD]) and even preserved brain activdissoci-ation in response to motor commands during active tasks despite absent behavioral response (cognitive-motor dissociation [CMD]) have been demonstrated in some clinically unresponsive patients using brain-imaging (Owen et al., 2006; Cruse et al., 2011; Claassen et al., 2019; Schiff, 2015; Edlow, 2018), the CRS-R may not be an adequate gold-standard to measure the ability of a new diagnostic tool to detect residual signs of cognition. We thus investigated the potential added value of the combination of FDG-PET and EEG in unresponsive patients using two measures independent from the CRS-R and relevant to the diagnosis of consciousness: an ERP correlate of conscious auditory perception and 6-month outcome. Seven out of the 21 (33%) clinically VS/UWS patients exhibited a higher metabolism and/or richer brain electrophysiological activity than ex-pected. Interestingly 4 of these (57%) also exhibited an ERP global effect that indicates preserved conscious processing of auditory novelty (Bekinschtein et al., 2009a; Faugeras et al., 2011; King et al., 2013a). This was in contrast to the very low proportion of patients classified as VS/UWS by both behavior and neuro-imaging techniques and showing a global effect (1/14 (7%), fisher exact test p = 0.025). Moreover, the combination of PET and EEG was significantly associated with 6-month recovery of command-following in initially unresponsive patients (re-covery in 9/24 (38%) of patients with high FDG-PET metabolism and/or rich EEG activity vs. in 0/16 (0%) of patients with low-level FDG-PET metabolism and EEG activity, fisher exact test p = 0.006), while either FDG-PET or EEG alone were not significantly associated with 6-month command-following (7/19 (37%) vs. 2/21 (10%), fisher exact test p =0.060 for FDG-PET and 5/13 (38%) vs. 4/27 (15%), p = 0.120 for EEG). These results strongly suggest that the combination of FDG-PET
and EEG accurately identified residual signs of high cognitive function fostering the recovery of command-following in otherwise clinically unresponsive patients.
5. Discussion
In this study, we showed that external implementation and gener-alization of the MIBH quantification procedure of FDG-PET glucose uptake was practically feasible, and enabled accurate diagnosis of pro-longed DoC. In our cohort, we found that the approximate metabolic boundary between MCS and VS/UWS was 50% of normal metabolism, slightly higher than previously found by Stender et al. (2016). While this difference could be due to site and/or protocol specific factors, our re-sults align well with previous findings in DoC patients, sleep and anes-thesia (Braun et al., 1997; Maquet et al., 1997; Nofzinger et al., 2002; Laureys et al., 2004; Shulman et al., 2009; Laureys and Schiff, 2012). More generally, these differences could be due to the natural variability of brain metabolism even among normal healthy subjects. All in all, our results confirm that quantitative FDG-PET using the MIBH quantifica-tion procedure is easy to apply, accurate and robust across sites to di-agnose the state of consciousness in this severely brain-injured population.
We also showed that FDG-PET performed slightly better than EEG to diagnose DoC, with a difference in performance seemingly driven by a greater number of EEG-based false-negatives (i.e. clinically MCS pa-tients estimated by the EEG classification to be unconscious). This phenomenon may be explained by common fluctuations of awareness among DoC (Bekinschtein et al., 2009b). While FDG-PET integrates brain activity across tens of minutes and could therefore be less sus-ceptible to these fast and transient changes, EEG records brain activity in the millisecond range and is likely more affected. Yet, EEG availability and robust performances (Engemann et al., 2018) still make it a great candidate to bedside diagnostic assessment of patients, at least as a first- line/screening diagnostic procedure. Indeed, FDG-PET logistic Table 2
Diagnostic performances of PET-FDG and EEG.
IN-SAMPLE PERFORMANCES
Imaging Metrics FDG-PET EEG FDG-PET|EEG
Contingency table MCS VS All MCS VS All MCS VS All
þ 27 5 32 þ 29 6 35 þ 31 8 39
¡ 4 16 20 ¡ 2 15 17 ¡ 0 13 13
All 31 19 52 All 31 21 52 All 31 21 52
AUC 0.816 [0.681–0.928] 0.912 [0.807–0.986] 0.810 [0.714–0.905] Accuracy 83 [70–92] 85 [72–93] 85 [72–93] Sensitivity 87 [70–96] 94 [79–99] 100 [89–100] Specificity 76 [53–92] 71 [48–89] 62 [38–82] Positive PV 84 [67–95] 83 [66–93] 79 [64–91] Negative PV 80 [56–94] 88 [64–99] 100 [75–100] Positive LR 3.66 [1.68–7.96] 3.27 [1.65–6.48] 2.62 [1.52–4.53] Negative LR 0.17 [0.07–0.44] 0.09 [0.02–0.35] 0.00 [0.00-Inf] OUT-OF-SAMPLE PERFORMANCES
Imaging Metrics FDG-PET EEG FDG-PET | EEG
Contingency table MCS VS All MCS VS All MCS VS All
þ 26 5 31 þ 18 4 22 þ 29 7 36
¡ 5 16 21 ¡ 13 17 30 ¡ 2 14 16
All 31 21 52 All 31 21 52 All 31 21 52
AUC 0.816 [0.681–0.928] 0.770 [0.619–0.896] 0.801 [0.689–0.905] Accuracy 82 [69–91] 67 [53–80] 83 [70–92] Sensitivity 84 [66–95] 58 [39–75] 94 [79–99] Specificity 76 [53–92] 81 [58–95] 67 [43–85] Positive PV 84 [66–95] 82 [60–95] 81 [62–99] Negative PV 76 [53–92] 57 [37–75] 88 [62–98] Positive LR 3.52 [1.61–7.69] 3.05 [1.20–7.73] 2.81 [1.52–5.17] Negative LR 0.21 [0.09–0.49] 0.52 [0.33–0.82] 0.10 [0.02–0.38]
EEG: electroencephalogram; LR: likelihood ratio; MCS: minimally conscious state; PV: predictive value; VS: vegetative state/unresponsive wakefulness syndrome state; |: and/or; +: test positive; − : test negative.
Values are expressed with their 95% confidence interval.
requirements exceed those of bedside EEG, and it should be noted that even in our expert center, PET-scanning of mechanically ventilated pa-tients was not possible. Besides, whereas FDG-PET provides information on the localization and amount of neuronal firing, it does not inherently provide insights into the underlying information processing. In contrast, EEG explores the qualitative features of the information exchange, but has limited anatomical resolution and the signal is difficult to quantify. Thus EEG and FDG-PET theoretically capture partially overlapping, yet independent, features of the DoC pathophysiology, which could com-plement each other. Although the good diagnostic agreement between
the two modalities fulfills the need of consilience between brain- imaging procedures to address the diagnostic challenge of HMD and CMD (Peterson, 2016), the combination of both techniques clearly im-proves both the diagnosis and prognostication of DoC. Indeed, this combination satisfies the criterion of maximization of MCS diagnosis sensitivity, but most importantly, it allows to identify covert cognition in otherwise unresponsive patients. Although, our study does not provide definite answers as to the cognitive status of the seven clinically VS/ UWS patients, who were classified as MCS using both PET and EEG, it is notable that their proportion corresponds to previous reports on the Fig. 3. FDG-PET and EEG performances. ROC curves of in-sample (left) and out-of-sample (right) diagnostic performances of FDG-PET (yellow) and EEG-based
classification (green) with corresponding discrimination area under the curve (AUC). Similar in-sample AUC were found for FDG-PET and EEG (0.816 vs. 0.912, p = 0.218) while FDG-PET slightly outperformed EEG, however not significantly, on out-sample performances (0.816 vs. 0.770, p = 0.628). (B) Scatterplot rep-resentation of the support vector machine (SVM) classifier probability to be classified MCS according to the FDG-PET metabolic index of the best preserved hemisphere (MIBH) and the absence (circle) or presence of unconscious (local effect, triangle) or conscious (global effect, square) auditory processing of auditory novelty during the ‘local-global’ paradigm. Dashed gray lines represent thresholds for minimally conscious state (MCS) vs. vegetative state/unresponsive wakefulness syndrome (VS/UWS) discrimination. (For interpretation of the references to colour in this figure legend, the reader is referred to the web version of this article.)
NeuroImage: Clinical 30 (2021) 102601
8
prevalence of covert cognition after severe brain injury (Kondziella et al., 2016). Besides, more than half of these patients with absent behavioral responsiveness but rich PET/EEG activity showed an ERP neural signature of conscious access in the local–global paradigm. In contrast, only 1 of the 14 behaviorally VS/UWS patients confirmed by PET/EEG showed this global effect signature (Bekinschtein et al., 2009a; Faugeras et al., 2011, 2012; Raimondo et al., 2017), suggesting a covert cognitive state richer than the one inferred from their behavior in the former (Schiff, 2015; Edlow et al., 2017). This is further supported by the higher recovery of command-following at 6 months observed in initially unresponsive patients with rich PET and/or EEG activity. This finding is in line with previous studies showing that both FDG-PET (Stender et al., 2014, 2016) and EEG-based classification (Sitt et al., 2014; Claassen et al., 2019; Chennu et al., 2017) convey meaningful prognostic information. Here, again, we show that the combination of PET and EEG outperforms both modalities in isolation. Overall, our re-sults provide evidence in favor of the multimodal assessment of DoC, as previously proposed theoretically (Bayne et al., 2017; Naccache, 2018) and recommended although with little evidence so far (Giacino et al., 2018). Such assessment should combine different clinical and brain- imaging techniques to investigate the degree of preservation of neuronal architecture involved in conscious processing and conscious-ness recovery.
Our study still have some limitations that should be underlined. First and foremost, clinical misdiagnosis cannot be excluded in a few VS/UWS patients due to the limited number of CRS-R performed. Indeed, ac-cording to the recent monocentric report from Wannez et al. (2017), several CRS-R (at least 3 and optimally 5) are requested to capture the patient’s best conscious state due to frequent fluctuations in arousal and consciousness in this population. Although there was no statistical dif-ference in the number of CRS-R performed between VS/UWS and MCS patients, we may have underestimated the conscious state of some VS/ UWS as one VS/UWS patient had only one CRS-R and 6 had two CRS-R (individual data with the number of CRS-R performed are provided in supplementary material). However, all of these VS/UWS patients had congruent brain-imaging data (below threshold PET MIBH and VS/UWS EEG classification) and outcome (all were still alive and unresponsive at 6 months), making a clinical misclassification very unlikely. Second, EEG, FDG-PET and the best CRS-R were not always performed on the same day, although the delay was short and did not differ between VS/ UWS and MCS. Although we externally validated both the FDG-PET and EEG, their limited availability still limit their use in DoC diagnosis. It should also be noted that the local-global auditory oddball paradigm is a passive paradigm, by contrast to active ‘command-following’ paradigm usually used to diagnose CMD. In the latter, patients are instructed to perform a task and subsequent changes in cerebral activity provide stimulus-independent activations whose interpretations regarding the intentionality and residual awareness of patients is less ambiguous than in passive paradigm. The latter allow to detect activation in higher-order associative cortices in response to environmental stimuli, corresponding to what has been called HMD, which may or may not be associated with the presence of the ability to follow command. Nonetheless, there are several reasons to believe that a global effect is indicative of conscious processing, since i) during the local-global paradigm, the patient is instructed to actively count the number of deviant sound sequences, ii) the presence of a global effect is thought to reflect the recognition of the violation of auditory regularities over a long-time scale which requires the active maintenance of the rule in working memory, a property associated with conscious perception, and iii) the global effect corre-spond to a late and sustained P3b component, which was repeatedly associated with conscious access in healthy subjects as well as in patients (Bekinschtein et al., 2009a; Faugeras et al., 2011; Hermann et al., 2020b; P´erez et al., 2021).
6. Conclusion
FDG-PET MIBH is an accurate and robust procedure across sites to diagnose MCS. Its combination with EEG-based classification of conscious state not only optimizes diagnostic performances but also allows to detect residual cortical activation suggestive of remaining conscious processing and to predict 6-month command-following re-covery. Overall, we show that a multimodal approach combining FDG- PET and EEG provide complementary information on DoC physiopa-thology improving both their diagnosis and prognostication.
CRediT authorship contribution statement
Bertrand Hermann: Conceptualization, Funding acquisition,
Methodology, Investigation, Formal analysis, Writing - original draft;
Johan Stender: Conceptualization, Methodology, Investigation, Formal
analysis, Writing - original draft; Marie-Odile Habert: Conceptualiza-tion, InvestigaConceptualiza-tion, Writing - review & editing; Aur´elie Kas: Investiga-tion, Writing - review & editing; M´elanie Denis-Valente: InvestigaInvestiga-tion, Data curation; Federico Raimondo: Data curation, Formal analysis;
Pauline P´erez: Investigation; Benjamin Rohaut: Investigation, Writing
- review & editing; Jacobo Diego Sitt: Conceptualization, Methodology, Writing - review & editing; Lionel Naccache: Conceptualization, Funding acquisition, Methodology, Writing - original draft, Supervision.
Funding
BH was funded by a “Bourse poste d’Accueil” from “Institut National de la Recherche M´edicale”. This work was also supported by the FRM 2015 (LN), the Acad´emie des Sciences-Lamonica Prize 2016 (LN) and by the ‘Recovery of consciousness after severe brain injury Phase II’ grant of the James S. McDonnell Foundation. The research leading to these re-sults has received funding from the program “Investissements d’avenir” ANR-10- IAIHU-06.
Appendix A. Supplementary data
Supplementary data to this article can be found online at https://doi. org/10.1016/j.nicl.2021.102601.
References
Jennett, B., Plum, F., 1972. Persistent vegetative state after brain damage. A syndrome in search of a name. Lancet 299 (7753), 734–737. https://doi.org/10.1016/S0140- 6736(72)90242-5.
Laureys, S., Celesia, G.G., Cohadon, F., Lavrijsen, J., Le´on-Carri´on, J., Sannita, W.G., Sazbon, L., Schmutzhard, E., von Wild, K.R., Zeman, A., Dolce, G., 2010. Unresponsive wakefulness syndrome: a new name for the vegetative state or apallic syndrome. BMC Med. 8 (1) https://doi.org/10.1186/1741-7015-8-68.
Giacino, J.T., Ashwal, S., Childs, N., Cranford, R., Jennett, B., Katz, D.I., Kelly, J.P., Rosenberg, J.H., Whyte, J., Zafonte, R.D., Zasler, N.D., 2002. The minimally conscious state definition and diagnostic criteria. Neurology 58 (3), 349–353. Kalmar, K., Giacino, J., 2005. The JFK coma recovery scale-revised. Neuropsychol Rehabil 15 (3-4), 454–460. https://doi.org/10.1080/09602010443000425. Owen, A.M., Coleman, M.R., Boly, M., Davis, M.H., Laureys, S., Pickard, J.D., 2006.
Detecting awareness in the vegetative state. Science 313 (5792), 1402. https://doi. org/10.1126/science:1130197.
Cruse, D., Chennu, S., Chatelle, C., Bekinschtein, T.A., Fern´andez-Espejo, D., Pickard, J. D., Laureys, S., Owen, A.M., 2011. Bedside detection of awareness in the vegetative state: a cohort study. Lancet 378 (9809), 2088–2094.
King, J.R., Faugeras, F., Gramfort, A., Schurger, A., El Karoui, I., Sitt, J.D., Rohaut, B., Wacongne, C., Labyt, E., Bekinschtein, T., Cohen, L., Naccache, L., Dehaene, S., 2013a. Single-trial decoding of auditory novelty responses facilitates the detection of residual consciousness. NeuroImage 83, 726–738. https://doi.org/10.1016/j. neuroimage.2013.07.013.
Sitt, J.D., King, J.-R., El Karoui, I., et al., 2014. Large scale screening of neural signatures of consciousness in patients in a vegetative or minimally conscious state. Brain 137, 2258–2270. https://doi.org/10.1093/brain/awu141.
Claassen, J., Doyle, K., Matory, A., Couch, C., Burger, K.M., Velazquez, A., Okonkwo, J. U., King, J.-R., Park, S., Agarwal, S., Roh, D., Megjhani, M., Eliseyev, A., Connolly, E. S., Rohaut, B., 2019. Detection of brain activation in unresponsive patients with acute brain injury. N Engl J Med 380 (26), 2497–2505. https://doi.org/10.1056/ NEJMoa1812757.
Hermann, B., Ben Salah, A., Perlbarg, V., et al., 2020a. Habituation of auditory startle reflex is a new sign of minimally conscious state. Brain.
Stender, J., Gosseries, O., Bruno, M.-A., Charland-Verville, V., Vanhaudenhuyse, A., Demertzi, A., Chatelle, C., Thonnard, M., Thibaut, A., Heine, L., Soddu, A., Boly, M., Schnakers, C., Gjedde, A., Laureys, S., 2014. Diagnostic precision of PET imaging and functional MRI in disorders of consciousness: a clinical validation study. Lancet 384 (9942), 514–522.
Stender, J., Kupers, R., Rodell, A., Thibaut, A., Chatelle, C., Bruno, M.-A., Gejl, M., Bernard, C., Hustinx, R., Laureys, S., Gjedde, A., 2015. Quantitative rates of brain glucose metabolism distinguish minimally conscious from vegetative state patients. J. Cereb. Blood Flow Metab. 35 (1), 58–65.
Stender, J., Mortensen, K., Thibaut, A., Darkner, S., Laureys, S., Gjedde, A., Kupers, R., 2016. The minimal energetic requirement of sustained awareness after brain injury. Curr. Biol. 26 (11), 1494–1499. https://doi.org/10.1016/j.cub.2016.04.024. Engemann, D.A., Raimondo, F., King, J.-R., et al., 2018. Robust EEG-based cross-site and
cross-protocol classification of states of consciousness. Brain 141, 3179–3192.
https://doi.org/10.1093/brain/awy251.
Hermann, B., Raimondo, F., Hirsch, L., Huang, Y.u., Denis-Valente, M., P´erez, P., Engemann, D., Faugeras, F., Weiss, N., Demeret, S., Rohaut, B., Parra, L.C., Sitt, J.D., Naccache, L., 2020b. Combined behavioral and electrophysiological evidence for a direct cortical effect of prefrontal tDCS on disorders of consciousness. Sci. Rep. 10 (1) https://doi.org/10.1038/s41598-020-61180-2.
Bekinschtein, T.A., Dehaene, S., Rohaut, B., Tadel, F., Cohen, L., Naccache, L., 2009a. Neural signature of the conscious processing of auditory regularities. Proc. Natl. Acad. Sci. 106 (5), 1672–1677.
Faugeras, F., Rohaut, B., Weiss, N., Bekinschtein, T.A., Galanaud, D., Puybasset, L., Bolgert, F., Sergent, C., Cohen, L., Dehaene, S., Naccache, L., 2011. Probing consciousness with event-related potentials in the vegetative state. Neurology 77 (3), 264–268. https://doi.org/10.1212/WNL.0b013e3182217ee8.
Faugeras, F., Rohaut, B., Weiss, N., Bekinschtein, T., Galanaud, D., Puybasset, L., Bolgert, F., Sergent, C., Cohen, L., Dehaene, S., Naccache, L., 2012. Event related potentials elicited by violations of auditory regularities in patients with impaired consciousness. Neuropsychologia 50 (3), 403–418. https://doi.org/10.1016/j. neuropsychologia.2011.12.015.
Chennu, S., Annen, J., Wannez, S., et al., 2017. Brain networks predict metabolism, diagnosis and prognosis at the bedside in disorders of consciousness. Brain 140, 2120–2132. https://doi.org/10.1093/brain/awx163.
Soddu, A., G´omez, F., Heine, L., et al., 2016. Correlation between resting state fMRI total neuronal activity and PET metabolism in healthy controls and patients with disorders of consciousness. Brain Behav. 6 https://doi.org/10.1002/brb3.424 n/a-n/ a.
Giacino, J.T., Katz, D.I., Schiff, N.D., Whyte, J., Ashman, E.J., Ashwal, S., Barbano, R., Hammond, F.M., Laureys, S., Ling, G.S.F., Nakase-Richardson, R., Seel, R.T., Yablon, S., Getchius, T.S.D., Gronseth, G.S., Armstrong, M.J., 2018. Practice guideline update recommendations summary: Disorders of consciousness: Report of the Guideline Development, Dissemination, and Implementation Subcommittee of the American Academy of Neurology; the American Congress of Rehabilitation Medicine; and the National Institute on Disability, Independent Living, and Rehabilitation Research. Neurology 91 (10), 450–460. https://doi.org/10.1212/ WNL.0000000000005926.
Giacino, J.T., Kalmar, K., 2005. Diagnostic and prognostic guidelines for the vegetative and minimally conscious states. Neuropsychol Rehabil 15, 166–174. https://doi.org/ 10.1080/09602010443000498.
Engemann, D., Raimondo, F., King, J.-R., et al., 2015. Automated Measurement and Prediction of Consciousness in Vegetative and Minimally Conscious Patients. https://hal.inria.fr/hal-01225254/document (accessed 19 Dec 2018).
King, J.-R., Sitt, J., Faugeras, F., Rohaut, B., El Karoui, I., Cohen, L., Naccache, L., Dehaene, S., 2013b. Information sharing in the brain indexes consciousness in noncommunicative patients. Curr. Biol. 23 (19), 1914–1919. https://doi.org/ 10.1016/j.cub.2013.07.075.
Schiff, N.D., 2015. Cognitive motor dissociation following severe brain injuries. JAMA Neurol 72 (12), 1413. https://doi.org/10.1001/jamaneurol.2015.2899.
Edlow, B.L., 2018. Covert Consciousness: Searching For Volitional Brain Activity In The Unresponsive. Curr. Biol. 28 (23), R1345–R1348. https://doi.org/10.1016/j. cub.2018.10.022.
Braun, A.R., Balkin, T.J., Wesenten, N.J., et al., 1997. Regional cerebral blood flow throughout the sleep-wake cycle. An H2(15)O PET study. Brain 120 (Pt 7), 1173–1197. https://doi.org/10.1093/brain/120.7.1173.
Maquet, P., Degueldre, C., Delfiore, G., Aerts, J., P´eters, J.-M., Luxen, A., Franck, G., 1997. Functional neuroanatomy of human slow wave sleep. J Neurosci 17 (8), 2807–2812. https://doi.org/10.1523/JNEUROSCI.17-08-02807.1997. Nofzinger, E.A., Buysse, D.J., Miewald, J.M., et al., 2002. Human regional cerebral
glucose metabolism during non-rapid eye movement sleep in relation to waking. Brain 125, 1105–1115. https://doi.org/10.1093/brain/awf103.
Laureys, S., Owen, A.M., Schiff, N.D., 2004. Brain function in coma, vegetative state, and related disorders. Lancet Neurol. 3 (9), 537–546.
Shulman, R.G., Hyder, F., Rothman, D.L., 2009. Baseline brain energy supports the state of consciousness. Proc. Natl. Acad. Sci. 106 (27), 11096–11101. https://doi.org/ 10.1073/pnas.0903941106.
Laureys, S., Schiff, N.D., 2012. Coma and consciousness: paradigms (re)framed by neuroimaging. NeuroImage 61 (2), 478–491. https://doi.org/10.1016/j. neuroimage.2011.12.041.
Bekinschtein, T., Cologan, V., Dahmen, B., et al., 2009b. You are only coming through in waves: wakefulness variability and assessment in patients with impaired consciousness. Prog Brain Res 177, 171–189. https://doi.org/10.1016/S0079-6123 (09)17712-9.
Kondziella, D., Friberg, C.K., Frokjaer, V.G., Fabricius, M., Møller, K., 2016. Preserved consciousness in vegetative and minimal conscious states: systematic review and meta-analysis. J. Neurol. Neurosurg. Psychiatry 87 (5), 485–492. https://doi.org/ 10.1136/jnnp-2015-310958.
P´erez, P., Valente, M., Hermann, B., Sitt, J., Faugeras, F., Demeret, S., Rohaut, B., Naccache, L., 2021. Auditory event-related “Global Effect” predicts recovery of overt consciousness. Front. Neurol. 11, 1797. https://doi.org/10.3389/
fneur.2020.588233.
Peterson, A., 2016. Consilience, clinical validation, and global disorders of
consciousness. Neurosci. Consciousness 2016. https://doi.org/10.1093/nc/niw011. Raimondo, F., Rohaut, B., Demertzi, A., Valente, M., Engemann, D.A., Salti, M.,
Fernandez Slezak, D., Naccache, L., Sitt, J.D., 2017. Brain–heart interactions reveal consciousness in noncommunicating patients. Ann. Neurol. 82 (4), 578–591. https:// doi.org/10.1002/ana.v82.410.1002/ana.25045.
Edlow, B.L., Chatelle, C., Spencer, C.A., et al., 2017. Early detection of consciousness in patients with acute severe traumatic brain injury. Brain 140, 2399–2414. https:// doi.org/10.1093/brain/awx176.
Bayne, T., Hohwy, J., Owen, A.M., 2017. Reforming the taxonomy in disorders of consciousness. Ann Neurol 82 (6), 866–872. https://doi.org/10.1002/ana. v82.610.1002/ana.25088.
Naccache, L., 2018. Minimally conscious state or cortically mediated state? Brain 141, 949–960. https://doi.org/10.1093/brain/awx324.
Wannez, S., Heine, L., Thonnard, M., Gosseries, O., Laureys, S., 2017. The repetition of behavioral assessments in diagnosis of disorders of consciousness. Ann Neurol 81 (6), 883–889. https://doi.org/10.1002/ana.v81.610.1002/ana.24962.