HAL Id: inserm-02078546
https://www.hal.inserm.fr/inserm-02078546
Submitted on 25 Mar 2019
HAL is a multi-disciplinary open access archive for the deposit and dissemination of sci-entific research documents, whether they are pub-lished or not. The documents may come from teaching and research institutions in France or abroad, or from public or private research centers.
L’archive ouverte pluridisciplinaire HAL, est destinée au dépôt et à la diffusion de documents scientifiques de niveau recherche, publiés ou non, émanant des établissements d’enseignement et de recherche français ou étrangers, des laboratoires publics ou privés.
Intake of meat, fish, fruits and vegetables and long-term
risk of dementia and Alzheimer’s disease
Laure Ngabirano, Cecilia Samieri, Catherine Feart, Audrey Gabelle, Sylvaine
Artero, Claire Duflos, Claudine Berr, Thibaut Mura
To cite this version:
Laure Ngabirano, Cecilia Samieri, Catherine Feart, Audrey Gabelle, Sylvaine Artero, et al.. Intake of meat, fish, fruits and vegetables and long-term risk of dementia and Alzheimer’s disease: Meat, fish, fruits, vegetables and dementia. Journal of Alzheimer’s Disease, IOS Press, 2019, 68 (2), pp.711-722. �10.3233/JAD-180919�. �inserm-02078546�
1
Intake of meat, fish, fruits and vegetables and long-term risk of dementia and
Alzheimer’s disease.
Laure NGABIRANO 1,, Cecilia SAMIERI 2, Catherine FEART 2, Audrey GABELLE 1 3,, Sylvaine ARTERO 1, Claire DUFLOS 4 , Claudine BERR 1,3*, Thibault MURA 1,4
(1) Univ. Montpellier, Inserm, Neuropsychiatry: Epidemiological and Clinical Research, UMR U1061, , F-34093 Montpellier, France
(2) Univ. Bordeaux, Inserm, Bordeaux Population Health Research Center, UMR 1219, F-33000 Bordeaux, France
(3) CMRR, Department of Neurology, Gui de Chauliac University Hospital, , F-34000 Montpellier, France
(4) Medical Information Department, University hospital of Montpellier, , F-34093 Montpellier, France.
*Corresponding author: Dr Claudine Berr, Inserm U1061 - Hôpital La Colombière, Pavillon 42 39 av. Charles Flahault - 34493 Montpellier - Cedex 5 - France
Phone: 33 499614566, Fax: 33 499614579, email: claudine.berr@inserm.fr
2 AUTHORSHIP
L. Ngabirano: formulation of the research question, statistical analysis and interpretation of the data; drafting the manuscript. ,
C. Samieri: revising the manuscript, contributes to the interpretation of data for the work. C. Feart: revising the manuscript, contributes to the interpretation of data for the work. S. Artero: revising the manuscript, contributes to the interpretation of data for the work. C. Duflos: revising the manuscript, contributes to the interpretation of data for the work. A. Gabelle: revising the manuscript, contributes to the interpretation of data for the work. C. Berr: funding, data acquisition, revising the manuscript, contributes to the interpretation of data for the work.
T. Mura: formulation of the research question, analysis and interpretation of the data, design study, study supervision; drafting/revising the manuscript.
All authors have approved final version of the manuscript and are agree to be accountable for all aspects of the work in ensuring that questions related to the accuracy or integrity of any part of the work are appropriately investigated and resolved
3 ABSTRACT (248)
Background: The links between diet and the risk of dementia have never been studied taking into account the possibility of protopathic bias (i.e., reverse causation).
Objective: We aimed to examine the relationship between consumption frequency of meat, fish, fruits and vegetables and long-term risk of dementia and Alzheimer’s disease (AD), by taking into account this possibility.
Methods: We analysed data of 5934 volunteers aged 65 and over from the Three-city study who were followed every 2 to 4 years for 12 years. Dietary habits were assessed at inclusion using a brief food frequency questionnaire. The presence of symptoms of dementia was investigated at each follow-up visit. To limit the risk of protopathic bias, a 4-year lag window between exposure and disease assessment was implemented by excluding from the analyses all dementia cases that occurred during the first four years after inclusion. Analyses were performed using a Cox proportional hazard model and were adjusted for socio-demographic, lifestyle and health factors.
Results: The average follow-up time was 9·8 years. During this period, 662 cases of dementia, including 466 of AD, were identified. After adjustment, only low meat consumption (≤
1time/week) was associated with an increased risk of dementia and AD compared with regular consumption (≥4times/week) (HR=1·58 95%CI=[1·17-2·14], HR=1·67 95%CI=[1·18-2·37],
respectively). No association was found between the consumption of fish, raw fruits, or cooked fruits and vegetables and the risk of dementia or AD.
Conclusion: These findings suggest very low meat consumption increases the long-term risk of dementia and AD, and that a protopathic bias could have impacted finding from previous studies.
4
5 INTRODUCTION
The links between eating habits and the risk of dementia or Alzheimer's disease (AD) have been the subject of much research. Special attention has been devoted to the consumption of fruits and vegetables because of their high content in antioxidant nutrients, such as vitamin C, vitamin E, flavonoids, and carotenoids [1] , and the consumption of fish because of its richness in n-3 polyunsaturated fatty acids that have anti-inflammatory properties [2] . Few studies have examined the effect of meat consumption that is generally considered to have a negative effect on health due to its high saturated fat content [3]. However, results of these studies have often been discordant. Several authors have reported an association between frequent consumption of fruits and vegetables and decreased risk of dementia [4-6], but not others [7, 8]. Similarly, several studies have found an inverse association between fish consumption and risk of dementia [9-11], but not others [4, 12-14]. Some heterogeneous results also exist regarding meat consumption [4, 15].
A potential explanation for these discrepancies is the possible existence of a protopathic bias (i.e., reverse causation). Indeed these studies evaluated the occurrence of dementia over a period ranging from 2 [4] to 10 [12, 14] years, and, to our knowledge, none used a "lag window" to limit the potential risk of protopathic bias [16, 17]. Yet, reverse causation, which happens when underlying disease causes changes in behaviours such as dietary habits, is very likely to occur when studying the risk factors for dementia or AD. Indeed, as AD pathophysiological process begins 10 to 20 years before the first clinical signs [18-20], the nutritional habits in the years preceding the diagnosis could be affected by the subclinical expression of prodromal dementia. This hypothesis was confirmed by a recent study that showed a reduction in the consumption frequency of fish, fruits and vegetables in the years preceding the diagnosis of dementia [21].
6
The aim of this work was to study the relationship between dietary habits (i.e., consumption of meat, fish, raw/cooked fruits and vegetables) and long-term risk of dementia and AD, by taking into account the possibility of a protopathic bias.
7 MATERIALS AND METHODS
Study Population
The Three-City Study (3C) [22] included a large prospective population-based cohort of 9294 people aged 65 years and over who were recruited between 1999 and 2001 from the electoral rolls of three French cities: Bordeaux (n = 2104), Dijon (n = 4931) and Montpellier (n = 2259). Participants were followed every 2 to 4 years for 12 years. At inclusion and at each follow-up visit, data were collected using a face-to-face questionnaire administered by trained nurses or psychologists.
To limit the possibility of a protopathic bias in the present analysis, only the dementia cases that occurred after the first 4 years post-inclusion (lag window) were included [17]. Accordingly, 505 cases of dementia, 1045 participants lost to follow-up and 549 individuals who died during the first 4 years of follow-up (i.e., before the second follow-up visit) were excluded, as well as 1261 people who did not attend at least one of the planned visits after the first 4 years of follow-up. In total, 5,934 participants who were alive and without dementia at the second follow-up visit were included in the analysis (study flow chart in Fig. 1).
All participants signed an informed consent form. The study protocol was approved by the
Consultative Committee for the Protection of Biomedical Research Participants of the
University Hospital of Kremlin-Bicêtre, Paris, and Sud-Mediterranée III.
Nutritional assessment
At inclusion, dietary habits were assessed using a brief food frequency questionnaire (FFQ) administered by trained investigators. The FFQ concerned five broad food categories: meat including poultry, fish including seafood, raw fruits, raw vegetables, cooked fruits and vegetables. The frequency of consumption of each food was categorised in six classes (never,
8
≤ 1 time/week, ≈ 1 time/week, 2 to 3 times/week, 4 to 6 times/week, and daily). Some of these
categories were aggregated for the analysis: three categories for raw meat and vegetables (≤ 1 time/week, 2 to 3 times/week, ≥ 4 times/week); four categories for fish (< 1 time/week, ≈ 1 time/week, 2 to 3 times/week, ≥ 4 times/week); and three for raw fruits and cooked fruits and vegetables (≤ 1 time/week, 2 to 6 times/week, ≥ 1 time/days). The food consumption
frequencies of the whole 3C cohort have been described elsewhere [23].
In subjects from the Bordeaux center, mean total energy intake per day was estimated from a 24-hour dietary recall performed during a face-to-face interview administered 2 years after baseline by trained dieticians. For subjects of the 2 other 3C centers (Dijon and Montpellier), total energy intake was imputed (using multiple imputation method) as previously described [24].
Other variables
Sociodemographic characteristics recorded at baseline included study centre, age, sex, marital status (married; divorced/single; widowed), educational level (primary; junior secondary; senior secondary; higher education), and income. Lifestyle parameters included alcohol consumption (non-drinker or ex-drinker; moderate if ≤ 36 g/d [3 glasses]; heavy > 36 g/d) [11], tobacco use (never, former, current), and physical activity ("never or almost never"; "occasionally, regularly or often") [25]. Biological and clinical data included: i) presence of the ε 4 allele of the Apolipoprotein gene (APOE-ε4: yes/no); ii) body mass index (BMI) expressed
in kg/m2; iii) hypertension, defined by systolic blood pressure ≥ 140 mmHg, or diastolic blood pressure ≥ 90 mmHg, or taking antihypertensive drugs; iv) diabetes, defined by fasting
glycaemia ≥ 7·0 mmol/l, or antidiabetic treatment; v) hypercholesterolemia, defined by plasma cholesterol ≥ 6·2 mmol/l or taking anti-cholesterol treatment; and vi) depression, defined by a
Center for Epidemiologic Studies Depression (CESD) scale score ≥ 17 in men and ≥ 23 in women [26], or antidepressant treatment.
9 Diagnosis of dementia
Diagnosis of dementia was based on a three-step protocol [22]. To assess the cognitive status at inclusion, a battery of neuropsychological tests was administered by trained psychologists. At the follow-up visits, participants whose neuropsychological performance could suggest the development of dementia were evaluated by a neurologist. All potential prevalent or incident cases of dementia were ascertained by an independent committee of expert neurologists to reach a consensus on the diagnosis and aetiology of dementia, following the criteria of the Diagnostic and Statistical Manual of Mental Disorders, fourth edition [27], and of the National Institute of Neurological and Communicative Disorders and Stroke – Alzheimer’s Disease and Related Disorders Association [28] for probable or possible AD
(mixed dementia cases were not considered as AD in our analysis). Only dementia cases diagnosed after the first 4 years of follow-up (lag window) were included in statistical analyses.
Statistical analyses
Relationships between food consumption frequencies and the participants' characteristics were analysed using the Chi2 test (qualitative variables) and the Student’s t test (quantitative variables). The incidence rates of dementia and AD were calculated with their 95 % confidence intervals (CI) for each food consumption frequency level.
Relationships between food consumption frequency and risk of dementia or AD were modelled using Cox proportional hazards models with delayed entry. The patient's age was used as reference time, and age at the 4-year follow-up visit for the left truncation [29]. For the analysis of AD risk, the other dementia types (mixed, vascular, parkinsonian, Lewy body dementia, and others) were censored at the time of diagnosis. Two models were constructed: (1) model a: adjusted for inclusion centre, sex, marital status, income, level of education, APOE-ε4, smoking, alcohol consumption, physical activity frequency, the other four food categories and energy intake, and (2) model b: model a + health factors (BMI, diabetes,
10
hypertension, hypercholesterolemia and depression) that may confound or mediate the relationship between food intakes and dementia risk. Additional analyses stratified for sex and APOE-ε4 status were performed on the basis of the previous findings about a significant interaction with APOE-ε4 status [11, 13], and because of potential differences in nutritional habits between men and women [23].
To avoid the loss of statistical power and selection bias related to missing data (1.32 % for the whole database and less than 10 % for each explanatory variable except for energy intake which were only collected in the center of Bordeaux), ten imputed datasets were created using multiple imputations method. Missing values for covariates considered in the analysis were replaced by values generated using the Fully Conditional Specification (FCS) method and the PROC MI procedure of SAS version 9.2. Each imputed dataset was analysed as if it was complete, and the hazard ratios (HRs) and their CI were compiled using the PROC MIANALYZE procedure [30].
Analyses were performed with a bilateral alpha level of 0.05 using the SAS software, version 9.2 (SAS Institute, Cary, North Carolina).
11 RESULTS
The mean age of the 5,934 participants included in the present analysis was 76·9 years ± 4·9 years at baseline. Among them, 25·0 % were enrolled in Bordeaux, 51·6 % in Dijon and 23·4 % in Montpellier. Women represented 63·4 % of all participants. The average follow-up duration after the 4-year lag window was 6·1 years (9·8 years after the FFQ), and this corresponded to a follow-up of 35 705 persons-years. During this time, 662 participants developed dementia (AD in 466 participants, 70 %), and 860 died.
Comparison of the participants’ characteristics according to their food consumption
frequencies (Tables 1 and 2) showed that low meat consumption (≤ 1 time/week) was more
frequently reported by women, participants with lower education, income, BMI, and alcohol consumption, non-married status, and with high depressive symptomatology. Similar results were obtained for low fish consumers (< 1 time/week), but for BMI that was higher in this group. Low fish consumption was also associated with current smoker status, and less frequent physical activity and hypercholesterolemia. Low consumption of raw or cooked fruits and vegetables (≤ 1 time/week) was associated with non-married status, lower education, income, physical activity frequency and alcohol consumption, as well as high depressive symptomatology. Raw vegetables were more frequently eaten by men, whereas cooked fruits and vegetables were more frequently eaten by women.
Analysis of the relationship between the consumption frequencies of the different food categories (E-tables 1 and 2) showed that overall, participants with low consumption of a food category tended to report lower consumption of another food category more frequently.
The incidence of dementia and AD increased when the frequency of meat consumption decreased (Table 3; 29·0/1000 persons-years for low meat consumers and 17·3/1000 for higher meat consumers for dementia, and 22·1/1000 persons-years versus 12·3/1000 persons-years for
12
AD). Compared with high meat consumption (≥ 4 times/week), low meat consumption (≤ 1 times/week) was significantly associated with an increased risk of dementia and AD after adjustment (model b: HR = 1·58, 95 % CI = [1·17-2·14] for dementia; HR = 1·67[1·18-2·37] for AD).
No significant association was found between the consumption frequency of fish, raw vegetables, raw fruits, and cooked fruits and vegetables and the risk of dementia or AD (Table 3).
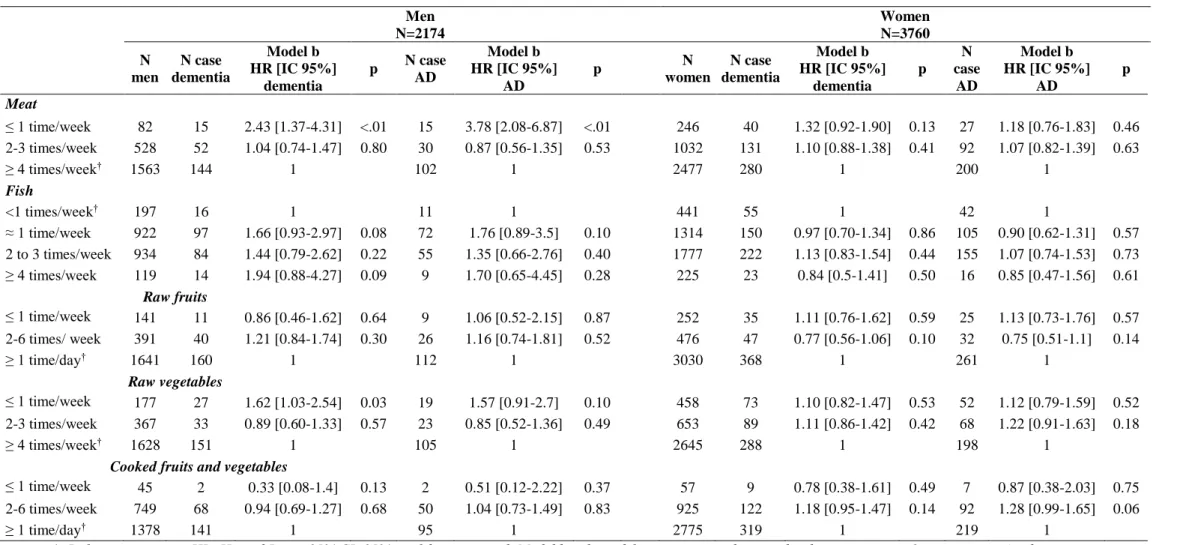
In analyses stratified according to sex and APOE-ε4 status (E-tables 3 and 4), low consumption of raw vegetables was associated with an increased risk of dementia in men (HR = 1·64 [1·05-2·26], p = 0·03), but not in women. Low meat consumption was associated with higher risk of dementia and AD in men (model b: HR = 2·44 [1·38-4·32], and HR = 3.74 [2·07-6·76], respectively) and in APOE-ε4 carriers (model b: HR = 2·02 [1·12-3·65], and HR = 2·50 [1·30-4·82], respectively).
13 DISCUSSION
In this longitudinal study of a large cohort with long follow-up and active ascertainment of dementia, we found that people with low meat consumption (≤ 1 per week) had a significantly increased risk of developing dementia or AD after a mean follow-up of 9·8 years. This increased risk was more pronounced in men and in APOE-ε4 carriers. In men, low consumption of raw vegetables also was associated with increased risk of dementia or AD. We did not find any significant association between the consumption frequency of fish, cooked fruits and vegetables or raw fruits and the risk of developing dementia or AD.
The strengths of the 3C cohort include its prospective design, long follow-up time, and large sample size that ensured a sufficient statistical power. Moreover, our analysis considered a very large number of potential confounding factors (socio-demographic, lifestyle-related, clinical and biological variables). Our analysis is also the first to have taken into account the possibility of a protopathic bias using a lag window of 4 years [16, 17]. AD pathophysiological process usually begins 10 to 20 years before the clinical signs [18]. Therefore, when assessing nutritional habits in the years preceding dementia, it is difficult to exclude the possibility that these habits are affected, or not, by the ongoing pathological process. As it is difficult to determine whether the observed eating behaviour is the cause or the consequence of the pathology, it is essential when analysing the relationship between eating habits and risk of dementia to take into account the possibility of a protopathic bias, as routinely done when studying drugs and dementia [31].
Our study has several potential limitations. First, the 3C cohort volunteers were recruited from the electoral rolls that include 80 to 90% of the French population. However, participation in the cohort was on a voluntary basis, and the people finally included in the study were generally in better health, more educated, and with higher income than the general
14
population. As these characteristics can strongly influence the eating behaviour [23], it is difficult to extrapolate the reported eating habits to the general French population. However, this should not have affected our analysis from an etiological point of view [32].
Because our study has a long follow-up and focuses on an elder population, the issue of competitive risk can be raised. Indeed, if a subject dies during follow up, it will no longer be possible for him to develop dementia. If a nutritional exposure is associated, with the risk of death, the number of dementias will be mechanically lower. In this situation, methods such as the Fine and Gray model [33] assume that those who died without developing dementia would never have developed dementia if they had lived throughout the follow up. These models should therefore be avoided in etiological studies, as they are sensitive to the variation in competitive risk rates. Conversely, the method that we used, which consist to censor competitive events in Cox model, is largely unaffected by between-group differences in hazards for competing events [34], and is therefore adapted to analyze our question.
Another issue that can be raised is that of a survival bias related to deaths and loss to follow-up during the lag-time period. This bias, when it exists, leads to the exclusion of the frailest subjects. Subjects included in analyzes are survivors less susceptible to develop diseases. In our study 862 cases of dementia were identified after the lag-time period, which corresponds to an incidence of 24/1000 person/year. These figures are consistent with previously published incidence [35], and therefore do not support the idea of a major survival bias. Moreover, supplemental analyzes have shown that subjects excluded from the analysis due to death or loss to follow-up during the lag-time period, did not differ (after adjustment) from the subjects included in the analysis for the 5 food consumption variables we studied (data not shown). Therefore, it is unlikely that a differential survival bias affected our results.
15
A frequent limitation of food surveys is the difficulty to identify the role of a specific food category because one food item is never consumed alone. As the consumption of some food types is often correlated with each other, and foods are composed of many nutrients, it is challenging to understand the specific effects of each food category. We have take into account, for each food category, the consumption of the other foods categories in multivariate analyses. It is possible, however, that residual confusion linked to particular dietary patterns, may still be present in our results.
The FFQ that we use did not collect quantitative data (portions grams), but only frequencies of consumption, thus total energy intake (EI) was not directly estimated from this questionnaire. To take into account this important parameter [36], we used total energy intake collected 2 years after baseline in the center of Bordeaux from a 24-hour dietary recall. We then used multiple imputation method to adjust our analyses for this parameter as previously described [24]. Consistently with previous publications [11], we did not find association between this factor and occurrence of dementia. Adjustment for this parameter did not change strength of associations in our analyses. It therefore seems unlikely that EI could therefore explain our results.
Our study is not the first analysis on the relationship between dietary behaviour and dementia in the 3C cohort. A previous study on the first 4 years of follow-up, without lag window [11], found that frequent fish consumption was associated with decreased risk of dementia in APOE-ε4 non-carriers and reduced risk of AD in the whole sample. Moreover, daily consumption of cooked fruits and vegetables was associated with reduced risk of dementia. The study did not find any association with meat consumption possibly because of lack of statistical power. The differences observed between these studies on the same cohort could be explained by the presence of a protopathic bias in the previous short-term analysis. For instance, preparation of fish-based dishes could require greater autonomy to buy and cook
16
fresh products, and thus fish consumption frequency might be reduced in subjects in the prodromal phase of AD, as recently shown [21]. In agreement, two long-term studies (the Rotterdam cohort: 9·6 years of follow-up and 5395 subjects at baseline; and the Framingham Heart study: 9·1 years of follow-up and 899 subjects at baseline) did not find any association with fish consumption [12, 14]. Conversely, several short- and medium-term studies (2-7 years of follow-up) reported an association between frequent fish consumption and reduced risk of dementia [4, 9, 13], sometimes specifically in APOE-ε4 non-carriers [11]. A study that analysed pooled data from five large cohorts, including the 3C cohort, identified significant trends of increasing fish intake associated with decreasing rates of cognitive decline, with a small size effect. However, as it did not exclude subjects who developed dementia at the beginning of the follow-up (as we did here), the possibility of protopathic bias cannot be ruled out[37].
The findings on the role of fruits and vegetables also are divergent. A meta-analysis on data from six large cohorts[8] suggests a protective association of regular consumption of fruits and vegetables with the risk of dementia (pooled RR: 0.74, 95% CI [0.62-0.88]). However, moreover, it considered the total consumption, and not fruits and vegetables separately. Few articles analysed fruit and vegetables separately, and mostly did not find any protective effect against the risk of dementia/AD [7, 15, 38, 39]. Other studies on cognitive decline suggested a protective association only for specific types of fruits and vegetables[7], such as green cruciferous and yellow leafy vegetables[38]. Thus, the associations could depend on the nutritional habits of the participants in terms of the type of vegetables eaten. As for fish, a previous publication [21] suggested that prodromal dementia could affect the capacity to buy fruits and vegetables, or to cook them, leading to associations that can be explained by reverse causality. Therefore, a protopathic bias could also partly explain the divergence between our findings and previous literature data.
17
Contrary to what expected, our analysis showed an increased risk of dementia in low meat consumers and not in heavy meat consumers. Few studies have focused on meat consumption. The medium-term (7 years of follow-up) analyses on the PAQUID cohort did not find any link between red meat consumption and risk of dementia after adjusting for age and sex [4]. In the Taiwan Longitudinal Study of Aging, a diet rich in meat was associated with increased risk of cognitive decline in people younger but not in those older than 75 years of age [40]. The E3N study (n = 4809 women), which distinguished between red and white meat, did not detect any association between consumption of red meat (beef, pork, lamb) or processed meat and the odds of cognitive decline, but reported that consumption of white meat (poultry) was associated with a reduction of the long-term risk (13-years follow-up) [15]. A possible pathophysiological hypothesis to explain the increased risk in non-meat consumers is the high frequency of vitamin B12 deficiency in people following with low intakes in animal products (including meat). Indeed this deficiency is associated with an increased risk of neuropsychological impairment [41]. Moreover, our study shows that in general, people with low meat consumption also eat fewer fruits and vegetables or fish. Thus, low meat consumption might reflect a general decrease in dietary intakes, or dietary changes associated with multiple deficiencies that could lead to an increased risk of dementia. However, it seems unlikely that this association is explained by a low energy intake since previous studies [42] have found that a lower intake of calories may be associated with lower risk of AD in APOE-ε4 carriers. The higher association in men could be explained by a difference in cause of low meat consumption between the two sexes, with more frequent alterations of the dietary behaviour in men.
In conclusion, our study on the long-term risk of dementia suggests that low consumption of raw vegetables in men, and very low meat consumption could be associated with an increased risk of developing dementia or AD. Conversely, when taking into account
18
the potential reverse causation, it did not find any association between consumption frequency of fish, cooked fruits and vegetables or raw fruits and the risk of developing dementia or AD.
19 FINANCIAL SUPPORT
The 3C Study is conducted under a partnership agreement between the “Institut National de la
Santé et de la Recherche Médicale” (INSERM), the “Victor Segalen – Bordeaux II University”
and the Sanofi-Synthélabo Company. The “Fondation pour la Recherche Médicale” funded the study preparation and initiation. The 3C Study is also supported by the “Caisse Nationale Maladie des Travailleurs Salariés”, “Direction Générale de la Santé”, Conseils Régionaux of Aquitaine, Languedoc-Roussillon and Bourgogne, Fondation de France, Ministry of Research-INSERM Programme ‘Cohortes et collections de données biologiques’, Mutuelle Générale de l’Education Nationale, Institut de la longévité, Conseil Général de la Côte d’Or, Agence
Nationale de la Recherche ANR COGINUT (PNRA/200206-01-01) and COGICARE(Longvie 2007LVIE-003-01) and Fonds de coopération scientifique Alzheimer (FCS 2009-2012).
The funders had no role in the design, analysis or writing of this article.
CONFLICT OF INTEREST
None for L Ngabirano C Samieri, S Artero, C. Duflos, A. Gabelle, C. Berr, and T Mura C Feart received fees for conferences from Danone Research and Nutricia.
20 BIBLIOGRAPHY
[1] Wengreen HJ, Munger RG, Corcoran CD, Zandi P, Hayden KM, Fotuhi M, Skoog I, Norton MC, Tschanz J, Breitner JC, Welsh-Bohmer KA (2007) Antioxidant intake and cognitive function of elderly men and women: the Cache County Study. J Nutr Health Aging 11, 230-237.
[2] Calder PC (2013) Omega-3 polyunsaturated fatty acids and inflammatory processes: nutrition or pharmacology? Br J Clin Pharmacol 75, 645-662.
[3] Engelhart MJ, Geerlings MI, Ruitenberg A, Van Swieten JC, Hofman A, Witteman JC, Breteler MM (2002) Diet and risk of dementia: Does fat matter?: The Rotterdam Study. Neurology 59, 1915-1921.
[4] Barberger-Gateau P, Letenneur L, Deschamps V, Peres K, Dartigues JF, Renaud S (2002) Fish, meat, and risk of dementia: cohort study. BMJ 325, 932-933.
[5] Dai Q, Borenstein AR, Wu Y, Jackson JC, Larson EB (2006) Fruit and vegetable juices and Alzheimer's disease: the Kame Project. Am J Med 119, 751-759.
[6] Hughes TF, Andel R, Small BJ, Borenstein AR, Mortimer JA, Wolk A, Johansson B, Fratiglioni L, Pedersen NL, Gatz M (2010) Midlife fruit and vegetable consumption and risk of dementia in later life in Swedish twins. Am J Geriatr Psychiatry 18, 413-420.
[7] Kang JH, Ascherio A, Grodstein F (2005) Fruit and vegetable consumption and cognitive decline in aging women. Ann Neurol 57, 713-720.
[8] Wu L, Sun D, Tan Y (2017) Intake of Fruit and Vegetables and the Incident Risk of Cognitive Disorders: A Systematic Review and Meta-Analysis of Cohort Studies. J Nutr Health Aging 21, 1284-1290.
[9] Kalmijn S, van Boxtel MP, Ocke M, Verschuren WM, Kromhout D, Launer LJ (2004) Dietary intake of fatty acids and fish in relation to cognitive performance at middle age. Neurology 62, 275-280.
[10] Morris MC, Evans DA, Bienias JL, Tangney CC, Bennett DA, Wilson RS, Aggarwal N, Schneider J (2003) Consumption of fish and n-3 fatty acids and risk of incident Alzheimer disease. Arch Neurol 60, 940-946.
[11] Barberger-Gateau P, Raffaitin C, Letenneur L, Berr C, Tzourio C, Dartigues JF, Alperovitch A (2007) Dietary patterns and risk of dementia: the Three-City cohort study. Neurology 69, 1921-1930.
[12] Schaefer EJ, Bongard V, Beiser AS, Lamon-Fava S, Robins SJ, Au R, Tucker KL, Kyle DJ, Wilson PW, Wolf PA (2006) Plasma phosphatidylcholine docosahexaenoic acid content and risk of dementia and Alzheimer disease: the Framingham Heart Study. Arch Neurol 63, 1545-1550. [13] Huang TL, Zandi PP, Tucker KL, Fitzpatrick AL, Kuller LH, Fried LP, Burke GL, Carlson MC (2005)
Benefits of fatty fish on dementia risk are stronger for those without APOE epsilon4. Neurology 65, 1409-1414.
[14] Devore EE, Grodstein F, van Rooij FJ, Hofman A, Rosner B, Stampfer MJ, Witteman JC, Breteler MM (2009) Dietary intake of fish and omega-3 fatty acids in relation to long-term dementia risk. Am J Clin Nutr 90, 170-176.
[15] Vercambre MN, Boutron-Ruault MC, Ritchie K, Clavel-Chapelon F, Berr C (2009) Long-term association of food and nutrient intakes with cognitive and functional decline: a 13-year follow-up study of elderly French women. Br J Nutr 102, 419-427.
[16] Tamim H, Monfared AA, LeLorier J (2007) Application of lag-time into exposure definitions to control for protopathic bias. Pharmacoepidemiol Drug Saf 16, 250-258.
[17] Arfe A, Corrao G (2016) The lag-time approach improved drug-outcome association estimates in presence of protopathic bias. J Clin Epidemiol 78, 101-107.
[18] Amieva H, Le Goff M, Millet X, Orgogozo JM, Peres K, Barberger-Gateau P, Jacqmin-Gadda H, Dartigues JF (2008) Prodromal Alzheimer's disease: successive emergence of the clinical symptoms. Ann Neurol 64, 492-498.
21
[19] Braak H, Thal DR, Ghebremedhin E, Del Tredici K (2011) Stages of the pathologic process in Alzheimer disease: age categories from 1 to 100 years. J Neuropathol Exp Neurol 70, 960-969. [20] Raskin J, Cummings J, Hardy J, Schuh K, Dean RA (2015) Neurobiology of Alzheimer's Disease:
Integrated Molecular, Physiological, Anatomical, Biomarker, and Cognitive Dimensions. Curr Alzheimer Res 12, 712-722.
[21] Wagner M, Dartigues JF, Samieri C, Proust-Lima C (2018) Modeling Risk-Factor Trajectories When Measurement Tools Change Sequentially During Follow-up in Cohort Studies: Application to Dietary Habits in Prodromal Dementia. Am J Epidemiol 187, 845-854.
[22] the-Three-City-Group (2003) Vascular factors and risk of dementia: design of the Three-City Study and baseline characteristics of the study population. Neuroepidemiology 22, 316-325. [23] Larrieu S, Letenneur L, Berr C, Dartigues JF, Ritchie K, Alperovitch A, Tavernier B,
Barberger-Gateau P (2004) Sociodemographic differences in dietary habits in a population-based sample of elderly subjects: the 3C study. J Nutr Health Aging 8, 497-502.
[24] Samieri C, Feart C, Proust-Lima C, Peuchant E, Tzourio C, Stapf C, Berr C, Barberger-Gateau P (2011) Olive oil consumption, plasma oleic acid, and stroke incidence: the Three-City Study. Neurology 77, 418-425.
[25] Letois F, Mura T, Scali J, Gutierrez LA, Feart C, Berr C (2016) Nutrition and mortality in the elderly over 10 years of follow-up: the Three-City study. Br J Nutr 116, 882-889.
[26] Husaini BA, Neff JA, Harrington JB, Hughes MD, Stone RH (1980) Depression in rural communities: Validating the CES-D scale. Journal of Community Psychology 8, 20-27. [27] American Psychiatrique Association (1994) Diagnostic and statistical manual of mental
disorders, 4th ed., APA Press, Washington, DC.
[28] McKhann G, Drachman D, Folstein M, Katzman R, Price D, Stadlan EM (1984) Clinical diagnosis of Alzheimer's disease: report of the NINCDS-ADRDA Work Group under the auspices of Department of Health and Human Services Task Force on Alzheimer's Disease. Neurology 34, 939-944.
[29] Lamarca R, Alonso J, Gomez G, Munoz A (1998) Left-truncated data with age as time scale: an alternative for survival analysis in the elderly population. J Gerontol A Biol Sci Med Sci 53, M337-343.
[30] Yuan Y (2011) Multiple Imputation Using SAS Software. Journal of Statistical Software 45. [31] Penninkilampi R, Eslick GD (2018) A Systematic Review and Meta-Analysis of the Risk of
Dementia Associated with Benzodiazepine Use, After Controlling for Protopathic Bias. CNS Drugs.
[32] Rothman KJ, Gallacher JE, Hatch EE (2013) Why representativeness should be avoided. Int J Epidemiol 42, 1012-1014.
[33] Fine JP, Gray RJ (1999) A Proportional Hazards Model for the Subdistribution of a Competing Risk J Am Stat Assoc 94, 496- 509.
[34] Dignam JJ, Kocherginsky MN (2008) Choice and interpretation of statistical tests used when competing risks are present. J Clin Oncol 26, 4027-4034.
[35] Fratiglioni L, Launer LJ, Andersen K, Breteler MM, Copeland JR, Dartigues JF, Lobo A,
Martinez-Lage J, Soininen H, Hofman A (2000) Incidence of dementia and major subtypes in Europe: A collaborative study of population-based cohorts. Neurologic Diseases in the Elderly Research Group. Neurology 54, S10-15.
[36] Willett WC, Howe GR, Kushi LH (1997) Adjustment for total energy intake in epidemiologic studies. Am J Clin Nutr 65, 1220S-1228S; discussion 1229S-1231S.
[37] Samieri C, Morris MC, Bennett DA, Berr C, Amouyel P, Dartigues JF, Tzourio C, Chasman DI, Grodstein F (2018) Fish Intake, Genetic Predisposition to Alzheimer Disease, and Decline in Global Cognition and Memory in 5 Cohorts of Older Persons. Am J Epidemiol 187, 933-940. [38] Morris MC, Evans DA, Tangney CC, Bienias JL, Wilson RS (2006) Associations of vegetable and
22
[39] Roberts RO, Geda YE, Cerhan JR, Knopman DS, Cha RH, Christianson TJ, Pankratz VS, Ivnik RJ, Boeve BF, O'Connor HM, Petersen RC (2010) Vegetables, unsaturated fats, moderate alcohol intake, and mild cognitive impairment. Dement Geriatr Cogn Disord 29, 413-423.
[40] Tsai HJ (2015) Dietary patterns and cognitive decline in Taiwanese aged 65 years and older. Int J Geriatr Psychiatry 30, 523-530.
[41] Werder SF (2010) Cobalamin deficiency, hyperhomocysteinemia, and dementia. Neuropsychiatr Dis Treat 6, 159-195.
[42] Luchsinger JA, Tang MX, Shea S, Mayeux R (2002) Caloric intake and the risk of Alzheimer disease. Arch Neurol 59, 1258-1263.
23
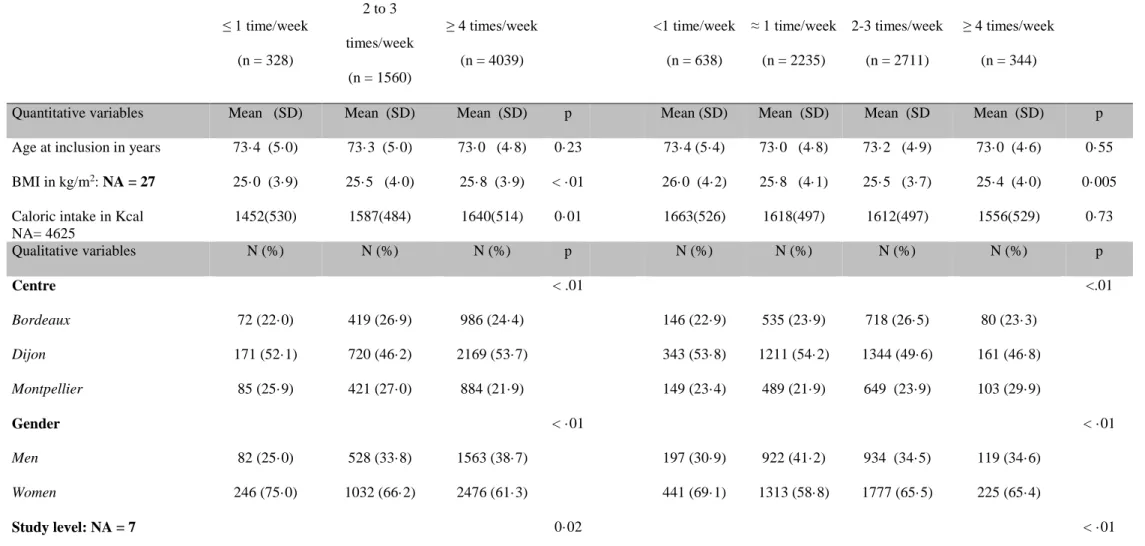
Table 1: Participants’ characteristics according to the meat or fish consumption frequency
Frequency of meat consumption Frequency of fish consumption
≤ 1 time/week (n = 328) 2 to 3 times/week (n = 1560) ≥ 4 times/week (n = 4039) <1 time/week (n = 638) ≈ 1 time/week (n = 2235) 2-3 times/week (n = 2711) ≥ 4 times/week (n = 344)
Quantitative variables Mean (SD) Mean (SD) Mean (SD) p Mean (SD) Mean (SD) Mean (SD Mean (SD) p Age at inclusion in years 73·4 (5·0) 73·3 (5·0) 73·0 (4·8) 0·23 73·4 (5·4) 73·0 (4·8) 73·2 (4·9) 73·0 (4·6) 0·55 BMI in kg/m2: NA = 27 25·0 (3·9) 25·5 (4·0) 25·8 (3·9) < ·01 26·0 (4·2) 25·8 (4·1) 25·5 (3·7) 25·4 (4·0) 0·005 Caloric intake in Kcal
NA= 4625 1452(530) 1587(484) 1640(514) 0·01 1663(526) 1618(497) 1612(497) 1556(529) 0·73 Qualitative variables N (%) N (%) N (%) p N (%) N (%) N (%) N (%) p Centre < .01 <.01 Bordeaux 72 (22·0) 419 (26·9) 986 (24·4) 146 (22·9) 535 (23·9) 718 (26·5) 80 (23·3) Dijon 171 (52·1) 720 (46·2) 2169 (53·7) 343 (53·8) 1211 (54·2) 1344 (49·6) 161 (46·8) Montpellier 85 (25·9) 421 (27·0) 884 (21·9) 149 (23·4) 489 (21·9) 649 (23·9) 103 (29·9) Gender < ·01 < ·01 Men 82 (25·0) 528 (33·8) 1563 (38·7) 197 (30·9) 922 (41·2) 934 (34·5) 119 (34·6) Women 246 (75·0) 1032 (66·2) 2476 (61·3) 441 (69·1) 1313 (58·8) 1777 (65·5) 225 (65·4) Study level: NA = 7 0·02 < ·01
24 Primary 95 (29·1) 395 (25·3) 898 (22·3) 192 (30·1) 578 (25·9) 568 (21·0) 52 (15·1) Junior secondary 109 (33·3) 537 (34·4) 1476 (36·6) 237 (37·2) 850 (38·1) 925 (34·2) 108 (31·4) Senior secondary 60 (18·3) 336 (21·6) 829 (20·5) 119 (18·7) 409 (18·3) 619 (22·9) 79 (23·0) Higher 63 (19·3) 291 (18·7) 831 (20·6) 89 (14·0) 396 (17·7) 595 (22·0) 105 (30·5) Income: NA = 334 < ·01 < ·01 < 5000 € 26 (8·3) 91 (6·2) 159 (4·2) 49 (8·0) 111 (5·3) 103 (4·0) 14 (4·4) 5000 - 10000 € 127 (40·7) 492 (33·6) 1081 (28·3) 257 (42·1) 643 (30·5) 718 (28·0) 82 (25·8) 10000 - 15000 € 77 (24·7) 4 33 (29·6) 1079 (28·2) 133 (21·8) 658 (31·2) 716 (28·0) 81 (25·5) >15000 € 82 (26·3) 448 (30·6) 1501 (39·3) 171 (28·0) 696 (33·0) 1024 (40·0) 141 (44·3) Marital status: NA = 32 < ·01 < ·01 Married 129 (39·4) 818 (52·7) 2596 (64·6) 296 (46·7) 1382 (62·2) 1694 (62·8) 171 (49·9) Divorced/Single 70 (21·4) 264 (17·0) 518 (12·9) 116 (18·3) 302 (13·6) 363 (13·5) 72 (21·0) Widowed 128 (39·1) 471 (30·3) 901 (22·4) 222 (35·0) 538 (24·2) 640 (23·7) 100 (29·2) Tobacco: NA = 1 0·36 0·02 Never 207 (63·3) 1003 (64·3) 2538 (62·8) 422 (66·1) 1380 (61·8) 1729 (63·8) 218 (63·4) Old 100 (30·6) 469 (30·1) 1305 (32·3) 170 (26·6) 738 (33·0) 857 (31·6) 109 (31·7) Current 20 (6·1) 88 (5·6) 196 (4·9) 46 (7·2) 117 (5·2) 124 (4·6) 17 (4·9) Hypertension: NA = 182 0·19 0·02 No 106 (34·1) 532 (35·2) 1282 (32·7) 223 (36·1) 681 (31·3) 889 (33·8) 126 (38·2)
25 Yes 205 (65·9) 978 (64·8) 2642 (67·3) 395 (63·9) 1491 (68·7) 1738 (66·2) 204 (61·8) Diabetes 0·25 0·36 No 301 (91·8) 1444 (92·6) 3 683 (91·2) 583 (91·4) 2035 (91·1) 2500 (92·2) 310 (90·1) Yes 27 (8·2) 116 (7·4) 356 (8·8) 55 (8·6) 200 (8·9) 211 (7·8) 34 (9·9) Hypercholesterolemia 0·33 0·01 No 154 (47·0) 686 (44·0) 1735 (43·0) 284 (44·5) 1028 (46·0) 1124 (41·5) 141 (41·0) Yes 174 (53·0) 874 (56·0) 2304 (57·0) 354 (55·5) 1207 (54·0) 1587 (58·5) 203 (59·0) APOE-ε4 carrier: NA = 270 0·57 0·30 No 252 (80·8) 1223 (81·6) 3092 (80·4) 481 (79·4) 1736 (81·6) 2075 (80·1) 277 (83·2) Yes 60 (19·2) 275 (18·4) 755 (19·6) 125 (20·6) 392 (18·4) 516 (19·9) 56 (16·8) Alcohol: NA = 91
Non- or former drinker 115 (35·5) 332 (21·7) 723 (18·2) < ·01 177 (28·1) 408 (18·6) 506 (18·9) 79 (23·3) < ·01 Drinker ≤ 36g/d 196 (60·5) 1087 (71·0) 2898 (72·8) 422 (67·1) 1577 (71·9 ) 1949 (72·8) 235 (69·3) Drinker > 36g/d 13 (4·0) 113 (7·4) 359 (9·0) 30 (4·8) 208 (9·5) 221 (8·3) 25 (7·4) Physical Activity: NA = 605 0·21 < ·01 No 181 (63·1) 876 (62·4) 2362 (65·0) 417 (74·1) 1337 (66·8) 1482 (60·7) 184 (58·4) Yes 106 (36·9) 527 (37·6) 1270 (35·0) 146 (25·9) 666 (33·2) 960 (39·3) 131 (41·6) Depression: NA = 67 < ·01 <·01 No 251 (77·2) 1285 (83·8) 3408 (85·2) 503 (79·6) 1876 (84·8) 2281 (85·1) 285 (84·3)
26
Yes 74 (22·8) 249 (16·2) 593 (14·8) 129 (20·4) 336 (15·2) 398 (14·9) 53 (15·7)
27
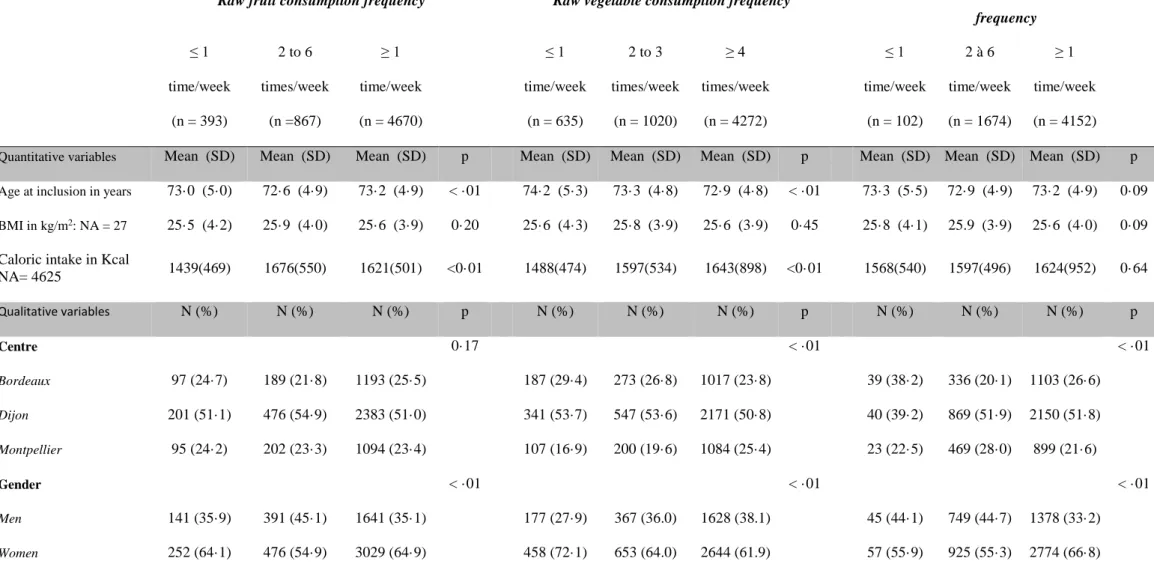
Table 2: Participants’ characteristics according to the consumption frequency of raw fruits, raw vegetables or cooked fruits and vegetables
Raw fruit consumption frequency Raw vegetable consumption frequency
Cooked fruit and vegetable consumption frequency ≤ 1 time/week (n = 393) 2 to 6 times/week (n =867) ≥ 1 time/week (n = 4670) ≤ 1 time/week (n = 635) 2 to 3 times/week (n = 1020) ≥ 4 times/week (n = 4272) ≤ 1 time/week (n = 102) 2 à 6 time/week (n = 1674) ≥ 1 time/week (n = 4152)
Quantitative variables Mean (SD) Mean (SD) Mean (SD) p Mean (SD) Mean (SD) Mean (SD) p Mean (SD) Mean (SD) Mean (SD) p
Age at inclusion in years 73·0 (5·0) 72·6 (4·9) 73·2 (4·9) < ·01 74·2 (5·3) 73·3 (4·8) 72·9 (4·8) < ·01 73·3 (5·5) 72·9 (4·9) 73·2 (4·9) 0·09
BMI in kg/m2: NA = 27 25·5 (4·2) 25·9 (4·0) 25·6 (3·9) 0·20 25·6 (4·3) 25·8 (3·9) 25·6 (3·9) 0·45 25·8 (4·1) 25.9 (3·9) 25·6 (4·0) 0·09 Caloric intake in Kcal
NA= 4625 1439(469) 1676(550) 1621(501) <0·01 1488(474) 1597(534) 1643(898) <0·01 1568(540) 1597(496) 1624(952) 0·64 Qualitative variables N (%) N (%) N (%) p N (%) N (%) N (%) p N (%) N (%) N (%) p Centre 0·17 < ·01 < ·01 Bordeaux 97 (24·7) 189 (21·8) 1193 (25·5) 187 (29·4) 273 (26·8) 1017 (23·8) 39 (38·2) 336 (20·1) 1103 (26·6) Dijon 201 (51·1) 476 (54·9) 2383 (51·0) 341 (53·7) 547 (53·6) 2171 (50·8) 40 (39·2) 869 (51·9) 2150 (51·8) Montpellier 95 (24·2) 202 (23·3) 1094 (23·4) 107 (16·9) 200 (19·6) 1084 (25·4) 23 (22·5) 469 (28·0) 899 (21·6) Gender < ·01 < ·01 < ·01 Men 141 (35·9) 391 (45·1) 1641 (35·1) 177 (27·9) 367 (36.0) 1628 (38.1) 45 (44·1) 749 (44·7) 1378 (33·2) Women 252 (64·1) 476 (54·9) 3029 (64·9) 458 (72·1) 653 (64.0) 2644 (61.9) 57 (55·9) 925 (55·3) 2774 (66·8)
28 Study level: NA = 7 0·02 < ·01 < ·01 Primary 112 (28·5) 207 (23·9) 1070 (22·9) 191 (30·1) 280 (27·5) 916 (21·5) 38 (37·3) 454 (27·2) 895 (21·6) Junior secondary 148 (37·7) 301 (35·9) 1663 (35·7) 243 (38·3) 367 (36·1) 1511 (35·4) 31 (30·4) 578 (34·6) 1513 (36·5) Senior secondary 80 (20·4) 170 (19·6) 977 (20·9) 117 (18·4) 204 (20·0) 906 (21·2) 17 (16·7) 325 (19·5) 885 (21·3) Higher 53 (13·5) 179 (20·6) 953 (20·4) 84 (13·2) 167 (16·4) 934 (21·9) 16 (15·7) 313 (18·7) 856 (20·6) Income: NA = 334 0·07 < ·01 < ·01 < 5000 € 23 (6·3) 44 (5·4) 210 (4·8) 65 (10·9) 58 (6·2) 153 (3·8) 15 (15·8) 72 (4·5) 189 (4·8) 5000-10000 € 133 (36·2) 234 (28·8) 1332 (30·2) 248 (41·4) 324 (34·4) 1127 (27·8) 35 (36·8) 491 (30·9) 1173 (30·0) 10000-15000 € 101 (27·5) 238 (29·3) 1250 (28·3) 149 (24·9) 253 (26·8) 1187 (29·3) 21 (22·1) 442 (27·8) 1125 (28·8) ≥ 15000 € 110 (30·0) 297 (36·5) 1625 (36·8) 137 (22·9) 308 (32·7) 1587 (39·1) 24 (25·3) 583 (36·7) 1425 (36·4) Marital status: NA = 32 0·55 < ·01 < ·01 Married 226 (57·8) 519 (60·3) 2799 (60·2) 259 (41·0) 549 (54·1) 2736 (64·4) 34 (33·3) 989 (59·4) 2521 (61·0) Divorced/Single 66 (16·9) 115 (13·4) 673 (14·5) 138 (21·8) 176 (17·4) 537 (12·7) 25 (24·5) 245 (14·7) 583 (14·1) Widowed 99 (25·3) 227 (26·4) 1174 (25·3) 235 (37·2) 289 (28·5) 976 (23·0) 43 (42·2) 431 (25·9) 1025 (24·8) Tobacco: NA = 1 <·01 0·23 < ·01 Never 213 (54·2) 508 (58·7) 3029 (64·9) 407 (64·1) 639 (62·7) 2701 (63·2) 57 (55·9) 981 (58·6) 2711 (65·3) Old 139 (35·4) 294 (33·9) 1442 (30·9) 185 (29·1) 326 (32·0) 1364 (31·9) 35 (34·3) 592 (35·4) 1247 (30·0) Current 41 (10·4) 64 (7·4) 199 (4·3) 43 (6·8) 54 (5·3) 207 (4·8) 10 (9·8) 101 (6·0) 193 (4·6) Hypertension: NA = 182 0·37 0·73 0·89
29 No 139 (36·7) 278 (33·5) 1504 (33·1) 203 (33·1) 321 (32·4) 1396 (33·7) 33 (34·4) 551 (34·0) 1337 (33·2) Yes 240 (63·3) 552 (66·5) 3035 (66·9) 410 (66·9) 669 (67·6) 2 746(66·3) 63 (65·6) 1069 (66·0) 2693 (66·8) Diabetes 0·31 0·29 0·61 No 368 (93·6) 793 (91·5) 4269 (91·4) 592 (93·2) 932 (91·4) 3904 (91·4) 92 (90·2) 1525 (91·1) 3811 (91·8) Yes 25 (6·4) 74 (8·5) 401 (8·6) 43 (6·8) 88 (8·6) 368 (8·6) 10 (9·8) 149 (8·9) 341 (8·2) Hypercholesterolemia 0·87 0·72 0·03 No 170 (43·3) 384 (44·3) 2024 (43·4) 278 (43·8) 454 (44·5) 1843 (43·2) 42 (41·2) 773 (46·2) 1761 (42·4) Yes 223 (56·7) 483 (55·7) 2646 (56·6) 357 (56·2) 566 (55·5) 2429 (56·8) 60 (58·8) 901 (53·8) 2391 (57·6) APOE-ε4: NA = 270 0·12 0·07 0·75 No 316 (84·3) 684 (81·7) 3571 (80·3) 508 (84·1) 783 (80·9) 3277 (80·2) 82 (83·7) 1304 (80·8) 3183 (80·6) Yes 59 (15·7) 153 (18·3) 878 (19·7) 96 (15·9) 185 (19·1) 809 (19·8) 16 (16·3) 310 (19·2) 764 (19·4) Alcohol: NA = 91
Non- or former drinker 104 (27·1) 133 (15·5) 933 (20·3) < ·01 194 (31·3) 207 (20·5) 769 (18·3) < ·01 25 (25·3) 302 (18·3) 843 (20·6) < ·01
Drinker ≤ 36g/d 237 (61·7) 622 (72·4) 3325 (72·4) 385 (62·1) 717 (70·8) 3080 (73·3) 58 (58·6) 1174 (71·1) 2951 (72·2) Drinker > 36g/d 43 (11·2) 104 (12·1) 338 (7·4) 41 (6·6) 88 (8·7) 355 (8·4) 16 (16·2) 176 (10·7) 293 (7·2) Physical Activity:NA = 605 < ·01 < ·01 0·03 No 251 (73·0) 533 (68·7) 2639 (62·8) 406 (73·8) 617 (68·6) 2397 (61·9) 64 (74·4) 988 (66·0) 2370 (63·4) Yes 93 (27·0) 243 (31·3) 1567 (37·2) 144 (26·2) 282 (31·4) 1477 (38·1) 22 (25·6) 509 (34·0) 1371 (36·6) Depression: NA = 67 0·096 < ·01 0·01
30
No 316 (81·9) 710 (82·7) 3920 (84·9) 480 (76·8) 828 (82·1) 3636 (86·0) 72 (72·0) 1376 (82·6) 3496 (85·4)
Yes 70 (18·1) 149 (17·3) 698 (15·1) 145 (23·2) 181 (17·9) 590 (14·0) 28 (28·0) 289 (17·4) 600 (14·6)
31
Table 3: Association between food consumption frequency and risk of dementia or AD
Dementia Alzheimer’s disease
N cases Incidence (95% CI) for 1000 PY Model a HR [95 % CI] p Model b HR [95 % CI] p N cases Incidence (95% CI) for 1000 PY Model a HR [95 % CI] p Model b HR [95 % CI] p Total 662 18.5 [17.1-19.9] 466 13.0 [11.8-14.2]
Meat consumption frequency
≤ 1 time/week (n = 307) 55 29·0 [21·3-36·6] 1·57 [1·16-2·13] <·01 1·57 [1·16-2·14] <·01 42 22·1 [15·4-28·8] 1·65 [1·17-2·34] 0·04 1·67 [1·18-2·37] 0·04
2-3 times/week (n = 1451) 183 19·4 [16·6-22·3] 1·07 [0·88-1·28] 0·50 1·09 [0·91-1·32] 0·35 122 12·9 [10·6-15·3] 1·01 [0·80-1·26] 0·94 1·02 [0·82-1·28] 0·83
≥ 4 times/week† (n = 3780) 424 17·3 [15·7-19·0] 1 1 302 12·3 [10·9-13·7] 1 1
Fish consumption frequency
<1 time/week† (n = 595) 71 18·7 [14·4-23·1] 1 1 53 14·0 [10·2-17·7] 1 1
32
2 to 3 times/week (n = 2548) 306 18·6 [16·5-20·7] 1·18 [0·90-1·56] 0·25 1·20 [0·91-1·58] 0·19 210 12·8 [11·0-14·5] 1·12 [0·81-1·54] 0·50 1·13 [0·82-1·55] 0·46
≥ 4 times/week (n = 320) 37 17·1 [11·6-22·6] 1·09 [0·71-1·66] 0·69 1·09 [0·72-1·67] 0·68 25 11·5 [7·0-16·1] 1·07 [0·65-1·77] 0·78 1·06 [0·65-1·75] 0·81
Raw fruit consumption frequency
≤ 1 time/week (n = 360) 46 19·3 [13·7-24·8] 1·03 [0·74 -1·41] 0·87 1·03 [0·75-1·42] 0·86 34 14·2 [9·4-19·0] 1·11 [0·77-1·60] 0·58 1·11 [0·77-1·60] 0·58 2-6 times per week (n = 821) 87 16·7 [13·1-20·2] 0·96 [0·76-1·22] 0·73 0·93 [0·73-1·18] 0·54 58 11·1 [8·2-14·0] 0·92 [0·69-1·22] 0·56 0·90 [0·67-1·20] 0·46
≥ 1 time/day† (n = 4360) 528 18·8 [17·1-20·3] 1 1 373 13·2 [11·9-14·6] 1 1
Raw vegetable consumption frequency
≤ 1 time/week (n = 583) 100 27·2 [21·9-32·6] 1·16 [0·91-1·48] 0·22 1·18 [0·92-1·51] 0·18 71 19·3 [14·8-23·8] 1·14 [0·86-1·52] 0·36 1·17 [0·88-1·56] 0·29 2-3 times/week (n = 939) 122 20·4 [16·7-24·0] 1·08 [0·88-1·33] 0·46 1·07 [0·86-1·31] 0·55 91 15·2 [12·0-18·3] 1·12 [0·88-1·43] 0·36 1·12 [0·88-1·44] 0·35
≥ 4 times/week† (n = 4017) 439 16·8 [15·2-18·4] 1 1 303 11·6 [10·3-12·9] 1 1
Cooked fruit and vegetable consumption frequency
≤ 1 time/week (n = 96) 11 18·6 [7·6-29·6] 0·74 [0·39-1·40] 0·35 0·68 [0·36-1·29] 0·24 9 15·2 [5·2-25·2] 0·84 [0·41-1·73] 0·63 0·79 [0·39-1·63] 0·52 2-6 times/week (n = 1566) 190 19·1 [16·4-21·8] 1·09 [0·91-1·30] 0·34 1·08 [0·90-1·29] 0·42 142 14·3 [11·9-16·6] 1·18 [0.96-1·45] 0·12 1·17 [0·95-1·44] 0·14
33
≥ 1 time/day† (n = 3877) 460 18·2 [16·6-19·9] 1 1 314 12·4 [11·1-13·8] 1 1
Caloric intake
For an increase of 100Kcal 1.00 [0.97 1.03] 0·83 1.00 [0.97 1.03] 0·98 1.00 [0.97 1.03] 0·92 1.00 [0.97 1.03] 0·95
†: Reference category, PY: persons-years HR: Hazard Ratio, 95% CI: 95% confidence interval,
Model a: adjusted for inclusion centre, sex, education level, income, marital status, APOE-ε4, tobacco, alcohol and physical activity, four other food categories and caloric intake Model b: Model a + health factor: BMI, diabetes, HBP, hypercholesterolemia and depression.
34 Figure 1: Study flow chart.
9294 volunteers include in the 3C study
505 cases of dementia, 549 died and 1045 lost of follow-up before second follow-up visit (i.e., 4 years after inclusion).
1261 volunteers without at least one follow-up visit after second follow-up visit (i.e., 4 years after inclusion).
5934 volunteers analysed 7195 alive and non-demented at
second follow-up visit (i.e., 4 years after inclusion).
35 SUPPLEMENTARY MATERIAL
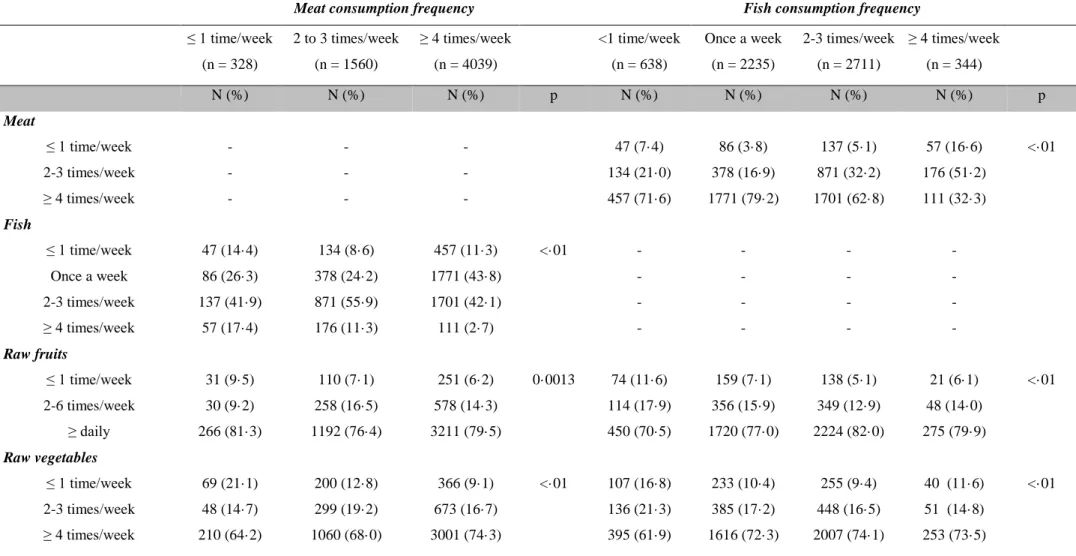
Table E-1:Relationship between the consumption frequencies of the different food categories
Meat consumption frequency Fish consumption frequency
≤ 1 time/week (n = 328) 2 to 3 times/week (n = 1560) ≥ 4 times/week (n = 4039) <1 time/week (n = 638) Once a week (n = 2235) 2-3 times/week (n = 2711) ≥ 4 times/week (n = 344) N (%) N (%) N (%) p N (%) N (%) N (%) N (%) p Meat ≤ 1 time/week - - - 47 (7·4) 86 (3·8) 137 (5·1) 57 (16·6) <·01 2-3 times/week - - - 134 (21·0) 378 (16·9) 871 (32·2) 176 (51·2) ≥ 4 times/week - - - 457 (71·6) 1771 (79·2) 1701 (62·8) 111 (32·3) Fish ≤ 1 time/week 47 (14·4) 134 (8·6) 457 (11·3) <·01 - - - - Once a week 86 (26·3) 378 (24·2) 1771 (43·8) - - - - 2-3 times/week 137 (41·9) 871 (55·9) 1701 (42·1) - - - - ≥ 4 times/week 57 (17·4) 176 (11·3) 111 (2·7) - - - - Raw fruits ≤ 1 time/week 31 (9·5) 110 (7·1) 251 (6·2) 0·0013 74 (11·6) 159 (7·1) 138 (5·1) 21 (6·1) <·01 2-6 times/week 30 (9·2) 258 (16·5) 578 (14·3) 114 (17·9) 356 (15·9) 349 (12·9) 48 (14·0) ≥ daily 266 (81·3) 1192 (76·4) 3211 (79·5) 450 (70·5) 1720 (77·0) 2224 (82·0) 275 (79·9) Raw vegetables ≤ 1 time/week 69 (21·1) 200 (12·8) 366 (9·1) <·01 107 (16·8) 233 (10·4) 255 (9·4) 40 (11·6) <·01 2-3 times/week 48 (14·7) 299 (19·2) 673 (16·7) 136 (21·3) 385 (17·2) 448 (16·5) 51 (14·8) ≥ 4 times/week 210 (64·2) 1060 (68·0) 3001 (74·3) 395 (61·9) 1616 (72·3) 2007 (74·1) 253 (73·5)
36
≤ 1 time/week 22 (6·7) 40 (2·6) 40 (1·0) <·01 28 (4·4) 44 (2·0) 25 (0·9) 5 (1·5) <·01 2-6 times/week 88 (26·9) 481 (30·9) 1104 (27·3) 187 (29·4) 680 (30·4) 744 (27·4) 63 (18·3)
37
Table E-2:Relationship between the consumption frequencies of the different food categories
Frequency of raw fruit consumption Frequency of raw vegetable consumption Frequency of cooked fruit and vegetable consumption
≤ 1 time/week (n = 393) 2 à 6 time/week (n =867) ≥ 1 time/week (n = 4670) ≤ 1 time/week (n = 635) 2 à 3 time/week (n = 1020) ≥ 4 time/week (n = 4272) ≤ 1 time/week (n = 102) 2 à 6 time/week (n = 1674) ≥ 1 time/week (n = 4152) N (%) N (%) N (%) p N (%) N (%) N (%) p N (%) N (%) N (%) p Meat ≤ 1 time/week 31 (7·9) 30 (3·5) 266 (5·7) <·01 69 (10·9) 48 (4·7) 210 (4·9) <·01 22 (21·6) 88 (5·3) 217 (5·2) <·01 2-3 times/week 110 (28·1) 258 (29·8) 1192 (25·5) 200 (31·5) 299 (29·3) 1060 (24·8) 40 (39·2) 481 (28·8) 1038 (25·0) ≥ 4 times/week 251 (64·0) 578 (66·7) 3211 (68·8) 366 (57·6) 673 (66·0) 3001 (70·3) 40 (39·2) 1104 (66·0) 2895 (69·8) Fish ≤ 1 time/week 74 (18·9) 114 (13·1) 450 (9·6) <·01 107 (16·9) 136 (13·3) 395 (9·2) <·01 28 (27·5) 187 (11·2) 422 (10·2) <·01 Once a week 159 (40·6) 356 (41·1) 1720 (36·8) 233 (36·7) 385 (37·7) 1616 (37·8) 44 (43·1) 680 (40·6) 1510 (36·4) 2-3 times/week 138 (35·2) 349 (40·3) 2224 (47·6) 255 (40·2) 448 (43·9) 2007 (47·0) 25 (24·5) 744 (44·4) 1942 (46·8) <·01 ≥ 4 times/week 21 (5·4) 48 (5·5) 275 (5·9) 40 (6·3) 51 (5·0) 253 (5·9) 5 (4·9) 63 (3·8) 276 (6·7) Raw fruits ≤ 1 time/week - - - 144 (22·7) 75 (7·4) 174 (4·1) <·01 26 (25·5) 108 (6·5) 259 (6·2) <·01 2-6 times/week - - - 125 (19·7) 222 (21·8) 519 (12·1) 18 (17·6) 321 (19·2) 527 (12·7) ≥ daily - - - 366 (57·6) 723 (70·9) 3580 (83·8) 58 (56·9) 1245 (74·4) 3367 (81·1) Raw vegetable ≤ 1 time/week 144 (36·6) 125 (14·4) 366 (7·8) <·01 - - - 52 (51·0) 175 (10·5) 408 (9·8) <·01 2-3 times/week 75 (19·1) 222 (25·6) 723 (15·5) - - - 12 (11·8) 377 (22·5) 631 (15·2) ≥ 4 times/week 174 (44·3) 519 (59·9) 3580 (76·7) - - - 38 (37·3) 1121 (67·0) 3112 (75·0)
Cooked fruits or vegetables
≤ 1 time/week 26 (6·6) 18 (2·1) 58 (1·2) <·01 52 (8·2) 12 (1·2) 38 (0·9) <·01 - - - 2-6 times/week 108 (27·5) 321 (37·1) 1245 (26·7) 175 (27·6) 377 (37·0) 1121 (26·2) - - - ≥ daily 259 (65·9) 527 (60·9) 3367 (72·1) 408 (64·3) 631 (61·9) 3112 (72·9) - - -
38
Tableau E-3: Association between food consumption frequency and risk of dementia or AD by gender Men N=2174 Women N=3760 N men N case dementia Model b HR [IC 95%] dementia p N case AD Model b HR [IC 95%] AD p N women N case dementia Model b HR [IC 95%] dementia p N case AD Model b HR [IC 95%] AD p Meat ≤ 1 time/week 82 15 2.43 [1.37-4.31] <.01 15 3.78 [2.08-6.87] <.01 246 40 1.32 [0.92-1.90] 0.13 27 1.18 [0.76-1.83] 0.46 2-3 times/week 528 52 1.04 [0.74-1.47] 0.80 30 0.87 [0.56-1.35] 0.53 1032 131 1.10 [0.88-1.38] 0.41 92 1.07 [0.82-1.39] 0.63 ≥ 4 times/week† 1563 144 1 102 1 2477 280 1 200 1 Fish <1 times/week† 197 16 1 11 1 441 55 1 42 1 ≈ 1 time/week 922 97 1.66 [0.93-2.97] 0.08 72 1.76 [0.89-3.5] 0.10 1314 150 0.97 [0.70-1.34] 0.86 105 0.90 [0.62-1.31] 0.57 2 to 3 times/week 934 84 1.44 [0.79-2.62] 0.22 55 1.35 [0.66-2.76] 0.40 1777 222 1.13 [0.83-1.54] 0.44 155 1.07 [0.74-1.53] 0.73 ≥ 4 times/week 119 14 1.94 [0.88-4.27] 0.09 9 1.70 [0.65-4.45] 0.28 225 23 0.84 [0.5-1.41] 0.50 16 0.85 [0.47-1.56] 0.61 Raw fruits ≤ 1 time/week 141 11 0.86 [0.46-1.62] 0.64 9 1.06 [0.52-2.15] 0.87 252 35 1.11 [0.76-1.62] 0.59 25 1.13 [0.73-1.76] 0.57 2-6 times/ week 391 40 1.21 [0.84-1.74] 0.30 26 1.16 [0.74-1.81] 0.52 476 47 0.77 [0.56-1.06] 0.10 32 0.75 [0.51-1.1] 0.14 ≥ 1 time/day† 1641 160 1 112 1 3030 368 1 261 1 Raw vegetables ≤ 1 time/week 177 27 1.62 [1.03-2.54] 0.03 19 1.57 [0.91-2.7] 0.10 458 73 1.10 [0.82-1.47] 0.53 52 1.12 [0.79-1.59] 0.52 2-3 times/week 367 33 0.89 [0.60-1.33] 0.57 23 0.85 [0.52-1.36] 0.49 653 89 1.11 [0.86-1.42] 0.42 68 1.22 [0.91-1.63] 0.18 ≥ 4 times/week† 1628 151 1 105 1 2645 288 1 198 1
Cooked fruits and vegetables
≤ 1 time/week 45 2 0.33 [0.08-1.4] 0.13 2 0.51 [0.12-2.22] 0.37 57 9 0.78 [0.38-1.61] 0.49 7 0.87 [0.38-2.03] 0.75 2-6 times/week 749 68 0.94 [0.69-1.27] 0.68 50 1.04 [0.73-1.49] 0.83 925 122 1.18 [0.95-1.47] 0.14 92 1.28 [0.99-1.65] 0.06
≥ 1 time/day† 1378 141 1 95 1 2775 319 1 219 1
†: Reference category· HR: Hazard Ratio· 95% CI: 95% confidence interval· Model b: adjusted for center· sex· education level· income· marital status· apoe-ε4· tobacco· alcohol and physical activity, the four other food, caloric intake · body mass index· diabetes· hypertension· hypercholesterolemia and depression·
39
Tableau E-4: Association between food consumption frequency and risk of dementia or AD by apoe-ε4 status
apoe-ε4 carriers (n=1090)
apoe-ε4 non carriers (n=4574) N N case dementia Model b HR [IC 95%] dementia p N case AD Model b HR [IC 95%] AD p N N case dementia Model b HR [IC 95%] dementia p N case AD Model b HR [IC 95%] AD p Meat ≤ 1 time/week (n = 307) 60 17 1.96 [1.05-3.68] 0.03 14 2.46 [1.26-4.82] <.01 252 33 1.45 [1.00-2.09] 0.05 25 1.43 [0.93-2.22] 0.10 2-3 times/week (n = 1451) 275 46 1.19 [0.80-1.77] 0.40 30 1.09 [0.67-1.76] 0.73 1223 124 1.08 [0.87-1.35] 0.46 82 1.03 [0.80-1.35] 0.79 ≥ 4 times/week† (n = 3780) 755 95 1 71 1 3093 288 1 200 1 Fish <1 times/week† (n = 595) 125 17 1 13 1 481 45 1 33 1 ≈ 1 time/week (n = 2075) 392 56 1.36 [0.73-2.55] 0.33 45 1.26 [0.62-2.57] 0.52 1737 171 1.13 [0.81-1.56] 0.47 117 1.08 [0.74-1.58] 0.68 2 to 3 times/week (n = 2548) 516 71 1.36 [0.73-2.53] 0.32 49 1.12 [0.56-2.26] 0.74 2075 207 1.21 [0.88-1.68] 0.23 139 1.20 [0.82-1.74] 0.35 ≥ 4 times/week (n = 320) 56 13 1.81 [0.77-4.26] 0.17 7 1.20 [0.43-3.34] 0.72 277 22 0.94 [0.56-1.58] 0.81 18 1.07 [0.59-1.93] 0.83 Raw fruits ≤ 1 time/week (n = 360) 59 9 1.06 [0.51-2.21] 0.86 8 1.48 [0.68-3.23] 0.32 316 30 0.99 [0.68-1.45] 0.97 20 1.01 [0.65-1.57] 0.97 2-6 times per week (n = 821) 153 11 0.46 [0.23-0.89] 0.02 5 0.32 [0.13-0.79] 0.01 684 73 1.11 [0.85-1.44] 0.43 51 1.11 [0.81-1.52] 0.50 ≥ 1 time/day† (n = 4360) 878 138 1 102 1 3572 342 1 236 1 Raw vegetables ≤ 1 time/week (n = 583) 96 18 1.29 [0.72-2.31] 0.38 11 1.04 [0.52-2.09] 0.91 508 74 1.17 [0.89-1.53] 0.27 52 1.21 [0.88-1.68] 0.24 2-3 times/week (n = 939) 185 32 1.22 [0.79-1.90] 0.36 22 1.01 [0.59-1.73] 0.98 783 76 1.01 [0.79-1.29] 0.93 58 1.15 [0.86-1.54] 0.33 ≥ 4 times/week† (n = 4017) 809 108 1 82 1 3278 295 1 197 1
Cooked fruits and vegetabless
≤ 1 time/week (n = 96) 16 1 0.36 [0.05-2.88] 0.33 1 0.46 [0.06-3.82] 0.47 82 10 0.76 [0.39-1.52] 0.44 8 0.85 [0.39-1.86] 0.68 2-6 times/week (n = 1566) 310 51 1.20 [0.80-1.79] 0.37 41 1.47 [0.94-2.29] 0.08 1304 124 1.00 [0.81-1.24] 0.97 87 1.07 [0.83-1.38] 0.57 ≥ 1 time/day† (n = 3877)
764 106 1 73 1 3184 311 1 212 1
†: Reference category· HR: Hazard Ratio· 95% CI: 95% confidence interval· Model b: adjusted for center· sex· education level· income· marital status· apoe-ε4· tobacco· alcohol and physical activity·the four other foods· caloric intake· body mass index· diabetes· hypertension· hypercholesterolemia and depression