HAL Id: hal-02119578
https://hal.archives-ouvertes.fr/hal-02119578
Submitted on 5 Jun 2020
HAL is a multi-disciplinary open access
archive for the deposit and dissemination of
sci-entific research documents, whether they are
pub-lished or not. The documents may come from
teaching and research institutions in France or
abroad, or from public or private research centers.
L’archive ouverte pluridisciplinaire HAL, est
destinée au dépôt et à la diffusion de documents
scientifiques de niveau recherche, publiés ou non,
émanant des établissements d’enseignement et de
recherche français ou étrangers, des laboratoires
publics ou privés.
Food policies and climate: a literature review
Lucile Rogissart, Claudine Foucherot, Valentin Bellassen
To cite this version:
Lucile Rogissart, Claudine Foucherot, Valentin Bellassen. Food policies and climate: a literature
review. [Research Report] Inconnu. 2019, pp.26. �hal-02119578�
Food policies and climate:
a literature review
February 2019
KEY MESSAGES
About one third of global greenhouse gas (GHG) emissions are generated by food consumption.
Among the levers to reduce these emissions
• Reducing the consumption of animal products has a considerable potential, as livestock accounts for two-thirds of total food emissions.
• Halving the food waste of consumers would reduce emissions by about 5%.
• Consuming more unprocessed, unpackaged, seasonal and less products imported by air would reduce emissions but with a likely lower magnitude.
• The consumption of local and organic products is not necessarily beneficial in terms of emissions, even if they can have social, environmental or health positive impacts.
Reducing GHG emissions is synergetic with other food policy priorities
• Climate and health: these are two issues that are globally compatible, in particular through reducing total quantities and reducing the quantities of animal products (especially ruminant meat) among populations unaffected by undernutrition.
• Climate and food budget: a less carbon intensive diet is not necessarily more expensive or more widely adopted by the wealthiest households.
• Climate and other environmental issues: a high consumption of animal products is problematic for climate and for most environmental issues (soil, water pollution, etc.). The conclusions are more nuanced for other types of products.
How to orient consumers towards less intense GHG behaviors?
• Many consumers still have a distorted perception of which practices have the highest mitigation potential, and are reluctant to change their behavior for climate mitigation purposes. Yet, eating behaviors seem to change quickly.
• Informative measures implemented such as carbon labels on products, information campaigns or nutritional recommendations are characterized by a lack of hindsight which makes their effectiveness difficult to evaluate. They would individually have a relatively limited effect, but could be more interesting once combined.
• The taxation of high GHG food products is a potentially effective option, but could be accompanied by perverse health or social justice effects.
SOMMAIRE
1. ABOUT ONE-THIRD OF GLOBAL GHG EMISSIONS COME
FROM FOOD CONSUMPTION 2
2. WHICH DIETARY PRACTICES HAVE THE GREATEST
POTENTIAL TO REDUCE GHG EMISSIONS? 3
1. A considerable potential through reducing animal products 3 2. Reducing consumer food waste: a significant
potential 3 3. Organic products, a positive local impact
but potential perverse effects on a larger scale 4 4. Processing, packaging, origin and seasonality:
lower potentials from a climate point of view 5
3. EMISSIONS REDUCTION & OTHER FOOD POLICY
PRIORITIES ARE MOSTLY COMPATIBLE 6
1. Climate and other environmental goals 6 2. Climate, health and accessibility 6
4. WHAT ARE THE MOST EFFECTIVE MEASURES TO ORIENT CONSUMERS TOWARDS LOW-CARBON DIETS? 8
1. Informational measures 8 2. Regulatory policies 10
5. ARE CONSUMERS READY TO ADOPT
A SUSTAINABLE DIET? 12
CONCLUSION 14 REFERENCES 15 ANNEXE 18
World food consumption accounts for about one-third of global greenhouse gas (GHG) emissions. Research and public policies have so far mainly focused on modifying agricultural and food production processes to reduce these GHG emissions. In November 2017, COP23 saw the culmination of six years of debate with the creation of a working group exclusively dedicated to agricultural issues: the Koronivia Joint Work on Agriculture (KJWA). Most of the topics covered by this working group are agricultural production, not food demand.
Yet, changing food consumption represents a significant climate change mitigation potential. In its special 1.5°C report published in 2018, the Intergovernmental Panel on Climate Change (IPCC) highlighted the large pool of GHG emission reducing food waste and changing diets represents. However, the authors identify important barriers to achieving both of these goals.
We distinguish three major obstacles to the development of measures aimed at changing consumer behavior towards less GHG intensive diets:
• The absence of a harmonized accounting method for food consumption emissions. As a result, there is uncertainty and even confusion as to the main food-related GHG emissions sources and their ranking.
• Food policies target a multitude of different objectives: health, access to food or other environmental issues usually guide the design of food policies. If it is not a question of replacing these stakes, it would be desirable to add climate among these objectives.
• The lack of perspective and experience with public policies aimed at behavioral changes. Policies to reduce obesity could serve as an example but have not always been effective until then (Gearhardt et al. 2012).
The present literature review is a contribution to overcoming these obstacles. We first recall the key figures identified in Estimating greenhouse gas emissions from food consumption: methods and results and attempt to rank levers according to their mitigation potential. The tensions and compatibilities between climate and other food policy objectives are then studied systematically. Finally, we analyze the effectiveness of the different measures that can be implemented to orient consumers towards less GHG intensive food habits.
1. About one-third of global GHG emissions
come from food consumption
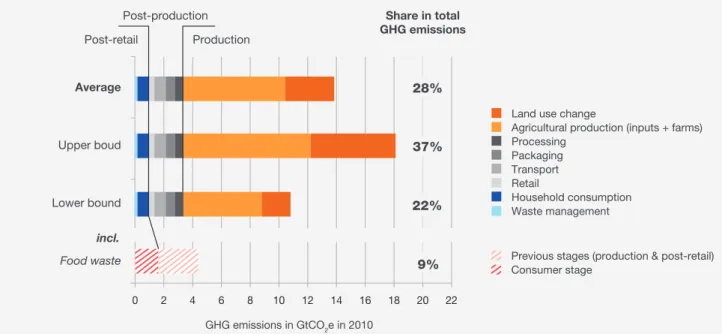
World food-related emissions is in the order of 10.8 GtCO2e to 18.1 GtCO2e, i.e. 22% to 37% of global anthropogenic emissions (Figure 1) (cf. Estimating greenhouse gas emissions from food consumption: methods and results for more details). Most of the emissions come from the production phase (land-use change and agricultural production), while the emissions generated by the post-production and post-sale stages are relatively small with 2.4 GtCO2e and 1 GtCO2e. Furthermore, if waste management is the smallest emission source, emissions embedded in food wasted at the consumption phase are not negligible with 1.6 GtCO2e. [See Estimating greenhouse gas emissions from food consumption: methods and results for European and French estimates.]
The GHG footprint of food consumption is also likely to increase significantly in the future. Given the changing demographics and dietary patterns around the world, food-related GHG emissions may almost triple (+187%) by 2050 (Springmann et al. 2018).
Although the number of undernourished people in the world has been increasing since 2015 (820 million in 2017) (FAO 2018), changes in dietary practices are required from populations with access to sufficient of food to reduce the GHG footprint of global food consumption.
FIGURE 1. WORLD FOOD GREENHOUSE GAS EMISSIONS
Land use change
Agricultural production (inputs + farms) Processing Packaging Transport Retail Household consumption Waste management
Previous stages (production & post-retail) Consumer stage
Average
Upper boud
Lower bound
Post-retail Production
Post-production Share in total
GHG emissions
GHG emissions in GtCO2e in 2010
Sources: I4CE using (Vermeulen, Campbell, and Ingram 2012a; Poore and Nemecek 2018a; FAO, s. d.; Food Wastage Footprint Full-Cost Accounting: Final Report 2014) 28% 37% 22% 9% 0 2 4 6 8 10 12 14 16 18 20 22 Food waste incl.
Note: There is no uncertainty estimate for post-production, post-sale and food waste figures, because there is only one reliable estimate
for each emission source.
2. W H ic H diet A r y pr A ctices HA ve t H e G re A tes t po tenti A l t o reduce GHG emissions
2. Which dietary practices have the greatest
potential to reduce GHG emissions?
1. A considerable potential
through reducing animal
products
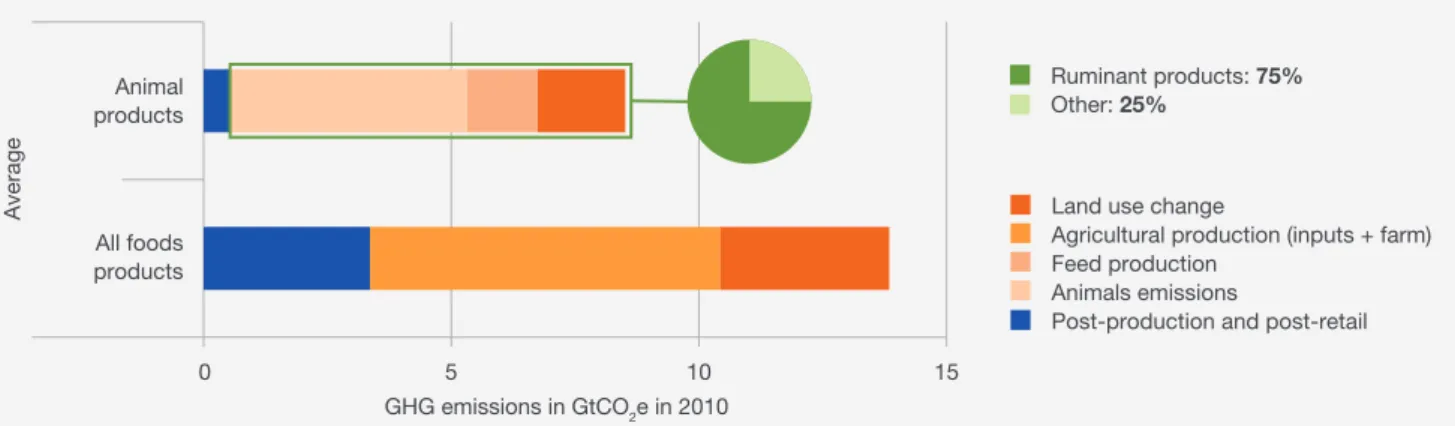
About two thirds (62-64%) of food-related emissions come from terrestrial animal products with between 6.7 GtCO2e and 11.5 GtCO2e in 2010 (cf. Estimating greenhouse gas emissions from food consumption: methods and results for further details). For comparison, terrestrial animal based products provide respectively 16% and 33% of calories and proteins available to human consumption worldwide.
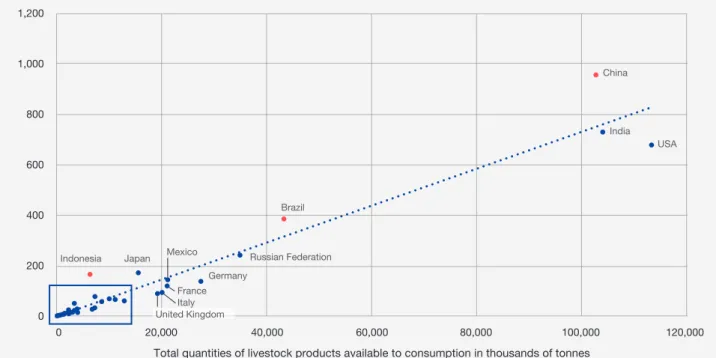
More than half of livestock emissions are directly generated by the animals (enteric fermentation and manure management), while the remainder comes from changes in land-use and animal feed production (Figure 2). It should be noted however that the emissions avoided by using animal manure as a fertilizer instead of synthetic nitrogen fertilizer are accounted in plant-based products GHG footprints. Moreover, three-quarters of these emissions are generated by ruminants i.e. cattle, sheep and goats, which emit a lot via their enteric fermentation (Gerber et al. 2013). It is therefore not surprising to observe a strong correlation (97%) between GHG emissions in food consumption and the share of animal products in food consumption (see Annex Figure 5).
The share of animal products in the emissions of the diet is very likely to increase even more. The consumption of meat has already almost doubled in the world in fifty years (1961-2011), from 23 kgcwe 1 at 42 kgcwe per person per
1 Kilograms of carcass weight equivalent.
year on average. This increase is mainly driven by developing countries, where some form of catch-up is ongoing. With the improvement of the living standards, we observe an increase in total quantity of food available for consumption and a gradual substitution of basic products (tubers, cereals) by more expensive products (animal products, processed products, etc.) (Claquin et al. 2017). However, the most developed countries still have the highest consumption of animal products with more than 300 kg/year (meat, dairy and eggs) compared to less than 70 kg/year in sub-Saharan Africa and South and South-East Asia (see Annex Figure 6).
2. reducing consumer food
waste: a significant potential
In general, accounting for emissions generated by food waste can consist in counting either:• The total emissions generated along the cycle of the wasted product (production, processing, distribution, etc.): the quantities of food waste are multiplied by emission factors corresponding to the GHG footprint of the product until the time it was discarded. Thus, for a same quantity of food waste, the products thrown at the consumption stage are always more important than at the previous stages because the footprints add up along the cycle;
• or The emissions from processing the wasted food products: both the organic (food waste and losses) 2 and inorganic (related to packaging) materials. The quantities of food waste are multiplied by the emission factor of the waste treatment employed (composting, recycling,
2 Food losses are unintended whereas food waste could be avoided. Both food loss and waste only cover products that could have been suitable to human consumption.
FIGURE 2. GREENHOUSE GASES EMISSIONS FROM ALL FOOD PRODUCTS VS. ANIMAL FOOD PRODUCTS
Land use change
Agricultural production (inputs + farm) Feed production
Animals emissions
Post-production and post-retail Ruminant products: 75% Other: 25% Animal products All foods products Average GHG emissions in GtCO2e in 2010
Source: (Gerber et al. 2013; Dhoubhadel, Taheripour, and Stockton 2016; Poore and Nemecek 2018; FAOSTAT 2018)
0 5 10 15
2. Which dietary practices have the greatest potential to reduce GHG emissions?
2. WHicH dietAry prActices HAve tHe GreAtest potentiAl to reduce GHG emissions?
2. WHicH dietAry prActices HAve tHe GreAtest potentiAl to reduce GHG emissions
incineration, etc.). The emission factors can be negative when the avoided emissions from waste treatment (via energy production for example) are greater than the ones generated.
With the first approach, overall food waste corresponds to throwing the equivalent of 4.4 GtCO2e 3, i.e. 24% to 37% of the global food footprint (FAO, s. d.). Nearly 70% of emissions come from the waste of plant-based products, while these represent 86% of the total mass of waste. Conversely, the waste of animal-based products generate 34% of total waste emissions, while they make up less than 15% of total weight. Besides, 35% of the food waste footprint takes place at the consumer stage (see Appendix Figure 7). North America and Oceania, North Asia and Europe are the three areas where the food waste footprint is the largest (FAO, s. d., 2013). In France, the total weight of food waste is estimated to be 10 Mt/year, which represents 15.3 MtCO2e/year of associated emissions (8% of total food related emissions in France). Most of the associated emissions occur at the consumption phase with 44% of the total (Income consulting and AK2C 2016). This result is however to be considered with caution because it includes waste from human food supply chains which are recycled into animal feed (20% at farm level and 50% at processing level). In optimistic scenarios, the reduction of food waste would represents about 5-6% reduction of the French food footprint (Solagro 2016; ADEME 2013).
With the second approach, world waste management would not represent more than 1% (0.2 GtCO2e) global emissions related to food (Vermeulen, Campbell, and Ingram 2012b). In France, according to the waste treatment emission factor data from ADEME (2016) and the data on food packaging volumes from ADEME, Adelphe, and Eco emballages (2016), the emissions generated by the treatment are estimated food packaging at 0.6 to 0.9 MtCO2e (with and without including the emissions avoided by energy recovery from waste). Moreover, based on ADEME (2016a), key figures on waste and the emission factors associated with each type of treatment, emissions from the management of organic food waste are estimated between 2.6 and 3 MtCO2e per year in France.
3 This figure covers emissions from land use change.
3. organic products, a positive
local impact but potential
perverse effects on a larger
scale
Organic food purchases around the world have increased from less than 20 USD billion in 1999 to 72 USD billion in 2013. The share of agricultural land intended for organic production is the highest in Oceania (17.3%), Europe (11.6%) and South America (6.8%), while North America and Europe concentrate 90% of purchases (Claquin et al. 2017).
Globally, yield differences have been observed between organic and conventional farming – the average yield difference varies between -8% to -25% according to the modes and types of production (Reganold and Wachter 2016; de Ponti, Rijk, and van Ittersum 2012). These results are however differentiated by region and type of production. For example, compared to conventional farming, organic farming may have slightly higher yields in developing countries and lower ones in developed countries. The difference with conventional agriculture is also very limited for rice, soybean and maize but larger for other types of production (Badgley
et al. 2007). In addition, organic production would also be
more resilient to extreme weather events such as droughts (Reganold and Wachter 2016).
When yields are actually lower, the question turns into whether additional land requirements are offset by reducing emissions from chemical fertilizers and pesticides or other mechanisms.
When the impact of organic farming is expressed in tCO2e per hectare, this mode of production is undeniably less intense in emissions. Contradictory results were obtained in tCO2e per unit of product. Mondelaers, Aertsens, and Van Huylenbroeck (2009) obtains that organic farming was more GHG intensive per unit of product, while Clark and Tilman (2017) finds both processes to emit similar amounts of GHG. Finally, Meier et al. (2015) is in favor of organic farming even per unit of product, but emphasizes on the difficulties of current LCAs to capture the differences between organic and conventional agriculture. It is possible that the relative merit of organic farming depends on the type of production considered, but here again, the different studies are not univocal (Tuomisto et al. 2012; FAO 2011; Meier et al. 2015). In France, at the individual level, the consumption of organic products is strongly correlated with the adoption of a less intense GHG regime, which would be likely to offset potentially negative effects on a larger scale (Boizot-Szantai, Hamza, and Soler 2017).
2. W H ic H diet A r y pr A ctices HA ve t H e G re A tes t po tenti A l t o reduce GHG emissions
2. WHicH dietAry prActices HAve tHe GreAtest potentiAl to reduce GHG emissions
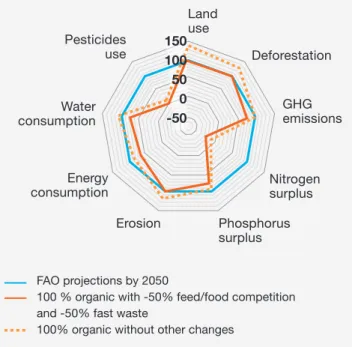
The climate change mitigation potential of organic agriculture has also been studied by combining it with other changes in practice. According to a study at global scale, it is for example possible to convert all arable lands to organic farming while reducing GHG emissions (in the range of -30%) while ensuring food security with the simultaneous reduction of both food waste and feed/food competition 4 (Muller et al. 2017) (Figure 3). This result implies significant behavioral changes, especially from consumers who would be required to substitute a large part of animal proteins by plant-based ones, and adopting practices to reduce food waste. A similar result have been obtained at the European level (Poux and Aubert 2018).
FIGURE 3. ENVIRONMENTAL IMPACTS OF A CONVERSION OF GLOBAL ARABLE LAND TO ORGANIC FARMING UNDER DIFFERENT SCENARIOS Land use Deforestation GHG emissions Nitrogen surplus Phosphorus surplus Erosion Energy consumption Water consumption Pesticides use
Source: (Alföldi and Müller 2017) FAO projections by 2050
100 % organic with -50% feed/food competition and -50% fast waste
100% organic without other changes 150 100 50 0 -50
4 Arable lands used as grasslands are held constants, only the share of plant production intended for livestock are reduced, along with the proportion of livestock production into total food production.
4. processing, packaging,
origin and seasonality: lower
potentials from a climate point
of view
The processing and packaging of food products is estimated to emit about 1.2 GtCO2e globally, i.e. 7% to 11% of food-related emissions. While packaging and processing emit relatively little overall, these sources have the greatest impact on the cycle of beverages and other products in glass bottles (ADEME 2016b). For prepared dishes, the most important potential for reducing emissions is rather the composition of these dishes (the ratio of animal-based/plant-based ingredients) than in the reduction of packaging or the optimization of processing processes.
The transport of food products is estimated to emit around 800 MtCO2e, i.e. 4% to 7% of the food consumption GHG footprint. Despite this relatively limited contribution, it is important to note that air transport emits considerably more than other modes of transport. In France, among the six ingredients with a GHG footprint greater than 10 kgCO2e/kg 5, we can count not only three types of ruminant meat, but also three fruits or vegetables imported by air. By comparison, plant-based products imported by other routes have a footprint of less than 5 kgCO2e/kg (ADEME 2016b) (see appendix Figure 8). Moreover, emissions generated by the transport of food products are likely to increase along with international trade. However, consuming local products is generally not less emitting than consuming imported products: the emission savings of a shorter transport can be compensated by a more intense local production of GHG (Avetisyan, Hertel, and Sampson 2014), and the economies of scale realized in the logistics of “long food channels” usually give them a lower carbon footprint on the transport component (Åström
et al. 2013; Bellassen et al. 2017).
The seasonality of plant products also has an impact on their GHG footprint. All other things being equal, a fruit or vegetable consumed in France produced out of season in a heated greenhouse would generate 6 to 9 times more GHG emissions (while rarely exceeding 3 kgCO2e/kg) than same fruit or vegetable produced in season (ADEME 2016b).
3. emissions reduction & other food policy
priorities are mostly compatible
Food policies seldom target climate change mitigation but rather health-related goals or other environmental objectives. These policies are also subject to constraints including social equity or cultural acceptability. These aspects are summarized in the FAO definition of sustainable diets: “diets with low environmental impact that contribute to food and nutrition security and healthy living for present and future generations” (FAO 2010).
1. climate and other
environmental goals
GHG emissions from food consumption are not the only environmental concern of governments. Other aspects such as the protection of biodiversity, water quality or the preservation of nitrogen and phosphorus cycles are also part of the sustainability objectives.
Some dietary changes driven by GHG emissions reduction may have strong negative impacts on other environmental indicators. For example, many nutritional studies recommend to substitute meat (including ruminants meat) by seafood products (Clark and Tilman 2017; Perignon
et al. 2016; Tukker et al. 2011). However, such a substitution
may be incompatible with the preservation of current marine ecosystems on the one hand if provided by fishing (Rice and Garcia 2011) and with control of pollution on the other hand in the case of aquaculture (Cao et al. 2007). Another example is the effect of consuming 100% of organic products under current conditions: while nitrogen surpluses and pesticide emissions would be significantly reduced, erosion, land use and deforestation would be negatively affected (Muller et al. 2017).
However, animal products appear to have negative impacts on most – if not all – environmental criteria studied (Jungbluth, Itten, and Stucki 2012; Springmann et al. 2018; Poore and Nemecek 2018a; Bryngelsson et al. 2016). A strong negative impact of animal products relative to other products was highlighted on land use, acidification, (terrestrial and aquatic) eutrophication and ecotoxicity (Clark and Tilman 2017; Tukker et al. 2011; Notarnicola et al. 2017). Some of these studies have also highlighted a negative impact on energy consumption (Clark and Tilman 2017) and ozone depletion (Tukker et al. 2011) compared to other products for the same amount of calories. Ruminant meat especially emit 40 times more GHG, requires has 88 times more land, consumes 8 times more energy, and exhibits a 136 times and 54 times higher potential of acidification and eutrophication respectively than the crops equivalent for the same caloric intake (Clark and Tilman 2017).
2. climate, health
and accessibility
Despite some contradictions between climate and optimal nutritional intake, these two elements are generally compatible in France (Irz et al. 2017). A strict application of nutritional recommendations from 37 countries (representing 64% of the population) would reduce by 13% to 25% the food GHG footprint of these countries (Behrens et al. 2017). Moreover, several public policies that have beneficial effects on both issues have been pointed out (Doro and Requillart 2018).
Indeed, an overall reduction in calories consumed would be positive both in terms of GHG emissions and in terms of health, provided that this reduction is not too important and achieved by populations not at risk of undernutrition (Perignon et al. 2017). It should nevertheless be noted that in France, the diets closest to the health recommendations are not necessarily the least emitting (Florent Vieux et al. 2013).
On the other hand, the health effect of a reduction in meat consumption depends on the type of product by which it is replaced. If replaced entirely with fruits and vegetables, the quantities required to meet nutritional requirements will be so large that the carbon footprint will be increased (Perignon et al. 2017). Nevertheless, many studies conclude that vegetarian or low-meat diets are beneficial in terms of carbon footprint and health (van Dooren et al. 2014; Scarborough et al. 2014; Hoolohan
et al. 2013; Aleksandrowicz et al. 2016; ADEME 2014a;
Jungbluth, Itten, and Stucki, s. d.; Notarnicola et al. 2017; Behrens et al. 2017; WWF and ECO2 Initiative 2017). A massive transition to vegetarian or vegan diets would reduce GHG emissions by 30% to 70% and the mortality rate by 6% to 10% (Springmann et al. 2016). According to Perignon et al. (2016), a significant emission reductions (around 30%) while meeting all the nutritional recommendations could be possible without too radical changes.
The existence of an additional cost to the adoption of less GHG intensive diets is not consensual. Yet, even in cases where such a regime is more expensive, this extra cost does not seem to be the main obstacle. Some authors find that less GHG intense diets are often more expensive (Perignon et al. 2016; Irz et al. 2017). However, it was shown that some consumers had adopted on their own healthier and 20% less emitter diets with equivalent budgets (F. Vieux et al. 2012) or even at a lower cost (Tukker et al. 2011; ADEME and AEFEL 2017).
3. emissions reduction & other food policy priorities are mostly compatible
3. emissions reduction & otHer Food policy priorities Are mostly compAtiBle
3.
e
missions reduction & o
t
H
er
F
ood policy priorities
A re mos tl y c omp A ti B le
3. emissions reduction & otHer Food policy priorities Are mostly compAtiBle
In addition, one study finds that the group of consumers with healthier and less emitting diets is not richer, but allocate a larger share of their total budget to their diets (Seconda et al. 2017). Finally, it appears that high users of organic products (often more expensive) also have less intense GHG regimes. In fact, when these two effects are accounted for, the additional cost of organic food is relatively low or non-existent (Boizot-Szantai, Hamza, and Soler 2017; WWF and ECO2 Initiative 2017). Thus, the main impediment to adopting these diets is not necessarily their cost.
This strong compatibility between a healthy, environmentally sustainable and low GHG intensive diet is confirmed by the EAT-Lancet commission report, co-written by more than thirty researchers recognized in various fields. Despite variations between regions, this report generally recommends a massive reduction in the consumption of red meats and tubers, as well as a considerable increase in the intake of nuts and peanuts, whole grains and pulses (Willett et al. 2019).
4. What are the most effective measures
to orient consumers towards low-carbon
diets?
According to Springmann et al. (2018), the global adoption of a flexitarian diet 6would halve the expected increase in food-related GHG emissions by 2050 (+90% instead of 187%). Studies have shown that changing food behaviors had a higher potential than likely scenarios of technical progress (Bryngelsson et al. 2016; Bajželj et al. 2014). Bryngelsson
et al. (2016) also pointed out that the improvement of
agricultural yields on its own would not be sufficient to reduce GHG emissions while ensuring global food security. Yet, few public policies aim at changing behavior.
1. informational measures
This involves measures that do not use regulatory incentives or constraints. These tools can be public initiatives as well as private companies or associations.
1. Labels on the products
Environnet (2016) has identified carbon labeling initiatives for food and other products in thirteen countries, including France and five other member countries of the European Union. Four types of labels are identified: (1) “low-carbon seal”: indicating a significantly lower carbon footprint of the product compared to other similar products, (2) “carbon rating”: indicating the level of GHG emission of the product in a ranking (bronze, silver, gold for example) of similar products, (3) “carbon score”: indicating the carbon footprint of the product in absolute value (usually in gCO2e) and (4) “carbon offset/neutral”: informing about the carbon neutrality of the product.
Each label category can lead to a multitude of possible definitions, in particular depending on the chosen perimeter to calculate the footprint of the product. Regarding the relative labels 7, the definition of a “similar” product is key: for example, beef may be compared only to other beef, or to other meats and fish, or to other major sources of protein. The classification of the beef product would be strongly affected by the chosen range of comparison.
In addition, the ability of labels to reduce the carbon footprint of consumers is questioned. Two 2011 studies with UK consumers have highlighted a strong misunderstanding of carbon labels (Gadema and Oglethorpe 2011; Upham, Dendler, and Bleda 2011), although this understanding is
6 Here defined as a diet with a high content in legumes, nuts and vegetables, which does not exceed one portion of red meat per week, half a portion of white meat per day, and one portion of dairy per day.
7 Labels indicating the carbon footprint of the product in comparison to others (types 1 and 2).
better than for other environmental labels (Grunert, Hieke, and Wills 2014). Despite a strong demand for carbon labels (Gadema and Oglethorpe 2011), they may have a very limited impact on consumers’ buying behavior (Upham, Dendler, and Bleda 2011; Seconda et al. 2017), or may enter in consideration only after factors such as price and taste (Hartikainen et al. 2014). A study in the United States, however, has shown that a sufficiently readable carbon display could influence purchasing decisions by around 6% (Camilleri et al. 2019). Health-related labels are found to be more effective, with reductions of unwanted consumption by 6% to 13% (Shangguan et al. 2019). This difference may be explained by a better knowledge and a higher concern of consumers concerning the health and diet interactions.
2. Information: public campaigns
and GHG accounting tools
Very few information campaigns focus exclusively on GHG reduction targets. Of the few that focus primarily on climate (Slow Food 2018), the recommendations made are not always perfectly aligned with scientific knowledge. This is for example the case of the Cool Foods campaign which does not suggest a reduction in the consumption of animal products (Center for Food Safety 2018). Some campaigns emphasize on a particular practice such as reducing the consumption of animal products (Meatless Monday, Lundi Vert, Veg Cities, Less Meat Less Heat or Less is More) or reducing food waste (Think Eat Save). Mitigation of climate change is then usually one of several goals, such as health, the environment, food security or animal welfare.
According to an online survey, the Meatless Monday campaign would have encouraged a significant proportion of citizens to reduce their consumption of meat. It is, however, difficult to distinguish in the impact evaluation the effects of information campaigns and those of other measures targeting production. Like many other information campaigns, the Meatless Monday campaign is accompanied by initiatives aimed at production practices (Garnett et al. 2015).
Simple information can have an impact, but it varies according to the way the message is formulated, the initial level of certainty of the individuals and the source of the information (scientific sources and the influence of the close circle would be more effective) (Soler et al. 2017). A Dutch survey points out that it is more efficient to offer consumers several options – reducing daily quantities, eating vegetarian once a week, reducing and improving the quality of meat, and so on. (de Boer, Schösler, and Aiking 2014a).
4. What are the most effective measures to orient consumers towards
low-carbon diets?
4. WHAt Are tHe most eFFective meAsures to orient consumers toWArds loW-cArBon diets?
4. W HA t A re t H e mos t e FF ective me A sures t o orient c onsumers t o W A rds lo W -c A r B on diets
4. WHAt Are tHe most eFFective meAsures to orient consumers toWArds loW-cArBon diets
CUSTOMIZED SUPPORT
We consider here as “customized support” the follow-up of a small group of people with information sessions and educational workshops. Although this type of support cannot be transposed on a larger scale, it is very effective in reducing households’ GHG footprint.
In 2017 in Great Britain, 80% of the 18 participants in an experiment reduced their meat consumption by half. Although the participants were volunteers, they were men aged 24 to 40 who were more athletic than the average and heavy consumers of meat, so they were not likely to reduce their consumption (Hubbub 2018).
The same year in France, 7 households - selected for the representativeness of their food consumption - were accompanied for 5 weeks to increase their purchases of organic products and seasonal fruits and vegetables, and reduce their consumption of animal proteins and their waste. At the end of these five weeks, their carbon footprint decreased by 32%. The study does not specify, however, whether these behaviors persisted after the experiment (ADEME and AEFEL 2017).
Regarding food waste, the general impact of information campaigns is controversial (Hebrok and Boks 2017). However, some campaigns for school canteens have proved to be effective instruments in Europe (Priefer, Jörissen, and Bräutigam 2016; Pinto et al. 2018).
Besides, the tools allowing to compute the carbon footprint of a plate are multiplying. In France, we can count at least two of these: Bon pour le climat and Ettiquetable. The latter comes with a participatory smartphone application containing tips and recipes to reduce its carbon footprint. Such a tool meets the double imperative of explaining to individuals what they need to change and how to bring about a change of habit (Klöckner 2013).
3. Updates of nutrition guidelines and food
governance policies
Most of nutritional guidelines are still incompatible with the 2°C objective 8 (Behrens et al. 2017). United States and Australia’s nutritional guidelines are particularly GHG intensive as their overall adoption would increase GHG emissions compared to the 2050 projection (Ritchie, Reay, and Higgins 2018). Four countries (Brazil, Sweden, Qatar, and Germany) have nevertheless introduced sustainability objectives in their official recommendations (Fischer et al. 2016). In its new nutritional recommendations, France has also integrated environmental issues, encouraging consumers to eat local, seasonal and organic if possible. Meat reduction is not explicitly associated with an environmental objective, but it is recommended to replace meat with dried vegetables (Santé Publique France 2019). In France, local authorities are progressively taking over food issues and introducing GHG reduction targets. In 2017, the agglomeration community Bordeaux-métropole for example was the first in France to have a sustainable food governance advisory council. Other communities are following this initiative, like Montpellier, Nantes, Greater Lyon, or the city of Paris, which has unveiled its sustainable food strategy and is preparing the creation of its own food governance body.
8 The objective of remaining below a 2°C increase of global temperature compared to pre-industrial average.
NUDGE
A nudge is a measure that aims to change the architecture of choice for individuals in order to encourage a change of habit without imposing constraint (Thaler and Sunstein 2003). These techniques have so far mainly aimed healthy eating behaviors but are in principle transferable to emissions reduction objectives, especially since both objectives are generally compatible (see Part III). For example, in a canteen, it is possible to highlight the healthiest choices and make foods that are too rich less accessible, or reduce the size of plates or cutlery. According to a recent meta-analysis, this type of measure would make it possible to increase by 15 % the choices that are beneficial for health (Arno and Thomas 2016).
4. WHAt Are tHe most eFFective meAsures to orient consumers toWArds loW-cArBon diets
2. regulatory policies
1. Taxes
Unlike taxes on domestic production, consumption taxes have the double benefit of not penalizing domestic producers against international competition and avoiding the risk of carbon leakage. 9 Soler et al. (2017) expect taxes to be effective in Europe because of the high sensitivity of consumers to food prices, although the same tax may not have the same effect across countries.
On the intense carbon products
Some political parties in Denmark and Sweden have proposed the introduction of taxes on beef consumption, both slightly above 2 EUR/kg, i.e. approximately EUR 70/ tCO2eq. 10 These proposals met with strong opposition, particularly from the beef sector and the government. The main arguments against insisted on the exacerbation of social inequalities and the choice of poor quality meat that such a tax could induce. Proposals for the use of the tax revenue for the subsidy of other food products or for the conversion assistance of breeders have been made but no tax has yet been adopted in these two (FAIRR 2017). A tax on the most emitting food products would reduce GHG emissions from food by around 5% to 7% in Europe. The maximum GHG emission reductions obtained by the simulations carried out in several European countries (Wirsenius, Hedenus, and Mohlin 2011; Edjabou and Smed 2013; Säll and Gren 2015) including France (Caillavet, Fadhuile, and Nichèle 2016; Bonnet, Bouamra-Mechemache, and Corre 2018; Caillavet, Fadhuile, and Nichèle 2018) did not exceed this order of magnitude, despite various rate settings (from 60 EUR/tCO2eq to 200 EUR/tCO2eq) or tax base (meat of ruminants, all meats, all animal products, etc.).
This literature has also highlighted significant differences in results and potential negative effects depending on the setting of the tax. For example, when the tax base focuses on intense GHG products regardless of their nutritional properties, then it may have a negative effect on the health of consumers. Integrating health issues into the definition of the tax, however, leads to lower efficiency in terms of GHG emissions. Moreover, because the wealthiest households already have diets closer to
9 Carbon leakage correspond to the delocalization of production in another country, emissions reductions within the borders of the country has thus no positive global impact.
10 According to the average footprint of a beef steak in the Ademe’s Base Carbone.
nutritional and environmental recommendations, such a tax on food has a regressive effect: it is more expensive for the poorest households. According to a simulation in France, a compensation tax 11 would exacerbate this regressive effect: the compensated tax is beneficial for the richest households and costly for the poorest households (Caillavet, Fadhuile, and Nichèle 2018).
On waste
Some countries have already implemented pay as you throw tax mechanisms on household waste, which can take different forms such as a tax to the weight, volume, or the number of trash bags. These mechanisms are recognized as particularly effective in reducing the amount of waste and increasing the recycling rate of households. However, they present the risk of inciting behaviors of illegal littering, deposits in neighboring bins, waste burning etc. (Priefer, Jörissen, and Bräutigam 2016). The tax mechanism on the number of trash bags would circumvent these pitfalls while increasing the recycling rate but popular acceptance would be particularly difficult to obtain ex ante although 70% of households are satisfied ex post (Carattini, Baranzini, and Lalive 2018).
In France – where nearly 20% of household waste is food waste (ADEME et al. 2010), incentive pricing on waste management has been adopted by 150 local governments (as of 1st January 2014), representing 3.5 million people. A large majority of cities (91%) opted for a pricing system based on the number of collection bins lifted and / or the weight of the waste. Only 5% of them opted for a pricing system based on the number of bags, and 4% based on the volume of waste. In 2014, waste per capita per year was lowest in communities where incentive pricing was based on weight (103 kg/capita/year), followed by lift and bin size (around 140 kg/capita/year), and lastly by volume tariffs (172 kg/ inhabitant/year) (ADEME 2014b). These results, however, are not sufficient to draw conclusions as to the most effective modality given the fact that neither data on the evolution of waste nor information on possible illegal waste disposal practices is available.
On imports
In order to encourage the purchase of less GHG emitting domestic products, an option considered by different countries is to introduce a tax on the carbon content of imports. To our knowledge, the simulations carried out only take carbon dioxide into account. Depending on whether or not transport emissions are included in the carbon footprint
11 A tax of which all revenues are redistributed as subsidies on beneficial products.
4. W HA t A re t H e mos t e FF ective me A sures t o orient c onsumers t o W A rds lo W -c A r B on diets
4. WHAt Are tHe most eFFective meAsures to orient consumers toWArds loW-cArBon diets
of imports, a tax of EUR 50/tCO2 would result in an average increase of 3-4% to 10-20% in the price of imported products (Atkinson, Hamilton, and Ruta 2010; López et al. 2015). Whether it is a tax on meat, waste or imports, most of these simulations are based on current consumer preferences (sometimes past preferences depending on the availability of data). For example, the effects of a tax would probably be higher than those currently observed if consumers were more willing to substitute animal-based proteins by plant-based proteins. On the basis of some of the elements presented in Part 5, significant changes in consumer preferences could occur relatively quickly.
2. And other regulations
Some municipalities in developed countries are starting to introduce a vegetarian day once a week in canteens. Most large cities in France already propose one free-meat meal once a week in certain public school canteens. 12 The French law relating to a healthy and sustainable diet (among other things) that was adopted in October 2018 makes it mandatory, on an experimental basis, to propose a vegetarian menu at least once a week in school canteens.
12 Cf. the Greenpeace map: https://www.greenpeace.fr/aumenudescantines/
In Helsinki, imposing one vegetarian menu a week has proven beneficial but also had short-term negative side effects. A strong rejection was found in the short term, but in a differentiated way among grades. In middle school, the number of students having lunch in the canteen has decreased by 19%, the amount of food served on the plates by 11% and food waste has increased by 40%. Primary school children (who cannot miss meals) only reduced the amount of food served by 20%, while food waste increase was the only effect in high school food but with an important magnitude (+89%). These negative effects dissipated over time with the exception of the amount of food on the plates, always lower than the other days of the week. According to the authors, when the rejection comes from an attitude of distrust, the default vegetarian option is preferable to an obligation. When the rejection is a matter of taste, meals development and a joint information campaigns would be desirable (Lombardini and Lankoski 2013).
5. Are consumers ready to adopt
a sustainable diet?
The results presented in this section are to be considered with caution. The literature on the perception of the environmental impact of food products and the willingness of consumers to adapt their behavior according to this impact is incomplete and needs to be enriched. These statements of intent also need to be further compared to observed behaviors.
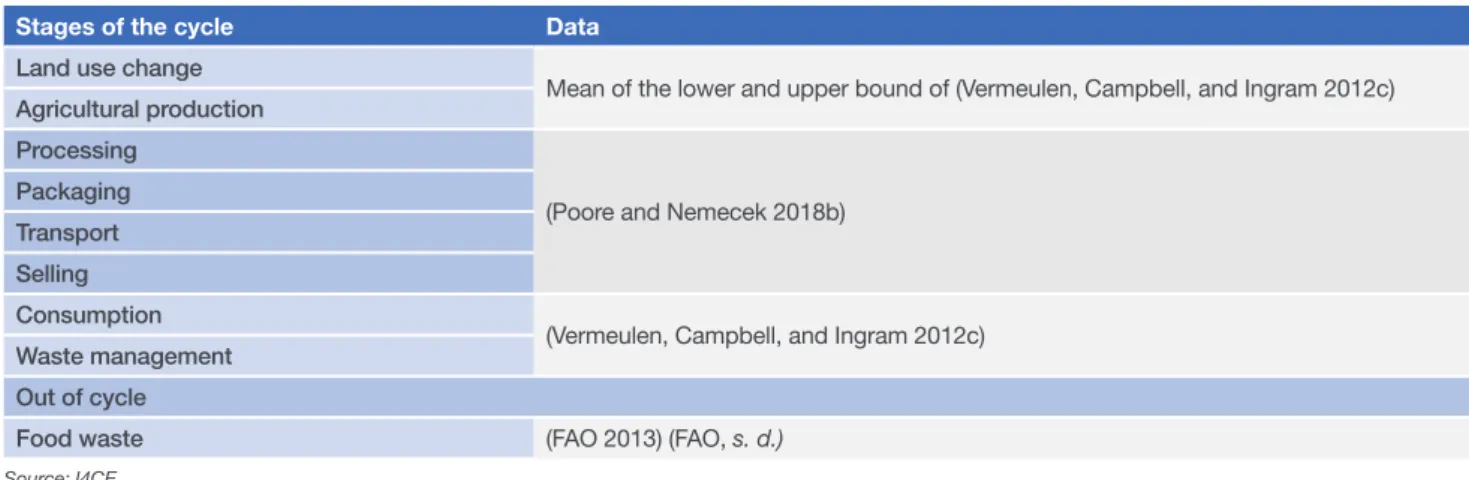
In the United States, consumers generally underestimate the impact of their purchases in terms of GHG emissions, but underestimate even more the impact of their food consumption. Among food products, US consumers are aware of a higher impact of meat compared to plant products, but significantly underestimate it (Camilleri et al. 2019) (Figure 4). A slightly less recent survey found similar results in 18 countries including France (GREENDEX 2014).
According to the same survey, the British, Germans, Australians, Americans, Japanese and Canadians are nevertheless reluctant to change their behavior for environmental reasons. A survey in 6 European countries showed that consumers were more inclined to make small changes such as buying seasonal products or restricting their car trips than to make sacrifices such as reducing their consumption of animal products (Soler et al. 2017). This gap between intentions and observed behavior is also found to
a certain extent in France (see box) and in Belgium (Vermeir and Verbeke 2006), and in Mexico and Brazil specifically on beef consumption (GREENDEX 2014).
According to some studies, some groups of consumers are willing to change their habits for environmental reasons and others not (Graça, Calheiros, and Oliveira 2015; GREENDEX 2014; GreenFlex 2017). Women, for example, would be more inclined to change their eating behavior for environmental reasons (GREENDEX 2014; Ethicity 2016; de Boer, Schösler, and Aiking 2014a). Consumers seem to be also more sensitive to health arguments than to environmental ones (GreenFlex 2017).
In Europe, consumers have little knowledge of the environmental impact of animal products and a limited propensity to reduce their consumption (Hartmann and Siegrist 2017; Tobler, Visschers, and Siegrist 2011; Apostolidis and McLeay 2016). This propensity is lower for people consuming more meat (de Boer, Schösler, and Aiking 2014b). This finding could, however, be quickly challenged. In 2017, for example, a quarter of British people said they wanted to reduce their consumption or have already abandoned products of animal origin (YouGov 2017), a sharp increase compared to 2014 (Bailey, Froggatt, and Wellesley 2014). The share of vegetarian and vegan
FIGURE 4. US CONSUMERS’ PERCEPTION AND ACTUAL GHG EMISSIONS FROM FOOD PRODUCTS
Source: I4CE from (Camilleri et al. 2019) 4,000 3,500 3,000 2,500 2,000 1,500 1,000 500 0 Emissions in “GHG units ” Corn Oran ge Barle y Toma toes Whe at Nuts Apples Soyb eans Beans Potat oes Tofu steak Almo nds Rice Eggs Milk Pork Chee se Beef Lamb
Estimated emissions in GHG units Actual emissions in GHG Units
Note: 100 units of GHG emissions correspond to a 100 W light bulb lighted for 1 hour in the United States
5. Are consumers ready to adopt a sustainable diet?
5. Are consumers reAdy to Adopt A sustAinABle diet?
-5. Are c onsumers re A d y t o A dopt A sus t A in AB le diet
5. Are consumers reAdy to Adopt A sustAinABle diet?
products in all new products increased by 25 % and 257 % respectively between 2010 and 2016 (Mintel 2017). This multiplication responds to one the concern identified among young consumers of meat in the Netherlands that eating less meat would result a lower variety (de Boer, Schösler, and Aiking 2014b).
A study of six European countries also confirmed that lack of information is not the only barrier to adopting less intense GHG regimes. The intrinsic differences of consumers on their altruistic behavior, time preferences, and perceived effectiveness (compared to governments or large firms) are major obstacles (Soler et al. 2017).
conclusion
Food consumption accounts for around a third of global anthropogenic emissions, of which almost two thirds come from the consumption of land-based animal products.
• Reducing the consumption of meat (especially ruminant meat) would therefore be particularly relevant with respect to climate change mitigation but also with respect to health and most environmental issues.
• Reducing the total amount of calories purchased, including the amount of food waste would also be beneficial in many ways for populations non subject to under nutrition.
• From a climate change perspective alone, reducing the consumption of imported, heavily processed, packaged and out-of-season imported products would, by comparison, represent a smaller potential.
• There is no consensus on the benefits of consuming organic and locally produced products in terms of overall GHG emission reductions.
Yet, encouraging the adoption of dietary practices considered both to have a high emission reduction potential and to be compatible with other food policy objectives is not easy.
• The effectiveness of information policies does not appear to be significant and would be particularly dependent on their implementation modalities.
• Regulatory policies such as a food tax would be relatively efficient based on simulations. Beyond simulations, taxes implemented on sweet products have already proved effective in changing dietary behavior. Taxes on the most intense GHG products could, however, have undesirable effects in terms of health or social justice.
These results, however, depend on too few scientific studies, and more experimentation and analysis would be required to draw strong conclusions. More experimentation and evaluation of these experiments would be beneficial. Assessing more systematically the impacts of traditional food policies in terms of GHG emissions would be particularly interesting.
Besides, agricultural policies indirectly influence eating behavior through their effect on food prices. The implementation of food policies aimed at reducing consumers’ footprint must be consistent with policies oriented towards production. A tax on land-based animal products for example would be relatively meaningless without a review of livestock support policies.
conclusion
conclusion
-Acknowledgments:
France Caillavet and Sylvaine Poret (INRA), Thomas Uthayakumar (WWF)
r
e
F
erences
references
• ADEME. 2013. « Vision 2030-2050. Document technique. »
• ———. 2014a. « Alléger l’empreinte environnementale de la consommation des Français en 2030. Vers une évolution profonde des modes de production et de consommation ».
• ———. 2014b. « Bilan des collectivités en tarification incitative au 1er janvier 2014. Caractérisation des collectivités et analyse de l’impact du choix des structures tarifaires sur les flux de déchets. »
• ———. 2016a. « Déchets, chiffres clés ».
• ———. 2016b. « Food’GES ». http://www.bilans-ges.ademe.fr/fr/ actualite/actualite/detail/id/23.
• ADEME, Adelphe, et Eco emballages. 2016. « Le Gisement des Emballages Ménagers en France, Evolution 1994-2012 ».
• ADEME, et AEFEL. 2017. « Opération “Foyers témoins”: Mieux acheter, mieux utiliser et mieux jeter: une consommation plus responsable sans surcoût ! - Synthèse ».
• ADEME, Service public 2000 (France), Bureau de recherches géologiques et minières (France), et du génie rural Centre national du machinisme agricole des eaux et des forêts (France). 2010. La composition des ordures ménagères et assimilées en France [campagne nationale de caractérisation 2007. Angers: ADEME.
• Aleksandrowicz, Lukasz, Rosemary Green, Edward J. M. Joy, Pete Smith, et Andy Haines. 2016. « The Impacts of Dietary Change on Greenhouse Gas Emissions, Land Use, Water Use, and Health: A Systematic Review ». Édité par Andrea S. Wiley. PLOS ONE 11 (11): e0165797. https://doi.org/10.1371/journal.pone.0165797.
• Alföldi, Thomas, et Adrian Muller. 2017. « Video: Strategies for feeding the world more sustainably with organic agriculture (Nature communications) ». https://www.youtube.com/ watch?v=z4daLqmureU.
• Apostolidis, Chrysostomos, et Fraser McLeay. 2016. « Should We Stop Meating like This? Reducing Meat Consumption through Substitution ». Food Policy 65 (décembre): 74-89. https://doi. org/10.1016/j.foodpol.2016.11.002.
• Arno, Anneliese, et Steve Thomas. 2016. « The Efficacy of Nudge Theory Strategies in Influencing Adult Dietary Behaviour: A Systematic Review and Meta-Analysis ». BMC Public Health 16 (1).
https://doi.org/10.1186/s12889-016-3272-x.
• Åström, Stefan, Susanna Roth, Jonatan Wranne, Kristian Jelse, et Maria Lindblad. 2013. « Food Consumption Choices and Climate Change », 49.
• Atkinson, Giles, Kirk Hamilton, et Giovanni Ruta. 2010. « Trade in ‘Virtual Carbon’: Empirical Results and Implications for Policy », 30.
• Avetisyan, Misak, Thomas Hertel, et Gregory Sampson. 2014. « Is Local Food More Environmentally Friendly? The GHG Emissions Impacts of Consuming Imported versus Domestically Produced Food ». Environmental and Resource Economics 58 (3): 415-62.
https://doi.org/10.1007/s10640-013-9706-3.
• Badgley, Catherine, Jeremy Moghtader, Eileen Quintero, Emily Zakem, M. Jahi Chappell, Katia Avilés-Vázquez, Andrea Samulon, et Ivette Perfecto. 2007. « Organic Agriculture and the Global Food Supply ». Renewable Agriculture and Food Systems 22 (02): 86-108.
https://doi.org/10.1017/S1742170507001640.
• Bailey, Rob, Antony Froggatt, et Laura Wellesley. 2014. « Livestock – Climate Change’s Forgotten Sector ». Climate Change, décembre, 30.
• Bajželj, Bojana, Keith S. Richards, Julian M. Allwood, Pete Smith, John S. Dennis, Elizabeth Curmi, et Christopher A. Gilligan. 2014. « Importance of Food-Demand Management for Climate Mitigation ». Nature Climate Change 4 (10): 924-29. https://doi.org/10.1038/ nclimate2353.
• Behrens, Paul, Jessica C. Kiefte-de Jong, Thijs Bosker, João F. D. Rodrigues, Arjan de Koning, et Arnold Tukker. 2017. « Evaluating the
Environmental Impacts of Dietary Recommendations ». Proceedings of the National Academy of Sciences 114 (51): 13412-17. https:// doi.org/10.1073/pnas.1711889114.
• Bellassen, Valentin, F. Arfini, F. Antonioli, A. Bodini, M. Brennan, R. Courbou, L. Delesse, et al. 2017. « Strengthening European Food Chain Sustainability by Quality and Procurement Policy ». Deliverable 3.4.
• Boer, Joop de, Hanna Schösler, et Harry Aiking. 2014a. « “Meatless Days” or “Less but Better”? Exploring Strategies to Adapt Western Meat Consumption to Health and Sustainability Challenges ». Appetite 76 (mai): 120-28. https://doi.org/10.1016/j. appet.2014.02.002.
• ———. 2014b. « “Meatless Days” or “Less but Better”? Exploring Strategies to Adapt Western Meat Consumption to Health and Sustainability Challenges ». Appetite 76 (mai): 120-28. https://doi. org/10.1016/j.appet.2014.02.002.
• Boizot-Szantai, Christine, Oualid Hamza, et Louis-Georges Soler. 2017. « Organic Consumption and Diet Choice: An Analysis Based on Food Purchase Data in France ». Appetite 117 (octobre): 17-28. https://doi.org/10.1016/j.appet.2017.06.003.
• Bonnet, Céline, Zohra Bouamra-Mechemache, et Tifenn Corre. 2018. « An Environmental Tax Towards More Sustainable Food: Empirical Evidence of the Consumption of Animal Products in France ». Ecological Economics 147 (mai): 48-61. https://doi. org/10.1016/j.ecolecon.2017.12.032.
• Bryngelsson, David, Stefan Wirsenius, Fredrik Hedenus, et Ulf Sonesson. 2016. « How Can the EU Climate Targets Be Met? A Combined Analysis of Technological and Demand-Side Changes in Food and Agriculture ». Food Policy 59 (février): 152-64. https://doi. org/10.1016/j.foodpol.2015.12.012.
• Caillavet, France, Adélaïde Fadhuile, et Véronique Nichèle. 2016. « Taxing Animal-Based Foods for Sustainability: Environmental, Nutritional and Social Perspectives in France ». European Review of Agricultural Economics 43 (4): 537-60. https://doi.org/10.1093/ erae/jbv041.
• Caillavet, France, Adélaïde Fadhuile, et Veronique Nichèle. 2018. « Assessing the Distributional Effects of Carbon Taxes on Food: Inequalities and Nutritional Insights », 28.
• Camilleri, Adrian R., Richard P. Larrick, Shajuti Hossain, et Dalia Patino-Echeverri. 2019. « Consumers Underestimate the Emissions Associated with Food but Are Aided by Labels ». Nature Climate Change 9 (1): 53-58. https://doi.org/10.1038/s41558-018-0354-z.
• Cao, Ling, Weimin Wang, Yi Yang, Chengtai Yang, Zonghui Yuan, Shanbo Xiong, et James Diana. 2007. « Environmental Impact of Aquaculture and Countermeasures to Aquaculture Pollution in China » 14 (7): 452–462.
• Carattini, Stefano, Andrea Baranzini, et Rafael Lalive. 2018. « Is Taxing Waste a Waste of Time? Evidence from a Supreme Court Decision ». Ecological Economics 148 (juin): 131-51. https://doi. org/10.1016/j.ecolecon.2018.02.001.
• Cassidy, Emily S, Paul C West, James S Gerber, et Jonathan A Foley. 2013. « Redefining Agricultural Yields: From Tonnes to People Nourished per Hectare ». Environmental Research Letters 8 (3): 034015. https://doi.org/10.1088/1748-9326/8/3/034015.
• Center for Food Safety. 2018. « About the Cool Foods Campaign ».
https://www.centerforfoodsafety.org/issues/305/food-and-climate/ about-the-cool-foods-campaign.
• Claquin, Pierre, Florent Bidaud, Elise Delgoulet, Claire Deram, Julia Gassie, Bruno Hérault, et Martin Alexandre. 2017. « MOND’Alim 2030. Panorama prospectif de la mondialisa tion des systèmes alimentaires ».
references
reFerences
-reFerences
• Clark, Michael, et David Tilman. 2017. « Comparative Analysis of Environmental Impacts of Agricultural Production Systems, Agricultural Input Efficiency, and Food Choice ». Environmental Research Letters 12 (6): 064016. https://doi.org/10.1088/1748-9326/aa6cd5.
• Dhoubhadel, Sunil P., Farzad Taheripour, et Matthew C. Stockton. 2016. « Livestock Demand, Global Land Use Changes, and Induced Greenhouse Gas Emissions ». Journal of Environmental Protection 07 (07): 985-95. https://doi.org/10.4236/jep.2016.77087.
• Dooren, C. van, Mari Marinussen, Hans Blonk, Harry Aiking, et Pier Vellinga. 2014. « Exploring Dietary Guidelines Based on Ecological and Nutritional Values: A Comparison of Six Dietary Patterns ». Food Policy 44 (février): 36-46. https://doi.org/10.1016/j. foodpol.2013.11.002.
• Doro, Erica, et Vincent Requillart. 2018. « Sustainable Diets: Are Nutritional Objectives and Low-Carbon-Emission Objectives Compatible ? », 46.
• Edjabou, Louise Dyhr, et Sinne Smed. 2013. « The Effect of Using Consumption Taxes on Foods to Promote Climate Friendly Diets – The Case of Denmark ». Food Policy 39 (avril): 84-96. https://doi. org/10.1016/j.foodpol.2012.12.004.
• Environmental Footprint Explorers. 2018. « Environmental Footprint Explorers Visualisation tools ». https://www.environmentalfootprints. org/infographics#.
• Environnet. 2016. « Carbon labelling ». http://www.environnet.in.th/ en/archives/1503.
• Ethicity. 2016. « La Rupture c’est nous ! Les Français et la consommation responsable ».
• FAIRR. 2017. « The Livestock Levy: are regulators considering meat taxes ? »
• FAO. 2010. « Biodiversité et régimes alimentaires durables unis contre la faim. Rapport Final. » Rome.
• ———. 2011. « Organic agriculture and climate change mitigation. A report of the Round Table on Organic Agriculture and Climate Change ». Rome, Italy.
• ———. 2013. « Food wastage footprint, impacts on natural resources, summary report ».
• ———. , éd. 2018. Building Climate Resilience for Food Security and Nutrition. The State of Food Security and Nutrition in the World 2018. Rome: FAO.
• ———. s. d. « Food Wastage Footprint & Climate Change », 4.
• ———. s. d. « Food Wastage Footprint & Climate Change », 4.
• FAOSTAT. 2018. « Data - Trade - Crops and livestock products ».
http://www.fao.org/faostat/en/#data/TP.
• Fischer, Carlos Gonzalez, Tara Garnett, Food and Agriculture Organization of the United Nations, University of Oxford, et Food Climate Research Network. 2016. Plates, Pyramids, and Planets: Developments in National Healthy and Sustainable Dietary Guidelines: A State of Play Assessment.
• Food Wastage Footprint Full-Cost Accounting: Final Report. 2014. Rome: Food Wastage Footprint.
• Gadema, Zaina, et David Oglethorpe. 2011. « The Use and Usefulness of Carbon Labelling Food: A Policy Perspective from a Survey of UK Supermarket Shoppers ». Food Policy 36 (6): 815-22.
https://doi.org/10.1016/j.foodpol.2011.08.001.
• Garnett, Tara, Sophie Mathewson, Philip Angelides, et Fiona Borthwick. 2015. « Policies and Actions to Shift Eating Patterns: What Works? » What Works, 85.
• Gearhardt, Ashley N., Marie A. Bragg, Rebecca L. Pearl, Natasha A. Schvey, Christina A. Roberto, et Kelly D. Brownell. 2012. « Obesity and Public Policy ». Annual Review of Clinical Psychology 8 (1): 405-30. https://doi.org/10.1146/annurev-clinpsy-032511-143129.
• Gerber, Pierre J. 2013. Tackling Climate Change through Livestock: A Global Assessment of Emissions and Mitigation Opportunities. Édité par FAO. Rome: Food and Agriculture Organization of the United Nations.
• Gerber, Pierre J., Henning Steinfeld, Benjamin Henderson, Anne Mottet, et Carolyn Opio, éd. 2013. Tackling Climate Change through Livestock: A Global Assessment of Emissions and Mitigation Opportunities. Rome: FAO.
• Graça, João, Maria Manuela Calheiros, et Abílio Oliveira. 2015. « Attached to Meat? (Un)Willingness and Intentions to Adopt a More Plant-Based Diet ». Appetite 95 (décembre): 113-25. https://doi. org/10.1016/j.appet.2015.06.024.
• GREENDEX. 2014. « Summary of Food Results and Analysis of Behavior Change.pdf ».
• GreenFlex. 2017. « Tous acteurs ! Les français et la consommation responsable ».
• Grunert, Klaus G., Sophie Hieke, et Josephine Wills. 2014. « Sustainability Labels on Food Products: Consumer Motivation, Understanding and Use ». Food Policy 44 (février): 177-89. https:// doi.org/10.1016/j.foodpol.2013.12.001.
• Hartikainen, Hanna, Taneli Roininen, Juha-Matti Katajajuuri, et Hannele Pulkkinen. 2014. « Finnish Consumer Perceptions of Carbon Footprints and Carbon Labelling of Food Products ». Journal of Cleaner Production 73 (juin): 285-93. https://doi.org/10.1016/j. jclepro.2013.09.018.
• Hartmann, Christina, et Michael Siegrist. 2017. « Consumer Perception and Behaviour Regarding Sustainable Protein Consumption: A Systematic Review ». Trends in Food Science & Technology 61 (mars): 11-25. https://doi.org/10.1016/j. tifs.2016.12.006.
• Hebrok, Marie, et Casper Boks. 2017. « Household Food Waste: Drivers and Potential Intervention Points for Design – An Extensive Review ». Journal of Cleaner Production 151 (mai): 380-92. https:// doi.org/10.1016/j.jclepro.2017.03.069.
• Hoolohan, C., M. Berners-Lee, J. McKinstry-West, et C.N. Hewitt. 2013. « Mitigating the Greenhouse Gas Emissions Embodied in Food through Realistic Consumer Choices ». Energy Policy 63 (décembre): 1065-74. https://doi.org/10.1016/j.enpol.2013.09.046.
• INCOME consulting, et AK2C. 2016. « Pertes et gaspillages alimentaires: l’état des lieux et leur gestion par étapes de la chaîne alimentaire », 164.
• Irz, Xavier, Pascal Leroz, Vincent Réquillart, et Louis-Georges Sole. 2017. « Entre preservation de l’environnement et de la santé, calcul coût benefices des recommandations alimentaires ». INRA Sciences Sociales, no 5 (avril).
• Jungbluth, Niels, René Itten, et Matthias Stucki. 2012. « U m w e l t b e l a s t u n g e n d e s p r i v a t e n K o n s u m s u n d Reduktionspotenziale », juin, 135.
• ———. s. d. « Umweltbelastungen des privaten Konsums und Reduktionspotenziale », 135.
• Klöckner, Christian A. 2013. « A Comprehensive Model of the Psychology of Environmental Behaviour—A Meta-Analysis ». Global Environmental Change 23 (5): 1028-38. https://doi.org/10.1016/j. gloenvcha.2013.05.014.
• Lombardini, Chiara, et Leena Lankoski. 2013. « Forced Choice Restriction in Promoting Sustainable Food Consumption: Intended and Unintended Effects of the Mandatory Vegetarian Day in Helsinki Schools ». Journal of Consumer Policy 36 (2): 159-78. https://doi. org/10.1007/s10603-013-9221-5.
• López, Luis-Antonio, María-Angeles Cadarso, Nuria Gómez, et María-Ángeles Tobarra. 2015. « Food Miles, Carbon Footprint and Global Value Chains for Spanish Agriculture: Assessing the