Publisher’s version / Version de l'éditeur:
Separation and Purification Technology, 53, 3, pp. 301-311, 2007
READ THESE TERMS AND CONDITIONS CAREFULLY BEFORE USING THIS WEBSITE. https://nrc-publications.canada.ca/eng/copyright
Vous avez des questions? Nous pouvons vous aider. Pour communiquer directement avec un auteur, consultez la première page de la revue dans laquelle son article a été publié afin de trouver ses coordonnées. Si vous n’arrivez pas à les repérer, communiquez avec nous à PublicationsArchive-ArchivesPublications@nrc-cnrc.gc.ca.
Questions? Contact the NRC Publications Archive team at
PublicationsArchive-ArchivesPublications@nrc-cnrc.gc.ca. If you wish to email the authors directly, please see the first page of the publication for their contact information.
NRC Publications Archive
Archives des publications du CNRC
This publication could be one of several versions: author’s original, accepted manuscript or the publisher’s version. / La version de cette publication peut être l’une des suivantes : la version prépublication de l’auteur, la version acceptée du manuscrit ou la version de l’éditeur.
For the publisher’s version, please access the DOI link below./ Pour consulter la version de l’éditeur, utilisez le lien DOI ci-dessous.
https://doi.org/10.1016/j.seppur.2006.08.003
Access and use of this website and the material on it are subject to the Terms and Conditions set forth at
Performance of PEI/BMI semi-IPN membranes for separations of
various binary gaseous mixtures
Kurdi, Jamal; Kumar, Ashwani
https://publications-cnrc.canada.ca/fra/droits
L’accès à ce site Web et l’utilisation de son contenu sont assujettis aux conditions présentées dans le site LISEZ CES CONDITIONS ATTENTIVEMENT AVANT D’UTILISER CE SITE WEB.
NRC Publications Record / Notice d'Archives des publications de CNRC:
https://nrc-publications.canada.ca/eng/view/object/?id=a4957ced-96b7-446c-891e-379ea9a28341 https://publications-cnrc.canada.ca/fra/voir/objet/?id=a4957ced-96b7-446c-891e-379ea9a28341Performance of PEI/BMI semi-IPN membranes for separations
of various binary gaseous mixtures
夽
Jamal Kurdi, Ashwani Kumar
∗Institute for Chemical Process and Environmental Technology, National Research Council of Canada, M-12 Montreal Road Campus, Ottawa, Ont. K1A 0R6, Canada
Received 16 February 2006; received in revised form 28 July 2006; accepted 7 August 2006
Abstract
Synthesis of polyetherimide–bismaleimide (PEI–BMI) semi-interpenetrating polymer networks (semi-IPNs) combined with solvent phase inver-sion was used to prepare asymmetric flat membranes, which were coated with silicon rubber. These membranes were evaluated for production of O2-enriched air and separation of CO2from its mixture with CH4as well as with N2. Using different preparation schemes membranes with varying
skin and supported layer characteristics were prepared. These different morphologies of membranes were responsible for a trade-off performance between gas permeance and permselectivity. These new composite, PEI–BMI semi-IPN membranes showed suitable performance for production of O2-enriched air and separation of CO2from natural gas or flue gas relevant to greenhouse gas emission control. Membrane performance was
explained in terms of the intrinsic gas transport properties of the coated silicon layer and membrane glassy material, which determine the limitations of permeance–permselectivity trade-off. It was also found that the permselectivity for CO2over CH4or N2increases with increasing CO2feed
concentration. This might be exploited to arrange for more cost-efficient multistage gas separation systems. Crown Copyright © 2006 Published by Elsevier B.V. All rights reserved.
Keywords: Semi-IPN; BMI; PEI; Gas separation membranes
1. Introduction
There has been significant growth in the production of nat-ural gas as an efficient and environmentally clean fuel supply [1]. Membrane-based gaseous separation is a green technology that has the potential to improve the economics of natural gas upgrading as well as separation of green house gases (GHG) from flue gases[2]. However, there are challenges in preparing membranes with the desirable combination of high selectivity and high permeability that could achieve competitive gas sepa-ration processes in all applications of natural gas industry[3]. The chemical and physical resistance as well as the stability and durability of the developed membranes are also desirable[4].
Novel tailored materials with tuned superior properties and characteristics for gaseous separations could be made by com-bining soft and hard block phases dispersed at a molecular or nanoscale[5]. For example, a mixed matrix membrane
compris-夽 NRCC No.:49103
∗Corresponding author. Tel.: +1 613 998 0498.
E-mail address:ashwani.kumar@nrc-cnrc.gc.ca(A. Kumar).
ing a mixture of a glycol plasticizer, a particulate solid support and silicon rubber coated on a porous support media was dis-covered to have an improved stability and performance for the separation of gases and processing natural gas [6]. Coating highly porous polysulfone with a composite of silicon rubber and polyethylene glycol produces membranes with a greater selectivity for polar gas (H2S) over non-polar gases (methane, carbon dioxide and hydrogen) than that for polysulfone mem-branes coated with only silicon rubber [7]. The dispersion of nonporous fumed silica nanoparticles into glassy amorphous poly (4-methyl-2-pentyne) produces a reverse-selective mem-brane by enhancing both the permeability and selectivity of the larger n-butane molecules over the smaller methane molecules [8]. An improved alloy-type membrane exhibiting good mechan-ical strength and desirable hydrophilic membrane properties was prepared from a casting solution of a compatible blend of a vinylidene fluoride polymer and a vinyl acetate polymer that can be hydrolyzed after casting to render hydrophilic surface [9]. However, tailoring useful nanocomposite polymeric mem-brane still faced with many challenges such as the formation of micro-scale defects, inadequate particle dispersion and poor polymer–particle interfacial adhesion[5,8]. Chemical and
phys-1383-5866/$ – see front matter. Crown Copyright © 2006 Published by Elsevier B.V. All rights reserved. doi:10.1016/j.seppur.2006.08.003
Table 1
Chemical structure of PEI, BMI and NMP
Component Chemical structure
PEI
BMI
NMP
ical stability of the nanocomposite materials as well as their resistance to plasticization and loss of selectivity due to CO2 and C3+ hydrocarbons are important issues that should be con-sidered[10].
Thermoplastic (PEI) and thermosetting (BMI) materials were chosen for their high performance characteristics and com-mercial availability. We found that in situ polymerization of BMI monomer inside PEI/NMP solution forms hard phase of thermoset BMI resin that interpenetrates soft phase of ther-moplastic PEI networks, i.e. formation of physical interlock between the two phases. The chemical structures of the semi-interpenetrating polymer network of BMI–PEI have been ana-lyzed by ATR–FTIR and XPS spectroscopy including the description of possible reactions as reported in our earlier work[11]. The BMI–PEI semi-IPN was found to be suitable for gaseous separations[13]. However, these new membranes were not investigated for natural gas, landfill leachate gas, O2 -enriched air and GHG separation applications. The present work reports use of these materials in formation and characterization of new membranes that are suitable for gaseous mixtures that simulate natural gas and flue gases.
2. Experimental
2.1. Materials
Aromatic polyetherimide (PEI) Ultem® 1000 was supplied by General Electric Plastics, USA in pellet form and was dried in an oven at 150◦C for 8 h before use to remove any possible absorbed water vapors. Anhydrous 1-methyl-2-pyrrolidinone (NMP), Aldrich, 99.5%, reagent grade (water < 0.005%) and 1,1′-(methylenedi-4,1-phenylene) bismaleimide (BMI) 95% were supplied by Sigma–Aldrich Canada Ltd. Chemical struc-tures of PEI, BMI and NMP are given inTable 1. Anhydrous ethyl alcohol was received from Commercial Alcohols Inc., Ont., Canada. Hexanes of ACS reagent grade were supplied by VWR, Canada. All solvents were used as supplied under a dry nitrogen atmosphere. Ultra high purity helium, medical air, CO2 and CH4were supplied by BOC Gases Canada Ltd. and were used as received without further purification.
2.2. Membrane preparation
Casting solutions with various compositions listed inTable 2 were prepared. PEI was completely dissolved in NMP solvent by rolling the bottle of each sample slowly then, anhydrous EtOH was added with slow mixing until a homogenous solution was obtained. It was possible to reduce the required time for this process by increasing temperature to 60◦C. BMI powder was added to some of these casting solutions (seeTable 2) and slow mixing was carried out for one group of samples at ambient condition. A second group of samples was rolled inside a cabinet that was fitted with three infra-red lamps (375 W) with adjustable intensity to control the temperature. In our experiments, it was maintained at 60◦C. The change in color of each sample was monitored and all solutions were cast at different mixing times. Membranes were cast at room temperature on clean glass plates placed in a glove box equipped with a gas filter. After casting each sample with a doctor knife having a gap of 250 m, the plate was quickly immersed in distilled water at ambient temperature. The membrane films were left in water for 3 days then washed and stored in anhydrous EtOH bath for 1 day. Membranes were subsequently placed in hexanes for 1 day before leaving them in a fume hood for 1 day. Drying was carried out at 80◦C in air-purging convection oven for 1 day and finally in vacuum oven at 80◦C and 96.7 kPa (725 mmHg) for 2 days. Three circular
Table 2
Compositions of polymeric solutions used in this study
Sample number Composition, percent (w/w) of the total solution
PEI BMI NMP EtOH
1 25 0 62.35 12.65 2 24.75 0.25 62.35 12.65 3 23.75 1.25 62.35 12.65 4 22.5 2.5 62.35 12.65 5 29 0 60 11 6 28.71 0.29 60 11 7 27.55 1.45 60 11 8 26.1 2.9 60 11 9 19.5 0 67.2 13.3 10 17.6 1.9 67.2 13.3
coupons of 7.4 × 10⁻²m diameter were cut from each sample to be used in the permeation test while other pieces were cut from the same sample for SEM characterization.
Membranes used in the permeation test were coated with silicon rubber. A solution of 3% Sylgard 184 with a catalyst to base rubber ratio of 1:10 in n-pentane was sprayed as a thin layer on the top surface of the membrane and the solvent was allowed to evaporate. Application of four coatings was found to be adequate for making gas separation membranes. Finally, the silicon coated membranes were cured in air purging convection oven at 80◦C for 1 day.
2.3. Membrane morphology
Membrane samples without silicon rubber coating were examined by scanning electron microscope (SEM) using JEOL 840A equipment at an accelerating voltage of 10 kV. Samples were prepared by cutting a strip from membrane, freezing in liquid nitrogen and fracturing to obtain a representative sam-ple. They were mounted on carbon tape on 45◦SEM stubs and sputter coated with gold. Photographs were taken at different magnifications.
2.4. Permeation test
A cross-flow test cell having a permeation surface area of 9.6 cm2was used. Pure O2, N2and medical air were used to study O2/N2separation. Pure CH4, CO2, N2and their mixture were used to study CO2/CH4and CO2/N2separations. Feed pressure of 665 kPa gauge (498.8 cmHg) was used and the retentate was set at a flow rate of 6.6 × 10⁻⁶m3(STP) s−1while permeate was discharged to atmosphere. The permeate flow rate was measured by a soap bubble flow meter and O2, CH4and CO2 concentra-tions of feed and permeate gas mixtures were determined by gas chromatography.
3. Results and discussion
Synthesis procedure for PEI–BMI semi-IPNs combined with membrane formation was finalized after several preliminary experiments. It was observed that BMI could be polymerized slowly inside and through PEI/NMP solutions at ambient con-ditions in the presence of ethyl alcohol[11–13]. The progress of polymerization was followed by measuring the viscosity, color change and spectroscopic analysis as discussed in details in our earlier work[11]. It is worth noting that in situ anionic poly-merization of BMI has many advantages such as avoiding the addition of complicated initiators or catalysts as well as obtain-ing low molecular weight thermosettobtain-ing polymer as discussed elsewhere[14]. Using EtOH as a proton donor, the color of the PEI–BMI polymeric solution underwent gradual change from light yellow to bright crimson. It was worth noting that the polymerization rate of BMI depends on the transparency of the used bottle, the speed of mixing, the intensity of light, temper-ature, composition and concentration of the polymer solution. Absorption of water vapor during preparation of the solution
might also have an influence on the rate of BMI polymeriza-tion. For our samples we observed that at room temperature, the solution need from 11–24 days for onset of color change while at 60◦C, color changed in less than 24 h. It was observed that color change was faster for transparent bottles, more intense light, lower BMI concentration, lower viscosity and higher speed of mixing. Appearance of dark red color was an indication for complete polymerization of BMI to a low molecular weight resin and mixing for longer time did not lead to a significant change in the solution. This was due to anionic polymerization of BMI that usually led to a low molecular weight polymer as discussed elsewhere[14]. All polymer solutions were suitable for produc-ing gas separation membranes as long as there is no large phase separation or precipitation. It was worth noting that the samples mixed at 60◦C, BMI had significantly shorter polymerization time than those samples mixed at room temperature. Regardless of mixing temperatures ripe solutions, as indicated by red color, of same compositions formed membranes with no significant differences in their morphology or separation performance.
3.1. Morphology analysis
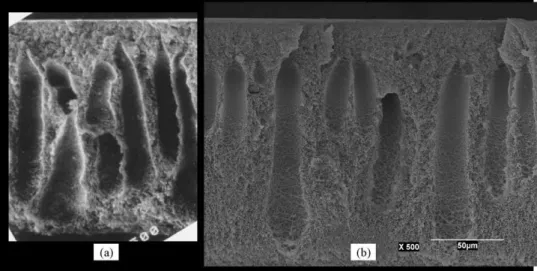
Membrane morphology plays an important role in deter-mining membrane performance for gas separations. Therefore, membranes were examined by scanning electron microscopy (SEM) to show the change in the morphology that might influ-ence the performance of gas separation membranes. As shown inFig. 1, membranes labeled (a) that was produced from casting solution containing 19.5 wt.% polymer have an apparent thick-ness of 148 m and membranes labeled (b) that was made from a solution containing 29 wt.% polymer had an apparent thick-ness of 170.5 m. This means that the shrinkage of membrane (a) due to coagulation is higher, which led to a thinner structure and larger number of fingers (seeFig. 1) than those in membrane (b). For quantitative comparison of the differences between these two membranes (a and b), additional measurements and calcu-lations were done. The weights of these dried membranes (a and b) of 16 cm2 area were determined by a balance (least count 0.0001 g). The density of two polymer solutions used to pro-duce the above mentioned membranes (a and b) were determined using the same balance and 100 ml volumetric flasks with class A glass stopper. For an area of 16 cm2, the weight of the used solution was calculated from the corresponding polymer concen-tration and the net polymer weight. The volume of the solution was calculated from its weight and density. The thickness of the solution was calculated from its volume and area (i.e. 16 cm2). The apparent density of the two membranes was calculated by divided membrane weight by its apparent volume. The results are shown inTable 3. It was clear that the apparent density of membrane (a) was lower than that for membrane (b) by 26% and the total thickness was reduced by 13%. Although we used same doctor blade (i.e. gap of 250 m), the thickness of mem-brane cast with solution (b) has to be 262 m in order to produce 16 cm2dried membrane that weighs 0.1227 g. This means that a slight swelling of the more viscous solution (b) took place during casting process that was similar to die swelling as illus-trated elsewhere[15]. According to Ismail and Hassan[16]shear
Fig. 1. Morphologies of membranes produced from casting solutions containing 19.5% polymer concentration (a) and 29% polymer concentration (b). SEM was obtained at the same magnification 500× and the same scale distance was used for both membranes.
rate is a function of the velocity of casting knife and membrane thickness. Therefore, the shear rate that influences membrane morphology and performance as discussed elsewhere [15,17] was not the same for the two membranes when the same speed of casting knife is used. It is worth noting that the skin layer thickness of the two membranes was comparable.
Spongy structure of these membranes might also be influ-enced by solution compositions and gellation conditions as dis-cussed elsewhere[18].Fig. 2shows the top and bottom parts of the cross-sections of membranes (a) and (b). It is clear that the cross-section of the top skin layer membrane (a) has higher porosity than membrane (b). Also the cross-section of bottom spongy layer has a higher porosity than the top skin layer for both membranes. This increase in the spongy pore size especially for the bottom layer could be attributed to increased amount of solvent (NMP) in the coagulation medium (water). A similar phenomenon was also reported elsewhere[19].
Regardless of the membrane materials, the above morphol-ogy observations indicate that membrane preparation procedures play an important role in determination of the size, shape and distribution of pore or free volume. Generally, solution contain-ing high polymer concentration (usually more than 25% (w/w) of polymer) might produce membranes with a tighter structure and lower free volume compared to the membranes produced
from solutions containing a lower polymer concentration (e.g. 19.5%). The tighter morphology leads to membranes with a low fluid flux and high interactions between the transported fluid and the membrane materials that might lead to an improved fluid permselectivity. The less tight morphology leads to an oppo-site influence on the fluid flux and permselectivity. Therefore, various membranes could be produced from the same materials that have varying morphology with a trade-off between mem-brane permeance and permselectivity. This trade-off, which is related to membrane morphology resulted from using different preparation method, is different from the Robeson’s trade-off [20]that is used to compare different membrane materials but not different membrane morphology. The ability to tailor these membranes and control their morphology has been reported else-where[21,22].
3.2. Gas transport characteristics 3.2.1. Air separation
Semi-IPN PEI–BMI membranes were evaluated for per-meation of pure oxygen and nitrogen as well as for air.Fig. 3 shows the trade-off curve plot of O2/N2 permselectivity versus O2 permeance based on permeation of pure gases. As we have discussed in the morphology analysis section, it is Table 3
Apparent volumeaand thickness of two membranes (a and b) as well as for their corresponding solutions with 19.5% and 29% (w/w) polymers, respectively Sample Area (cm2) Polymer
concentration (%) Polymer weighta(g) Solution density (g/cm3) Thickness (cm) Apparent volumea(cm3) Apparent density (g/cm3) Solution (a) 16 19.5 0.0785 1.0066b 0.02500c 0.3999 – Solution (b) 16 29 0.1227 1.0100b 0.02618c 0.4189 – Membranes (a) 16 – 0.0785 – 0.01480d 0.2368 0.3315 Membranes (b) 16 – 0.1227 – 0.01705d 0.2728 0.4498 aCorresponding to 16 cm2area. b Measured. cCalculated. d Measured by SEM.
Fig. 2. Cross-section SEM of membranes produced from casting solutions containing 19.5% polymer concentration (a) and 29% polymer concentration (b). Top two photographs represent the top layer of each membrane and the two bottom photographs represent the bottom layer of each membrane.
possible to control membrane morphology and its apparent density through changing the preparation procedures. Although Fig. 3 shows the decrease in the O2/N2 permselectivity with an increase in the O2 permeance, the rate of these changes is not constant and might be divided into two regions. The first region represent permeance ranging up to 30 GPU (the gas permeation unit, GPU = 10−6cm3(STP)/(cm2s cmHg) or 3.35 × 10⁻¹⁰mol/(m2s Pa) in SI unit) where there is a steep decrease in the O2/N2 permselectivity with a slight increase
Fig. 3. Trade-off curve plot of O2permeance and O2/N2permselectivity based on the permeation of pure gases. Filled square symbols are for PEI membranes without BMI. Labels correspond to the sample number listed inTable 2.
in the O2permeance. In this region, the dominant interactions are between the permeable gases and the semi-IPN PEI–BMI networks. The improvement in the O2/N2permselectivity might be attributed to membrane skin integrity that could be explained by the polymer chain orientation and gradual change in the microscopic porosity through the cross-section of the membrane skin. As there is a slight change in the gas permeance, it is possible that the denser of the top surface of the skin layer is accompanied with a less dense structure for the rest of the skin (transition layer) and vice versa. For example we were not able to make PEI membranes with O2/N2 permselectivity equal or greater than 7, it was possible to make semi-IPN PEI–BMI membranes with O2/N2permselectivity of slightly larger than 7. This indicates that the new membrane material has a superior ability to form improved membrane skin integrity compared to using PEI alone as a membrane material. Therefore, both procedures for membrane preparation in addition to membrane material characteristics are of great importance for improving performance of gas separation membranes. The influence of shear rate on the morphology and separation performance of hollow fiber membranes was first studied by Chung et al[23]. Recently, Ismail and Hassan [16] reported the preparation of asymmetric polysulfone nanofiltration flat membranes, and showed that decreasing the polymer concentration or increasing the shear rate (up to a critical shear rate) led to an increase in the pure water permeation but a decrease in the percentage of salt rejection. A similar observation on the influence of shear rate in membrane preparation on the membrane per-formance for CO2/CH4 separation was reported elsewhere [17].
In the second region (permeance higher than 30 GPU), there is a slight decrease in the O2/N2permselectivity with the increase in the O2permeance. This permselectivity is close to the intrin-sic O2/N2permselectivity for silicon rubber (i.e. α = 2.22) that was coated on the membrane. It is clear that the interactions between the permeable gases and the coated silicon rubber in this region are dominant. The large increase in the gas permeance was attributed to the decrease in the gas transport resistance of the supported layer (i.e. semi-IPN PEI–BMI membrane). How-ever, there is a limitation on the increase of gas permeance by an increase in the free volume of the supported layer that might lead to a decrease in its mechanical strength or creation of large defects. As reported by Koros et al.[15], these defects should be small enough in order to have the ability to caulk the membrane skin with silicon rubber and eliminate the Knudsen flow through these defects that deteriorate membrane gas permselectivity.
Using air as a feed gas a trade-off curve between O2/N2 permselectivity and O2-enriched air permeance was observed as shown inFig. 4. It was worth noting that the semi-IPN PEI–BMI membranes had an improved performance for O2/N2 separa-tion compared to PEI membranes without BMI. This might be attributed to an improved membrane skin integrity that led to an increase in O2/N2permselectivity with a slight decrease in gas permeance. It was further observed that membrane labeled (b) in this work had O2-enriched air permeance of 9 GPU and O2/N2 permselectivity of 7. Conversely, we observed an increase in the gas permeance due to a decrease in the gas transport resistance of the membranes without formation of defects, which are not small enough to be caulked by the silicon rubber. For example membrane labeled (a) in this work has O2-enriched air perme-ance of more than 150 GPU and O2/N2permselectivity of 2.2.
3.2.2. CO2/CH4separation
Performance of semi-IPN PEI–BMI membranes were studied through the permeation of CO2, CH4and their mixtures. The
Fig. 4. Trade-off curve plot of O2-enriched air permeance and O2/N2 perms-electivity based on the permeation of air. Filled square symbols are for PEI membranes without BMI. Labels correspond to the sample number listed in
Table 2.
Fig. 5. Trade-off curve plot of CO2permeance and CO2/CH4permselectivity based on the permeation of pure gases. Filled square symbols are for PEI mem-branes without BMI. Labels correspond to the sample number listed inTable 2.
trade-off curve of CO2permeance and CO2/CH4permselectivity based on permeation of pure gases is shown inFig. 5. On one hand it was possible to have a membrane with CO2permeance of 23.3 GPU and ideal CO2/CH4permselectivity of 39.5. On the other hand, a membrane with CO2permeance of 458 GPU and ideal CO2/CH4permselectivity of 3.5 was also obtained. There is a slight improvement in the performance of semi-IPN PEI–BMI membranes over PEI membranes without BMI (seeFig. 5). The permeation test for pure CH4was carried out before using pure CO2permeation test. It is worth noting that repeating the pure CH4permeation test immediately after using CO2produced the same results indicating that there were no CO2plasticization or dilation effects[24]on these membranes.
From permeation data of CO2and CH4mixtures, shown in Fig. 6, it is clear that the observed gas permeance and CO2/CH4 permselectivity are lower than those determined by pure gas per-meation test shown inFig. 5. We were able to form a membrane with gas permeance of 6.3 GPU and CO2/CH4permselectivity of 18.3 as well as another membrane with gas permeance of 286 GPU and CO2/CH4 permselectivity of 2.6. Fig. 6 shows a significant improvement in the performance of semi-IPN PEI–BMI membranes over PEI membranes without BMI for gas mixtures.
3.2.3. Case study for CO2/CH4separation using four semi-IPN PEI–BMI membranes
Four semi-IPN PEI–BMI membranes: s2, s3, s4and s10were selected for further studies. The subscript indicates the sample numbers shown inTable 2. The impact of pure CO2feed pressure on the plasticization of these membranes and the effects of CO2 concentration of the feed gas mixtures on the membrane perfor-mance were investigated. Pure CO2permeances through these four membranes at different feed pressure are shown inFig. 7. It is clear that there was no change in the CO2permeance up to pressures of 1400 kPa for all four membranes. Therefore, one could conclude that the increase in the pressure up to 1400 kPa
Fig. 6. Trade-off curve plot of permeance of the mixture of CO2and CH4vs. CO2/CH4permselectivity based on the permeation of gas mixture containing 26.5% (v/v) CO2and 73.5% (v/v) CH4. Filled square symbols are for PEI mem-branes without BMI. Labels correspond to the sample number listed inTable 2. did not plasticize these membranes according to the literature reported[25]definition of plasticization. These results are dif-ferent from plasticization of thin-film glassy polymers that has been reported and discussed elsewhere[26]. However, when a mixture of CO2and CH4is used, the gas permeance decreases slightly with the increase in the CO2concentrations in the feed gas mixture as shown inFig. 8. The decrease in the CO2 perme-ance by increasing CO2concentrations in the feed gas mixture was also observed by others[27–29]. As the feed pressure is con-stant at 827 kPa (120 psig) the slight decrease in the permeance might be attributed to the CO2adsorption coverage as illustrated elsewhere[27].
The driving force for permeating a gas from a mixture through a membrane is usually represented by the difference in the par-tial pressure of this gas between permeate and feed sides.Fig. 9 shows that with an increase in the CO2feed concentration the
Fig. 7. Permeance of pure CO2at different feed pressures for different semi-IPN membranes.
Fig. 8. Total gas permeance of CO2and CH4mixture at different feed concen-trations.
partial pressure differences increases for CO2while decreases for CH4. All four semi-IPN PEI–BMI membranes have approxi-mately the same linear correlation between the CO2feed concen-tration and the permeation driving force. On one hand, increasing the permeation driving force of CO2 leads to an increase in the permeation rate of CO2 and on the other hand, decreas-ing the permeation drivdecreas-ing force of CH4leads to a decrease in the permeation rate of CH4and therefore improved CO2/CH4 permselectivity. The phenomenon of increasing the productivity of the more permeable gas (i.e. CO2) upon increasing its driving force through the membrane was reported by Ismail and Yaa-cob[30], however, they did not refer to the simultaneous change in the driving force of other gases in the mixture. It is worth noting that the driving forces for CO2and CH4become equal when the concentration in the feed mixture is around 55% (v/v) of CO2 gas. Therefore, a 50% concentration of each gas in a binary mixture does not necessarily lead to equal driving forces
Fig. 9. Partial pressure differences (driving force) for CO2and CH4at different feed concentrations.
Fig. 10. CO2concentration of permeate gas mixture of CO2and CH4at different feed concentrations.
for both gases. Also at CO2feed concentration lower than 20% (v/v), the higher driving force for CH4than that for CO2might lead to CH4flux that is higher than CO2flux through the mem-brane. This was due to a CO2permeate concentration of lower than 50%. In all cases, the CO2 permeance is always greater than CH4permeance and the CO2concentration in permeate is always higher than that in the feed.
The influence of CO2feed concentration in CO2 and CH4 mixture on the permeate composition is illustrated in Fig. 10. With increasing CO2feed concentration, the rate of increase of CO2concentration in the permeate is higher for s2and s3 mem-branes and their curves show a plateau at CO2feed concentration of greater than 40% (v/v) compared to s4 and s10 membranes that have lower rate and their curves show a plateau at CO2 feed concentration of greater than 80% (v/v). This plateau in curves means that the partial pressure of gases in the permeate side becomes approximately constant while there is still room to increase the partial pressure of CO2and decrease the partial pressure of CH4on the feed side. For this reason and as shown inFig. 9, there is no observed plateau for the partial pressure differences of CH4while the plateau for CO2 appears at CO2 feed concentration that is higher than 85% (v/v). The plateau for CH4, shown inFig. 9, appears at CO2feed concentrations of lower than 15% (v/v).
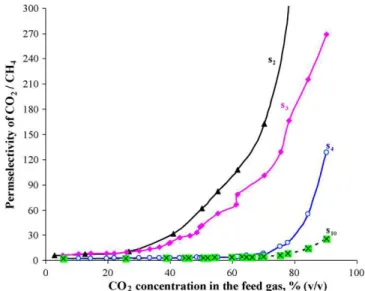
The influence of CO2feed concentration on CO2/CH4 perms-electivity for a mixture is illustrated inFig. 11. It is clear that the CO2/CH4permselectivity starts to increase significantly at CO2 feed concentration of greater than 40% (v/v) for s2 and s3 membranes and at concentration of greater than 80% (v/v) for s4 and s10 membranes. These concentrations are the same where the plateau starts as shown inFig. 10. The increase in the CO2/CH4permselectivity is attributed to the increase in the permeation driving force of CO2and the decrease in the driv-ing force of CH4through the membranes. The phenomenon of increasing the permselectivity upon increasing the concentration of more permeable gas (i.e. CO2) in the feed was also observed and discussed elsewhere[31,32].
Fig. 11. Permselectivity of CO2over CH4at different CO2feed concentrations. The CO2/CH4 permselectivity and permeance of CO2 and CH4mixture was plotted inFig. 12. Larger symbols represent the values that are determined from permeation of corresponding pure gases. For s2and s3membranes, there was no significant change in the gas permeance while the CO2/CH4permselectivity increased with increasing CO2feed concentration. Permeation data of pure gases show a higher permeance and CO2/CH4 permselectivity than those observed for CO2and CH4mixture at lower CO2feed concentrations (less than 40% (v/v)). For s4and s10 membranes, the gas permeance decreases with increasing CO2feed concentration and then becomes constant. Permeation data of pure gases show greater permeance than those observed for CO2and CH4mixture with a difference greater than that for s2and s3membranes. The CO2/CH4 permselectivity starts to increase significantly at a higher CO2feed concentration for s4 and s10 membranes compared to s2and s3membranes. These results confirm that the change in CO2feed concentration has greater influence on the CO2/CH4permselectivity for s2and s3
Fig. 12. Permselectivity of CO2over CH4vs. gas permeance at different CO2 feed concentrations.
Fig. 13. Trade-off curve plot of CO2permeance and CO2/N2permselectivity based on the permeation of pure gases. Filled square symbol is for PEI mem-branes without BMI. Labels correspond to the sample number listed inTable 2. membranes than those for s4and s10membranes while it has a greater influence on the gas permeance for s4and s10membranes than those for s2and s3membranes. Dhingra[28]reported that the change in CO2feed concentration in CO2and CH4mixture has an influence on gas transport characteristics for glassy poly-mers but not for rubbery polypoly-mers. Although performance of s4and s10membranes is controlled by the gas transport charac-teristics of silicon rubber, the performance of these membranes is not independent of CO2 feed concentration as reported by Dhingra[28]. It appears that the behavior of silicon rubber as an ultra-thin film or when it is inside a confined space (nanoscale free volume in the glassy polymer) is different from the behavior of thick film of silicon rubber.
3.2.4. CO2/N2separation
The trade-off curve of CO2permeance versus CO2/N2 perms-electivity based on permeation of pure gases is shown inFig. 13. The observations inFig. 13are similar to that found inFig. 5for CO2/CH4separation. By selecting suitable membrane prepara-tion procedures and condiprepara-tions, it is possible to have a semi-IPN PEI–BMI membrane with CO2permeance of 52 GPU and CO2/N2ideal permselectivity of 26 or a membrane with CO2 permeance of 392.7 GPU and CO2/N2ideal permselectivity of 13.4. It is clear that there is a significant increase in gas per-meance through semi-IPN PEI–BMI membranes compared to PEI membrane without BMI. The silicon rubber shows an ideal CO2/N2permselectivity of 13.0 as found elsewhere[20]. There-fore decreasing the gas transport resistance of the supported membrane and avoiding large defects could greatly improve the membrane productivity at this CO2/N2permselectivity for sili-con rubber.
Fig. 14 shows the influence of CO2 feed concentration in CO2and N2mixture on the CO2/N2permselectivity for s3and s4membranes. It is clear that the CO2/N2permselectivity starts to increase significantly at CO2feed concentration of greater than 37% (v/v) for s3membrane while a slight increase up to
Fig. 14. Permselectivity of CO2over N2at different CO2feed concentrations. 45% for s4membrane. The behavior of these two membranes for CO2/N2separation is similar for CO2/CH4separation as shown inFig. 11.
The performance of s3and s4membranes for separation of CO2and N2mixture is shown inFig. 15. The observations were similar to earlier discussion on CO2and CH4mixtures. However, s4membrane does not show a decrease in the gas permeance at low CO2 feed concentration when CH4is used instead of N2 (seeFig. 12). This might be due to different interactions of CH4 with membrane materials or with CO2compared to N2gas. The increase of CO2/N2or CO2/CH4permselectivity with increas-ing CO2feed concentration has a great economic benefit as it is possible to arrange the separation process at different stages where the higher permselectivity can be exploited to achieve an improved overall efficiency. The arrangement of separation pro-cesses becomes more flexible and efficient with having two types of membranes such as high permeance s4and s10 membranes and high permselectivity s2 and s3membranes. It is clear that
Fig. 15. Permselectivity of CO2over N2versus gas permeance at different CO2 feed concentrations.
these membranes made from the novel semi-IPN PEI–BMI show promising results to separate CO2from natural gas or flue gas as an important step to control the emission of greenhouse gases.
4. Conclusion
It was possible to prepare semi-IPN PEI–BMI membranes that have a higher performance for gas separations than PEI membranes. Membrane morphology for the skin and the sup-ported layer is greatly influenced by preparation procedures and conditions that usually led to different distributions of the free volume in the produced membranes at scales ranging from molecular dimensions to micrometer. Regardless of membrane materials, changing membrane morphology especially for the skin layer or the supported layer, it was possible to produce membranes with a high gas permeance but a low permselectivity or membranes with a high permselectivity but a low gas perme-ance. Using cast solution containing 19.5% (w/w) of PEI and BMI polymers, it was possible to decrease significantly the gas transport resistance of the supported membrane layer but it was difficult to obtain improved skin integrity, which is responsible for high permselectivity. On the other hand, using cast solution containing 25% (w/w) or more of PEI and BMI polymers, it is possible to obtain improved skin integrity with a high permselec-tivity but the supported membrane layer becomes more resistant to gas transport. Using these two types of membranes, one could develop new processes with multiple separation stages to obtain a cost-efficient separation system.
Semi-IPN PEI–BMI membranes were not plasticized by increasing the feed pressure of pure CO2up to 1400 kPa. How-ever, CO2 feed concentration had a significant influence on separation of CO2 and CH4 or CO2 and N2 mixtures. It was concluded that there would be a slight decrease in the gas per-meance with increasing CO2 feed concentration. The driving force represented by the difference in the partial pressure for each gas in a binary mixture was found to have a nearly linear correlation with CO2feed concentration. At low CO2feed con-centration, the driving force for CH4was higher than that for CO2but the permeance of CO2was higher than the permeance of CH4, which always led to a higher CO2concentration in the permeate side than that in the feed side.
Using our semi-IPN PEI–BMI membranes, the increase of CO2/N2or CO2/CH4permselectivity with increasing CO2feed concentration might be economically exploited to arrange more cost-efficient separation systems to capture CO2from natural gas or flue gas. It is also possible to use these membranes for pro-duction of O2-enriched air or separation of various other gases.
Acknowledgement
The authors are thankful to Mr. David Kingston for his help with SEM experiments.
References
[1] Technical report, Fueling the future: natural gas and new technologies for a cleaner 21st century, Washington Policy and Analysis Inc., Washington, DC, February 2000.
[2] D. Paul, S.K. Sikdar, Clean Production with Membrane Technology, Clean Products and Processes, vol. 1, Springer-Verlag, New York, 1998, pp. 39–48.
[3] G.C. Kapantaidakis, G.H. Koops, High flux polyethersulfone–polyimide blend hollow fiber membranes for gas separation, J. Membr. Sci. 204 (2002) 153–171.
[4] W.J. Koros, R. Mahajan, Pushing the limits on possibilities for large scale gas separation: which strategies, J. Membr. Sci. 175 (2000) 181– 196.
[5] G. Schmidt, M.M. Malwitz, Properties of polymer–nanoparticle compos-ites, Curr. Opin. Colloid Interf. Sci. 8 (2003) 103–108.
[6] S. Kulprathipanja, J. Charoenphol, Mixed matrix membrane for separation of gases, US Patent 6,726,744 (2004).
[7] S. Kulprathipanja, S.S. Kulkarni, Separation of polar gases from non-polar gases, US Patent 4,608,060 (1986).
[8] T.C. Merkel, B.D. Freeman, R.J. Spontak, Z. He, I. Pinnau, P. Meakin, A.J. Hill, Ultrapermeable, reverse-selective nanocomposite membranes, Science 296 (2002) 519–522.
[9] S.Z. Jakabhazy, L.J. Zeman, Microporous polymeric membrane, US Patent 4,302,334 (1981).
[10] R.W. Baker, Future directions of membrane gas separation technology, Ind. Eng. Chem. Res. 41 (2002) 1393–1411.
[11] J. Kurdi, A. Kumar, Structuring and characterization of a novel highly microporous PEI/BMI semi-interpenetrating polymer network, Polymer 46 (2005) 6910–6922.
[12] J. Kurdi, A. Kumar, Synthesis and characterization of modified bismaleimide–polysulfone semi-interpenetrating polymer networks, J. Appl. Polym. Sci., in press.
[13] J. Kurdi, A. Kumar, Formation and thermal stability of BMI-based inter-penetrating polymers for gas separation membranes, J. Membr. Sci. 280 (2006) 234–244.
[14] P.O. Tawney, R.H. Snyder, R.P. Conger, K.A. Leibbrand, C.H. Stiteler, A.R. Williams, The chemistry of maleimide and its derivatives. II. Maleimide and N-methylolmaleimide, J. Org. Chem. 26 (1961) 15–21.
[15] D.W. Wallace, C. Staudt-Bickel, W.J. Koros, Efficient development of effective hollow fiber membranes for gas separations from novel polymers, J. Membr. Sci. 278 (2006) 92–104.
[16] A.F. Ismail, A.R. Hassan, Formation and characterization of asymmetric nanofiltration membrane: effect of shear rate and polymer concentration, J. Membr. Sci. 270 (2006) 57–72.
[17] J.-J. Qin, T.-S. Chung, C. Cao, R.H. Vora, Effect of temperature on intrin-sic permeation properties of 6FDA-durene/1,3-phenylenediamine (mPDA) copolyimide and fabrication of its hollow fiber membranes for CO2/CH4 separation, J. Membr. Sci. 250 (2005) 95–103.
[18] R.-C. Ruaan, T. Chang, D.-M. Wang, Selection criteria for solvent and coagulation medium in view of macrovoid formation in the wet phase inversion process, J. Polym. Sci. B: Polym. Phys. 37 (1999) 1495– 1502.
[19] D. Silvestri, N. Barbani, G. Ciardelli, C. Cristallini, P. Giusti, Designing porous bioartificial membranes for clinical use with desired morphological and transport properties by phase inversion control, J. Appl. Biomater. Biomech. 3 (2005) 83–92.
[20] L.M. Robeson, Polymer membranes for gas separation, Curr. Opin. Solid State Mater. Sci. 4 (1999) 549–552.
[21] A.F. Ismail, R. Norida, A.R. Sunarti, Latest development on the membrane formation for gas separation, Songklanakarin, J. Sci. Technol. 24 (Suppl.) (2002) 1025–1043.
[22] J. Ren, T.-S. Chung, D. Li, R. Wang, Y. Liu, Development of asym-metric 6FDA-2,6 DAT hollow fiber membranes for CO2/CH4separation. I. The influence of dope composition and rheology on membrane mor-phology and separation performance, J. Membr. Sci. 207 (2002) 227– 240.
[23] T.-S. Chung, S.K. Teoh, W.W.Y. Lau, M.P. Srinivasan, Effect of shear stress within the spinneret on hollow fiber membrane morphology and separation performance, Ind. Eng. Chem. Res. 37 (1998) 3930–3938.
[24] T. Visser, G.H. Koops, M. Wessling, On the subtle balance between com-petitive sorption and plasticization effects in asymmetric hollow fiber gas separation membranes, J. Membr. Sci. 252 (2005) 265–277.
[25] A. Bos, I.G.M. Punt, M. Wessling, H. Strathmann, CO2-induced plasticiza-tion phenomena in glassy polymers, J. Membr. Sci. 155 (1999) 67–78. [26] M. Wessling, M.L. Lopez, H. Strathmann, Accelerated plasticization of
thin-film composite membranes used in gas separation, Sep. Purif. Technol. 24 (2001) 223–233.
[27] S. Li, J.G. Martinek, J.L. Falconer, R.D. Noble, T.Q. Gardner, High-pressure CO2/CH4 separation using SAPO-34 membranes, Ind. Eng. Chem. Res. 44 (2005) 3220–3228.
[28] S.S. Dhingra, Mixed gas transport study through polymeric membranes: a novel technique, PhD Thesis, Department of Chemical Engineer-ing, Virginia Polytechnic Institute and State University, USA, 1997, p. 146.
[29] G. Xomeritakis, C.-Y. Tsai, C.J. Brinker, Microporous sol–gel derived aminosilicate membrane for enhanced carbon dioxide separation, Sep. Purif. Technol. 42 (2005) 249–257.
[30] A.F. Ismail, N. Yaacob, Performance of treated and untreated asymmetric polysulfone hollow fiber membrane in series and cascade module config-urations for CO2/CH4gas separation system, J. Membr. Sci. (2005) (on line).
[31] L.J.P. van den Broeke, W.J.W. Bakker, F. Kapteijn, J.A. Moulijn, Binary permeation through a silicalite-1 membrane, AIChE J. 45 (1999) 976–985. [32] M. Ogawa, Y. Nakano, Separation of CO2/CH4 mixture through car-bonized membrane prepared by gel modification, J. Membr. Sci. 173 (2000) 123–132.