HAL Id: hal-02886061
https://hal-amu.archives-ouvertes.fr/hal-02886061
Submitted on 1 Jul 2020HAL is a multi-disciplinary open access archive for the deposit and dissemination of sci-entific research documents, whether they are pub-lished or not. The documents may come from teaching and research institutions in France or abroad, or from public or private research centers.
L’archive ouverte pluridisciplinaire HAL, est destinée au dépôt et à la diffusion de documents scientifiques de niveau recherche, publiés ou non, émanant des établissements d’enseignement et de recherche français ou étrangers, des laboratoires publics ou privés.
Rapid on site assessment of a compost chemical stability
parameter by UV and fluorescence spectroscopy coupled
with mathematical treatment
Abaker Madi Guirema, Raynaud Michel, Théraulaz Frédéric, Pascale Prudent,
Redon Roland, Domeizel Mariane, Martino Christian, Mounier Stéphane
To cite this version:
Abaker Madi Guirema, Raynaud Michel, Théraulaz Frédéric, Pascale Prudent, Redon Roland, et al.. Rapid on site assessment of a compost chemical stability parameter by UV and fluorescence spectroscopy coupled with mathematical treatment. Waste Management, Elsevier, 2020, 113, pp.413-421. �10.1016/j.wasman.2020.06.024�. �hal-02886061�
Title: Rapid on site assessment of a compost chemical stability parameter by UV and
fluorescence spectroscopy coupled with mathematical treatment
Authors:
Abaker Madi Guirema1,2,3, Raynaud Michel1, Théraulaz Frédéric*2, Prudent Pascale2, Redon Roland1, Domeizel Mariane2, Martino Christian1, Mounier Stéphane1
Address:
1
Univ Toulon, Aix Marseille Univ, CNRS/INSU, IRD, MIO UM 110, Mediterranean Institute of Oceanography, CS 60584, 83041 – Toulon, France.
2
Aix Marseille Univ, CNRS, LCE UMR 7376, 13331 Marseille, France.
3
Université des Sciences et Techniques de Masuku, Franceville, Gabon
Abstract:
Sewage sludges are problematic due to the constant increase of urban population. The high level of organic matter in sludges can be valorized by co-composting with green waste. Many chemical changes occur in the compost maturation process, resulting on stabilized organic matter by humification which is recoverable as soil amendment. In this way, the knowledge of organic matter stability and maturity of compost is essential. However, estimation of chemical parameters allowing the management of compost quality usually need complex time consuming laboratory measurements. Indeed, there is not yet rapid, simple and robust method for their on site assessment at the moment. Among usual parameters used to monitor compost evolution, the C/N
ratio is a fundamental chemical parameter. The aim of this work is the estimation of the C/N ratio using a Partial Least Squares regression based on UV and fluorescence spectroscopic data and pH
from compost water extracts at various steps of composting process and measured on site. A mathematical linear model is established based on selected data (pH, spectroscopic indices) resulting on average relative error for C/N estimation of 5.26 % (range between 0.5 % min. and 9.5 % max.). This tool leads to a rapid and simple on site estimation of the compost stabilization, allowing qualification of the end-product resulting on a global spectroscopic index of stability.
*Corresponding author: Tel.: +33(0)413551037; Fax: +33(0)413551060 E-mail address: frederic.theraulaz@univ-amu.fr
Keywords:
Partial Least Square regression; C/N ratio; spectroscopic indices; sewage sludge; water extracts; compost maturity
1. Introduction
The interest of composting is to reduce the volume of wastes, to kill pathogenic microorganisms and weed seeds (He et al., 1992; Bernal et al., 2009), in order to obtain a valuable product used for soil amendment. In this context of circular economy (Clark et al., 2016), it is important for producer to have a good knowledge on the production process and on the quality of the product and follow specific and rigorous laws in some countries (Maroušek et al., 2016). Among the different wastes used for composting (green waste (Khalil et al., 2008; Carmona et al., 2012), animal manures (Moral et al., 2009; Young et al., 2016), municipal solid wastes (Chefetz et al.,
1996; Li et al., 2014)), sewage sludges present a great interest due to their important biodegradable fraction (Nafez et al., 2015; Fytili and Zabanietou, 2008).
Nowadays, it is necessary to measure a great number of physico-chemical (pH, temperature redox potential, carbon nitrogen ratio C/N) and biological (respirometric test, phytotoxicity test) parameters in order to monitor the compost evolution. Some of these measurements are expensive, time consuming (more particularly biological tests), and are rarely done directly on the composting platforms, but in laboratories requesting overtime. Among these parameters, today, production process is followed by regular temperature monitoring, and sometimes humidity and more rarely final chemical characterizations. The most used to decide the end of processing, in order to confirm the commercial conformity of the compost, are the microbiological respiration and germination test, and especially the C/N ratio (Martin-Ramos and Martin-Gil, 2020; Khalil, 2005), which is an important and lawful physico-chemical parameter to assess the organic matter stabilization and humification process.
Concerning analytical aspect for the characterization of the composts maturity or stability, a large literature exists based on various techniques: Fourier-transform infrared spectroscopy (Carballo et al., 2008; Droussi et al., 2009; El Ouaqoudi et al., 2015), UV-Visible spectroscopy (Domeizel et al, 2004; Zhang et al., 2011; Mouloubou et al., 2016), fluorescence spectroscopy (Provenzano et al., 2001, 2016; Wei et al., 2016; Zhang et al., 2016; Fuentes et al., 2006), NMR (Nuclear magnetic resonance, Zbytniewski and Buszewski, 2005; Cozzolino et al., 2016) but few take into account the whole production process or the rapidity and feasibility on site of the measurement. Among these analytical techniques to characterize and follow the evolution of organic matter in aqueous fraction in its whole, the use of fluorescence spectroscopy (Green and Blough, 1994; Sierra et al., 1994) and UV-Visible absorbance (Chen et al, 1977; Sellami et al, 2008)), are proven methods. They allow to define what types of organic matter are contained in a sample
using absorption indices and excitation emission localization of fluorophores, for monitoring pollution in rivers, sea water (Zhao, 2011; Coble, 1996) among others, for water quality (Hudson et al., 2007) and control of wastewater treatment processes (Reynolds and Ahmad, 1997).
In this work, the interest is focus on organic matter state in the compost. The intensity of fluorescence can thus be used to evaluate the maturity of the compost (Henderson et al., 2009; Moral et al., 2009), especially thanks to its high instrumental sensitivity compared to other available approaches (Marhuenda-Egea et al., 2007; Provenzano et al., 2001, 2016; Wei et al., 2016; Zhang et al., 2016). In this context, fluorescence excitation-emission matrices (EEM) are used to study organic compounds that exhibit fluorescence characteristics of humic, fulvic and protein type (Marhuenda-Egea et al., 2007; Tian et al., 2012; Chen et al., 2003). Moreover, Stedmon et al. (2003) applied canonical polyadic parallel factor analysis (CP/PARAFAC) on EEMs to analyze natural organic matter (NOM) and thus monitored its production and degradation in the environment. The application of CP/PARAFAC has gained momentum in environmental research on organic matter (Mounier and Redon, 2018). PARAFAC analysis can break down EEMs into different groups of components and provide a solution to study all the data that constitute these EEMs (Santín et al., 2009; Bro and Vidal, 2011; Zhao, 2011; He et al., 2013).
According to our knowledge, there is not overall operational criteria for to monitor easily on site composting process and to define stability and maturity of composts. The objective of this work was to monitor the C/N value of solid compost samples (TOC/TKN) using several spectroscopic indexes integrated into a numerical model. This tool could be used on site in order to follow the evolution of compost and estimate its stabilization during the maturation phase, allowing the qualification of the end-product, resulting on a global spectroscopic index of stability. Performing
rapid on site analyzes provides guidance during the composting process allowing the platform to optimize composting process, space use and quality of products.
2. Materials and methods
2.1 Experimental materials
The composting platform Biotechna is located at Ensuès-la-Redonne (Bouches-du-Rhône, France). Its activity is directed towards the co-composting of sludge sewage treatment plants called MIATE (materials of agronomic interest derived from water treatment), suitable for use in agriculture (Ministerial Decree of 8 January 1998), mixed with green waste (Article L 255-2 of the Rural Code). After mixing green waste and sludge (2:1 v/v), the MIATE remained in an alveolus about twenty days, and were brewed about every 3 days, the compost was then stored outdoor for maturation during at least 4 months before valorization.
2.1.1 Compost sampling
MIATE were put initially in an alveolus where the stage of bio-oxidation of the organic matter started. The 1st sample (T0) was performed the first day. After this, seven samples were made weekly (T1 (8 days old) to T7 (51 days old)). Then, samples were performed every two weeks until T9 (81 days old). Sampling campaign lasted in total six months, from April to September 2014. Sampling was done on the swath. Four parts (2 kg each) were sampled in different places at 80 cm depth. Samples were then mixed and subsampled using the quartering protocol to get a final representative composite sample of 2 kg (NFU-44-101).
2.1.2 Water extraction of samples and physico-chemical analyses
A homemade high pressure (4 bars) room temperature water extraction device (based on a modified commercial coffee maker) was used for water extraction of the compost (Supplementary Information 1 (SI.1)). Ten grams of fresh compost were introduced and 400 mL of water Milli-Q (C.E.: 18 M.Ω.cm at 25 °C) were passed by batches of 100 mL. The last batch was gathered for analysis. These fourth extractions were chosen because they allow to have an entirely wet sample and an organic matter concentration adapted to the following spectroscopy measurements. The determination of the compost aqueous extraction pH was accomplished according to standard method (NF ISO 10390, in 2005, 1:5 solid (w)/water (v) ratio) with a pH meter equipped with a standard glass electrode (Orion 2 Thermo Fisher).
2.2 UV-Visible and fluorescence spectroscopy
After water extraction of fresh composts, the sample suffer a filtration using 0.45 µm cellulose nitrate membranes. SUVA254, E2/E3, E4/E6 and EET/EBZ index (Mouloubou et al., 2016) were
obtained using a double beam SHIMADZU UV1800 spectrophotometer with quartz cells (path length of 1 cm) and water Milli-Q as reference. Fluorescence measurements were obtained on this filtered sample using a Hitachi FL4500 spectrofluorometer (Hitachi, Tokyo) in scan mode. Emission spectra from 200 to 800 nm were obtained at a scan speed, 2400 nm min-1, using 5 nm excitation and emission slits bandwidths, by scanning the excitation wavelength from 200 to 600 nm at 5 nm increments. The integration response was set at 0.1 s and photomultiplier voltage fixed at 700V. The matrices were extracted with FL-Winlab software from HITACHI with 5 nm step for both excitation and emission and treated by the progMEEF program developed by Redon R. of the Laboratory PROTEE which works on MATLAB 2015
(https://colloques.univ-tln.fr/Colloques/RegistrationPROGMEEF.jsp). This software is based on algorithm CP/ PARAFAC (Luciani et al., 2008; Stedmon and Bro, 2008), and it has been used to decompose set of excitation-emission matrices (EEM) in independent components which makes easier identification and quantification (Murphy et al., 2013). The Kalbitz (Kalbitz et al., 1999), Milori (Milori et al., 2002) and Zsolnay (Zsolnay et al., 1999) fluorescence index were obtained following previous works.
2.3 Organic Carbon and Nitrogen measurement
Determination of dissolved organic carbon (DOC) concentration was made by subtracting inorganic carbon (IC) to total carbon (TC) using a total organic carbon analyzer which uses the principle of high temperature catalytic combustion (TOCV-Shimadzu) (ISO 20236). TC is measured by injecting a known volume of sample in a 750°C furnace under oxygen flux (160 L.min-1). The CO2(g) is driven by the oxygen stream to a non-dispersive infrared detection cell
(NDIR) previously calibrated with a solution of potassium hydrogen phtalate (C8H5KO4). The
total organic carbon of the dry compost (TCs) was measured using an N/C 2100 S (Analytik Jena) TC meter with the solid module. First, for solid TCs, the sample (200 mg) is fed into an oven heated to 950°C under an oxygen stream. Calibration is done using calcium carbonate (CaCO3) 12% carbon. The second step is the measurement of solid inorganic carbon (IC module).
The sample is brought into contact with phosphoric acid 40-45% (2 mL) and heated to 80°C under agitation at 500 rpm. The CO2 emitted from solid inorganic carbon (ICs) is quantified by a
NDIR detector calibrated with CaCO3. The TOC is obtained by distinguishing between total
Total Kjeldahl Nitrogen (TKN) was measured on dry compost samples (ISO 11261). In a Kjeldahl matras, 0.5 g of compost sample was introduced, to which we added 2 g of potassium sulphate (K2SO4), 2 g of copper sulphate (II) mineralization catalyst (CuSO4, 5H2O) and 0.1 g of
selenium (Se) (w/w/w: 20/20/1), and finally 10 mL of concentrated sulphuric acid (H2SO4). The
matras were placed in the digester (TKN SpeedDigester) and heated for 4 hours. Kjeldahl matras containing greenish mineralisat were placed on the Büchi B-323 distillation apparatus. A beaker with 50 mL of 0.05 M sulphuric acid (special nitrogen) was placed to harvest the distillate. The following steps take place automatically in the device. Osmosis water (30 mL) was added to the sample to remove all the pellet at the bottom of the matrix, then 60 mL of NaOH 32% is added. The distillation lasts 7 min. After distillation, the distillate-sulphuric acid mixture was titrated by a 0.1 M NaOH solution with an automatic titroline. The C/N atomic ratio of the solid is calculated from TOC (mg of C.kg-1) and TKN (mg of N.kg-1) measurement using the molar mass of carbon and nitrogen.
3. Mathematical treatment and model: PLS regression for C/N (TOC/TKN) prediction of
MIATE compost
In this part, we assume that the C/N ratio only depends on the linear combination of some measured parameters. But, the matrices of measurements generally comprise a smaller number of samples than of measured parameters, some of which are highly correlated with each other (emission spectra with neighboring wavelengths and CP/PARAFAC components mainly). A classical linear regression model using matrix inversion, which in our case is poorly conditioned, is not suitable for this type of problem. Indeed, the matrix inversion generates very large errors making the process unclear or even unusable. This is why Partial Least Square (PLS) regression
model was used as it deals with this type of matrices. Indeed, PLS regression is based on an iterative robust algorithm and the optimal number of iterations to obtain results is determined by a simple test.
There are several types of PLS regression depending on the prediction of one or more variables to explain (Wold, 1975; Wold et al, 1984; Geladi and Kowalski, 1986; Frank, 1993; Tenenhaus, 1998). We use in this first work the PLS1 regression to model and to predict a single variable, C/N ratio, which is a well-used physico-chemical parameter to monitor organic matter stabilization and decide the end of processing (Khalil., 2005), well correlated to organic content of samples and their spectroscopic properties.
3.1. Matricial PLS1 resolution
In this work, a part of the PLS1 regression is presented in an original matrix form. PLS1 is based on a supposed linear relation between two sets of data (linked to n samples) which are contained in two matrices called X (matrix of predictor variables) and Y (matrix of response variables). The i-th row of X corresponds to the i-th sample defined by p variables and the i-th sample is characterized by the i-th response variable yi of Y.
We have the matrix where xj is the j-th column vector of matrix X and the matrix where represents the transpose of matrix Y. In the following part, it is assumed that there is not missing data. The matrices X and Y are mean-centered.
The main goal of PLS1 regression is the calculation of the matrix B which defines the linear relation between X and Y:
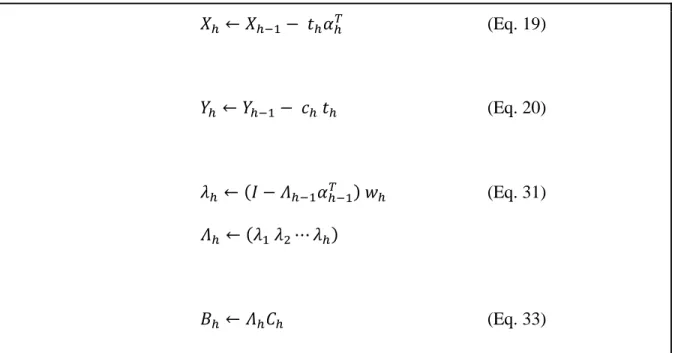
(1) In order to obtain the matrix B, the algorithm of PLS1 regression uses an iterative procedure whose steps are described in Supplementary Information 2 (SI.2). On this base, the algorithm of PLS1 regression could be written using only some equations, with H the iteration number described below where new notation is proposed on the three last equations (see Fig. 1).
(Eq. 18) (Eq. 17) (Eq. 21) (Eq. 22)
(Eq. 19)
(Eq. 20)
(Eq. 31)
(Eq. 33)
Fig. 1. Algorithm of the PLS1 in matrix notation. Equations 31 to 33 are original notations
3.2. Rank of linear model
The parameter H corresponds to the rank of linear model, so H is lower than or equal to the number of variables p defining each sample since several columns of matrix X can be partially correlated. This information is a priori unknown. An approach to determine the rank H consists of calculation of Predicted REsidual Sum of Squares for the iteration h (PRESSh) defined by the
following expression:
(34)
The variable represents the j-th component of the predicted variable obtained after h iterations of PLS1 regression applied on matrices X and Y whose j-th row is removed: in other words, the matrix Bh is estimated without knowledge of the j-th sample. The linear model is
iterations h exceeds the rank of linear model, and the prediction error PRESSh increases.
Therefore, the rank H is the maximum value of h associated to the minimum of PRESSh.
The optimum value of h can be determined by calculating using SIMCA-P procedure (Tenenhaus, 1998) where RSSh-1 = is the residual
sum of squares calculated with the h-1 component model.
4. Results and discussion
Principal Component Analysis (PCA) applied to measured and calculated parameters (pH, spectroscopic indices, PARAFAC components) allows to select relevant parameters for the proposed linear model. After identification of possible outliers, a comparison of the average relative error between the slow and fast parameters is completed.
4.1. Fluorescence decomposition by PARAFAC
The CP/PARAFAC model of the fresh compost water extraction EEM gives 2 components with a CORCONDIA equal to 99.85%. Component 1 (C1) has a maximum fluorescence intensity for the 330/425 nm pair (λEx/λEm) corresponding to humic-like "visible" fluorophore C (Coble, 1996;
Parlanti et al., 2000) or to fulvic-like substances (Baker, 2001, 2002; Berkovic et al., 2013; Wang et al., 2007). Indeed, Berkovic et al. (2013) studied various IHSS reference fulvic acids and observed, in fluorescence, a peak at 320-340/410-430 (Ex/Em). For component 2 (C2), we observe two peaks: the pair couple of wavelengths 260/475 nm usually corresponds to fluorophore A of the like" (Coble, 1996) and 390/475 nm corresponding, also, to
"humic-like" substances (Baker, 2002). Contribution of these two components could be used as proxy of the “fulvic” and “humic” like molecules in the prediction model of compost stabilization.
4.2. Parameters for compost process monitoring
Samples pH varied between 7 to 9 as seen in Supplementary Information 3 (SI.3). It rises from 7.6 (initial data) to 8.8 in day 22 and decreases until 7.6. The small fall at day 15 could be due to volatile fatty acid production (data not shown). This could happen when anoxic conditions occur during compost progression (Sundberg, 2004). Anyway the decrease of pH after the thermophilic period is due to the formation of carboxylic acid.
Absorbance parameters like EBZ/EET, E4/E6 and E2/E3 shown contrasted behavior. E2/E3 is related
to aromaticity and did not vary sharply, 4 to 6 (SI.3) during the composting process compared to similar works in literature, 3 to 18 (Soriano-Disla et al., 2010). The downward trend during the thermophilic phase is coherent with Ilani (2016), who described a lower value around 2. The E4/E6 index is related to size and conjugation. It stays constant until day 22 and increases after the
thermophilic period until value of 12 to finally decrease at the end of process (SI.3). This behavior was not really explained and to our knowledge no work describes the temporal variation of this index for a sewage compost process, but it seems coherent with previous work on sewage sludge mature compost (1.8 to 6.1, Soriano-Disla et al, 2010). EBZ/EET index linked to the
aromatic ring occurrence, was increasing until the end of the thermophilic and stay constant during the mesophilic one. SUVA254, which is a slow parameter due to the need of dissolved
organic carbon value in mg.L-1, behave like EBZ/EET index showing an increase of
Fluorescence indices presented variety of tendency. Like E2/E3 index, Kalbitz index is quite
constant except for high values for days 22 and 31. Zsolnay index shown a very high value at the first day and decreased rapidly under 1 until the last day, where it rose up to 2. The Milori indice, related to humification process, behaved like Kalbitz and increased until day 22 and stay constant during the mesophilic phase. This variation is coherent with the humification process leading to more and more complex and conjugated molecules. The C1 and C2 CP/PARAFAC components, are slow parameter as it needs all the EEM data, both shown an increased to a maximum at day 64. Four samples were not validated due to low fluorescence signal, but general variation was kept during the study. If the variation between C1 and C2 contribution seems to be similar, the C1/C2 ratio contribution shown a decrease from the beginning to the 22-th day and a slower increase after in the mesophilic phase. The component C2 is the most redshifted and represent more conjugated/humic like compound. The variation could be explained by a thermophilic phase recombining molecule in a more complex way, and a slow decomposition favoring the C1 component. Anyway the C1/C2 variation differs from the other index with a maximum or break at day 64 instead of day 22.
The atomic C/N variation of solid sample is decreasing monotonically from 16.3 to around 10 (SI.3). This matches with previous works even if some authors found increase (Doublet et al., 2011) or stability (Ilani et al., 2016) in particular conditions. No break was observed at day 22-th and day 64-th, or at the thermophilic / mesophilic frontiers like other parameters. Even if starting and ending point highly depend on the compost composition (Table 1), the decrease with time is often used as valuable stability parameter (Guo et al., 2012).
Compost Type Starting C/N Ending C/N Work Reference
Green Litter 28.7 19 Godden et al., 1986
Manure 18.9 9.21 Tang et al., 2006
Manure 31.0 25.0 Tang et al., 2006
Solid Municipal Waste
38 22-14 Raut et al., 2008
Green + Cattle 59 32 Goyal et al., 2005
Municipal Waste 29 12 Zmora et al., 2005
Cattle Manure 33 10.5 Zmora et al., 2005
Sewage – MIATE 23 11 Zmora et al., 2005
Urban Sewage 25 55 Doublet et al., 2011
All type - 8.75 <->19 Guo et al., 2012
4.3. Selection of the uncorrelated parameters
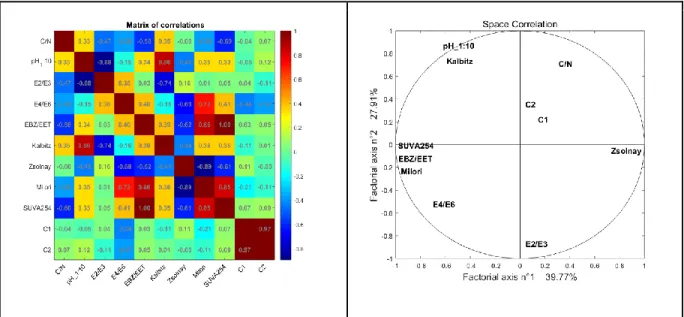
A first approach was made using PCA in order to know the links and similarities between the different variables. This study was performed on C/N, pH, E2/E3, E4/E6, EET/EBZ, Kalbitz, Zsolnay, SUVA254, Milori indices, and PARAFAC components C1, C2. The Figure 2 shows the correlation matrix and circle between all the parameters. It can be seen that the C/N ratio has no
marked correlations with all other parameters. However, a weak and negative correlation with EBZ/EET (-0.58) and with SUVA254 (-0.6) is observed. There are stronger correlations between, for example, EBZ / EET and Milori (0.86) or SUVA254 (0.99), which make it possible to expect that the results given by retaining only the fast components will be close to those obtained with all the fast and slow parameters. However, the components C1 and C2 are indeed highly correlated with each other but not correlated with the rest of the parameters which suggests that they are the ones who could provide the most additional information if they were retained. The correlation circle (Fig. 2) shows the correlations, even if the projection is based on an explained variance less than 70% for the two axis. The quality of the results does not allow us to make a meaningful classification or a prediction of the monitored parameter (C/N), but it gives information on the correlations between the parameters. Explanatory variables are highly correlated and the usefulness of the PLS regression is tested below.
Fig. 2. Correlation matrix and circle given by PCA analysis
The pH and spectroscopic measurements are recorded in an X matrix comprising n=10 rows, corresponding to the number of samples studied at different dates, and p equal to 6 and 10 columns related to the measurement parameters selected respectively immediate (pH, E2/E3,
E4/E6, EET/EBZ, Kalbitz, Zsolnay) and slow measurement (SUVA254, Milori, C1, C2). One
physical parameter was retained namely pH as it is a fast parameter. Among the spectroscopic index, E2/E3, E4/E6, Kalbitz, and Zsolnay were considered as fast as they need only absorbance or
fluorescence measurement. SUVA254, Milori, C1, C2 were considered as slow measurement as
they need organic carbon measurement for the two former, and total set of measurement and data treatment for the two later.
PLS1 is used to predict Y (i.e. C/N) as a function of chemical (pH) and spectroscopic measurements xj. To find the linear relationship between the variable to be estimated (C/N) and
the explanatory variables xj (j = 1,..., p), the fit accuracy was calculated.
To determine the linear relation calculated by the PLS1, the optimal number of iterations h is obtained by the calculation of PRESSh as previously described. After evaluation of model
precision and identification of possible outliers, we use the "one leave out" method, where the learning class is reduced to a single element, considering the low number of samples studied. In this calculation the regression PLS1 is carried out on n-1 rows of the matrix, after having removed a single row of this matrix, and this, for all the matrix rows.
The missing variable C/N was predicted using each (n-1) p matrices and compared to the measured value. This calculation was done for each iteration h of the PLS1 regression. At each iteration h, the value of PRESSh provides information on the accuracy of the estimator and the
mean of relative error between variable C/N and his estimator are calculated. The optimum value of h is equal to the number of iterations corresponding to the minimum value of mean relative
error calculated below. The Figure 3 shows the evolution of prediction with the value of PRESSh
as a function of the number of iterations h and the visualization of the errors for the C/N ratio estimation. At each iteration h, the relative error between the measured C/N ratio (y0) and its
estimator ( ) is also calculated, the relative error being equal to . The PRESSh
decreases as h increases to the rank of the matrix X and increases thereafter. The optimum value of h can be determined by the value of the coefficient or by the minimum of the mean value of the relative errors. As an example, Figure 3 shows the evolution of the PRESSh for the fast
parameters. The PRESSh is minimal for h = 7 with a value of 0.156 corresponding to the rank of
Fig. 3. Evolution of the PRESSh as a function of the number of iterations h and the
visualization of the errors for the C/N ratio estimation with fast parameters.
4.4.1. PLS with all the measured parameters
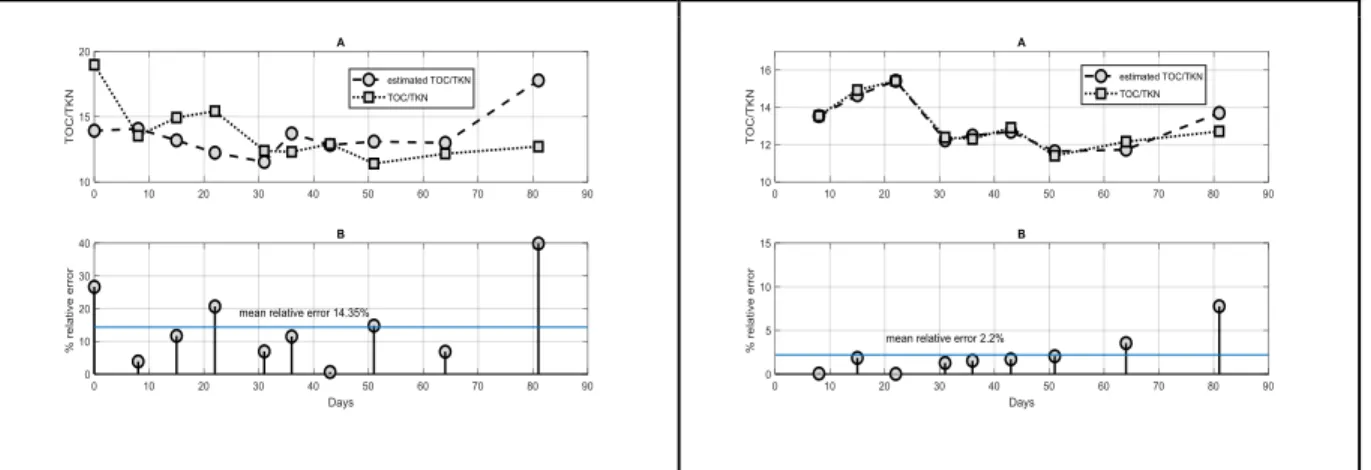
The measured parameters (slow and fast ones) were used to determine the best way to predict the TOC/TKN of the compost during the process. These parameters allow the prediction with an average relative error of 14.35 % (Fig. 4, graph B on the left). It was observed that the prediction without initial sample T0, the higher errors are located at the end of the experimentation (days 63 and 81) and average relative error is 2.20% (Fig. 4, graph B on the right). This is probably due to rapid and unequilibrated chemical composition of the MIATE compost at the very beginning of the process. For an accurate prediction, it seems that is it better to eliminate the T0 sample which does not seem to follow the proposed linear model.
Fig. 4. TOC/TKN ratio (dashed line) and its estimation (dotted line) using all the measured
parameters (A) and the relative error estimation (B)
In the way to investigate a rapid and field useful method, the only fast parameters were used to determine the best way to predict the TOC/TKN ratio (pH, E2/E3, E4/E6, EET/EBZ, Kalbitz,
Zsolnay). Average relative error for prediction with T0 sample (Fig. 5, graph B, on the left) and without T0 sample (Fig. 5, graph B, on the right) is 14.25 % and 5.26 % respectively are presented on Figure 5. The results show that by eliminating the T0 and using only fast parameters, the C/N prediction remains good. Moreover, the relative error at the end of the composting process, where the information is crucial for compost producers, is decreasing. Finally, we favored a small number of input parameters (fast parameters) to obtain an acceptable precision on the C/N ratio assessment (minor than 10%).
Fig. 5. TOC/TKN ratio (dashed line) and its estimation (dotted line) using fast measured
parameters (A) and the relative error estimation (B)
5. Coefficient values of prediction models
Two different models are established either on all parameters or on rapid parameters, with the use of all samples except initial one T0 as seen previously. To implement PLS1 in a predictive
model, it needs the coefficients of matrix B (eq. 1) associated to the measured parameters. Table 2 presents these coefficients estimated from all parameters and from only fast parameters.
Table 2: Values of coefficients for the PLS1 prediction using all the parameters (fast and slow)
and only the fast one
Parameters PLSAll PLSfast
pH 2.164 1.578 E2/E3 1.975 0.544 E4/E6 5.893 0.314 EET/EBZ -0.450 -7.397 Kalbitz -0.893 28.679 Zsolnay -33.653 1.937 SUVA254 -57.615 Milori -0.751 C1 -45.154 C2 6.655
The all parameter PLS1 calculations show C2, E4/E6, pH and E2/E3 positive contribution order
and negative contribution of SUVA254, C1 and Zsolnay to predict C/N. In this case it is
predictive behavior between them. Variables EET/EBZ, Kalbitz and Milori are less influential. The
PLS1 regression using only fast parameters is positively driven by the Kalbitz and negatively by the EET/EBZ. Zsolnay and pH are less predictive while E4/E6 and E2/E3 lost their influences.
6. Conclusion
This experiment has shown that spectrometric measurements on samples from cold water extracts
of compost allowed the fast estimation with a good precision (maximum relative error on
predicated value < 10%) of the C/N ratio from a linear combination of fast measured parameters
(pH and some usual spectroscopic indices) and by this mean, allowed the monitoring of its
evolution until its stability directly on site. This approach could be used to develop a simple and
low cost measuring procedure on site allowing to improve the reactivity of the actors and
management of organic waste composting platforms. This approach could be extended to various
type of waste (mixing waste, winery waste, household waste, cattle manure, digestate...) after
regression procedure as learning phase.
Acknowledgements
The authors are grateful to Biotechna Society for providing compost samples, particularly to Mr. NERVI Claude, and the different persons of Laboratory LCE, Mrs. DEMELAS Carine, Mrs. COULOMB Laurence and Mr. VASSALO Laurent, and for Laboratory MIO, Mr. MARTINO Christian, Mr. LEPOUPON Christophe, Mr. DURRIEU Gaël and Mrs. DAVY Marie-Christine. This work was financially supported by The French Agency for Environment and Energy Management (ADEME) [grant n°1506C0034] and ECCOREV research federation from Aix Marseille University (FR3098).
REFERENCES
Baker, A., 2001. Fluorescence excitation-emission matrix characterization of some sewage-impacted rivers. Environ. Sci. Technol. 35, 948-953.
Baker, A., 2002. Fluorescence excitation-emission matrix characterization of river waters impacted by a tissue mill effluent. Environ. Sci. Technol. 36, 1377-1382.
Berkovic, A.M., Einschlag, F.S.G., Gonzalez, M.C., Diez, R.P., Mártire, D.O., 2013. Evaluation of the Hg2+ binding potential of fulvic acids from fluorescence excitation-emission matrices. Photochem. Photobiol. Sci. : Official Journal of the European Photochemistry Association and the European Society for Photobiology 12, 384-392.
Bernal, M.P., Alburquerque, J.A., Moral, R., 2009. Composting of animal manures and chemical criteria for compost maturity assessment. A review. Bioresour. Technol. 100, 5444-5453.
Bro, R., Vidal, M., 2011. EEMizer: Automated modeling of fluorescence EEM data. Chemom. Intell. Lab. Syst. 106, 86-92.
Carballo, T., Gil, M.V., Gomez, X., Gonzalez, F., Moran, A., 2008. Characterization of different compost extracts using Fourier-transform infrared spectroscopy (FTIR) and thermal analysis. Biodegradation. 19, 815-830.
Carmona, E., Moreno, M.T., Aviles M., Ordovas, J., 2012. Composting of wine industry wastes and their use as a substrate for growing soilless ornamental plants. Span. J. Agric. Res. 10, 482-491.
Chefetz, B., Hatcher, P.G., Hadar, Y., Chen, Y.N., 1996. Chemical and biological characterization of organic matter during composting of municipal solid waste. J. Environ. Qual. 25, 776-785.
Chen, Y., Senesi, N., Schnitzer, M., 1977. Information Provided on Humic Substances by E4/E6 Ratios 1. Soil Sci. Soc. Am. J. 41, 352. doi:10.2136/sssaj1977.03615995004100020037x
Chen, W., Westerhoff, P., Leenheer, J.A., Booksh, K., 2003. Fluorescence excitation-emission matrix regional integration to quantify spectra for dissolved organic matter. Environ. Sci. Technol. 37, 5701-5710.
Clark, J.H., Farmer, T.J., Herrero-Davila, L., Sherwood, J., 2016. Circular economy design considerations for research and process development in the chemical sciences. Green Chem. 18, 3914-3934.
Coble, P.G., 1996. Characterization of marine and terrestrial DOM in seawater using excitation-emission matrix spectroscopy. Mar. Chem. 51, 325-346.
Cozzolino, V., Di Meo, V., Monda, H., Spaccini, R., Piccolo, A., 2016. The molecular characteristics of compost affect plant growth, arbuscular mycorrhizal fungi, and soil microbial community composition. Biol. Fert. Soils. 52, 15-29.
Domeizel, M., Khalil, A., Prudent, P., 2004. UV spectroscopy: a tool for monitoring humification and for proposing an index of the maturity of compost. Bioresour. Technol. 94, 177-184.
Doublet, J., Francou, C., Poitrenaud, M., Houot, S., 2011. Influence of bulking agents on organic matter evolution during sewage sludge composting; consequences on compost organic matter
stability and N availability. Bioresour. Technol. 102(2), 1298-1307.
https://doi.org/10.1016/j.biortech.2010.08.065.
Droussi, Z., D’orazio, V., Provenzano, M.R., Hafidi, M., Ouatmane, A., 2009. Study of the biodegradation and transformation of olive-mill residues during composting using FTIR spectroscopy and differential scanning calorimetry. J. Hazard. Mater. 164, 1281-1285.
El Ouaqoudi, F.Z., El Fels, L., Lemée, L., Amblès, A., Hafidi, M., 2015. Evaluation of lignocellulose compost stability and maturity using spectroscopic (FTIR) and thermal (TGA/TDA) analysis. Ecol. Eng. 75, 217-222.
discussion). Technometrics. 35, 109-148.
Fuentes, M., González-Gaitano, G., García-Mina, J.M., 2006. The usefulness of UV–visible and fluorescence spectroscopies to study the chemical nature of humic substances from soils and composts. Org. Geochem. 37, 1949-1959.https://doi.org/10.1016/j.orggeochem.2006.07.024
Fytili, D., Zabaniotou, A., 2008. Utilization of sewage sludge in EU application of old and new methods-A review. Renew. Sustain. Energy Rev. 12, 116-140.
Geladi, P., Kowalski, B.R., 1986. Partial least squares regression: A tutorial. Anal. Chim. Acta. 185, 1-17.
Godden, B., Penninckx, M.J., Castille, C., 1986. On the use of biological and chemical indexes for determining agricultural compost maturity: Extension to the field scale. Agric. Wastes. 15, 169-178. doi:10.1016/0141-4607(86)90013-2.
Goyal, S., Dhull, S.K., Kapoor, K.K., 2005. Chemical and biological changes during composting of different organic wastes and assessment of compost maturity. Bioresour. Technol.. 96, 1584-1591. doi:10.1016/j.biortech.2004.12.012.
Guo, R., Li, G., Jiang, T., Schuchardt, F., Chen, T., Zhao, Y., Shen, Y., 2012. Effect of aeration rate, C/N ratio and moisture content on the stability and maturity of compost. Bioresour. Technol.. 112, 171-178. http://doi.org/10.1016/j.biortech.2012.02.099.
Green, S.A., Blough, N.V., 1994. Optical absorption and fluorescence properties of chromophoric dissolved organic matter in natural waters. Limnol. Oceanogr. 39, 1903-1916. He, X.S., Xi, B.D., Li, X., Pan, H.W., An, D., Bai, S.G., Li, D., Cui, D.Y., 2013. Fluorescence excitation-emission matrix spectra coupled with parallel factor and regional integration analysis to characterize organic matter humification. Chemosphere. 93, 2208-2215.
He, X.T., Traina, S.J., Logan, T.J., 1992. Chemical properties of municipal solid waste composts. J. Environ. Qual. 21, 318-329.
Henderson, R.K., Baker, A., Murphy, K.R., Hambly, A., Stuetz, R.M., Khan, S.J., 2009. Fluorescence as a potential monitoring tool for recycled water systems: a review. Water Res. 43, 863-881.
Hudson, N., Baker, A., Reynolds, D., 2007. Fluorescence analysis of dissolved organic matter in natural, waste and polluted waters-a review. River Res. Appl. 23, 631-649.
Ilani, T., Herrmann, I., Karnieli, A., Arye, G., 2016. Characterization of the biosolids composting
process by hyperspectral analysis. Waste Manage. 48, 106-114.
http://doi.org/10.1016/j.wasman.2015.11.043.
Kalbitz, K., Geyer W., Geyer S., 1999. Spectroscopic properties of dissolved humic substances – a reflection of land use history in a fen area. Biogeochemistry. 47 (2), 219-238.
Khalil A., 2005. Contribution à l’étude et à la modélisation des mécanismes de dégradation et d’humification de divers déchets verts au cours du compostage. PhD Thesis. Laboratoire de Chimie de l’Environnement, Université de Provence (France), 217 p.
Khalil, A., Domeizel, M., Prudent, P., 2008. Monitoring of green waste composting process based on redox potential. Bioresour. Technol. 99, 6037-6045.
Li, D., He, X.S., Xi, B.D., Wei, Z.M., Pan, H.W., Cui, D.Y., 2014. Study on UV–Visible spectra characteristic of dissolved organic matter during municipal solid waste composting. Adv. Mat. Res. 878, 840-849.
Luciani, X., Mounier, S., Paraquetti, H.H.M., Redon, R., 2008. Tracing of dissolved organic matter from the sepetiba bay (Brazil) by PARAFAC analysis of total luminescence matrices. Mar. Environ. Res. 65, 148-157.
Marhuenda-Egea, F.C., Martínez-Sabater, E., Jordá, J., 2007. Dissolved organic matter fractions formed during composting of winery and distillery residues: evaluation of the process by fluorescence excitation-emission matrix. Chemosphere. 68, 301-309.
Maroušek, J., Hašková, S., Zeman, R., Žák, J., Vaníčková, R., Maroušková, A., Váchal, J., Myšková, K., 2016. Polemics on ethical aspects in the compost business. Sci. Eng. Ethics. 22(2), 581-590.
Martin-Ramos, P., Martin-Gil, J., 2020. Facile monitoring of the stability and maturity of compost through fast analytical instrumental techniques, in: Meghvansi, M.K., Varma, A. (Eds), Biology of composts. Springer Nature, Switzerland, pp. 153-179.
Milori, D.M.B.P., Martin-Neto, L., Bayer, C., Mielniczuk, J., Bagnato, V.S., 2002. Humidification degree of soil humic acids determined by fluorescence spectroscopy. Soil Sci. 167 (11), 739-749.
Moral, R., Paredes, C., Bustamante, M.A., 2009. Utilisation of manure composts by high-value crops: safety and environmental challenges. Bioresour. Technol. 100, 5454-5460.
Mouloubou, O.R., Prudent, P., Mounier, S., Boudenne, J.L., Abaker, M.G., Théraulaz, F., 2016. An adapted sequential chemical fractionation coupled with UV and fluorescence spectroscopy for calcareous soil organic matter study after compost amendment. Microchem. J. 124, 139-148. Mounier, S., Redon R., 2018. The Use of 3-D Fluorescence and Its Decomposition in Environmental Organic Matter Studies. Encyclopedia of Analytical Chemistry. Wiley Online Library. https://doi.org/10.1002/9780470027318.a9641.
Murphy, K.R., Stedmon, C.A., Graeber, D., Bro, R., 2013. Fluorescence spectroscopy and multi-way techniques. PARAFAC. Anal. Methods. 5, 6557-6566.
Nafez, A.H., Nikaeen, M., Kadkhodaie, S., 2015. Sewage sludge composting: quality assessment for agricultural application. Environ. Monit. Assess. 187, 1-9.
Parlanti, E., Wörz, K., Geoffroy, L., Lamotte, M., 2000. Dissolved organic matter fluorescence spectroscopy as a tool to estimate biological activity in a coastal zone submitted to anthropogenic inputs. Org. Geochem. 31, 1765-1781.
Provenzano, M.R., Cavallo, O., Malerba, A.D., Di Maria, F., Cucina M., Massaccesi L., Gigliotti, G., 2016. Co-treatment of fruit and vegetable waste in sludge digesters: chemical and spectroscopic investigation by fluorescence and Fourier transform infrared spectroscopy. Waste Manage. 50, 283-289.
Provenzano, M.R., De Oliveira, S.C., Santiago, S.M.R., Senesi, N., 2001. Assessment of maturity degree of composts from domestic solid spectroscopies. J. Agric. Food Chem. 49, 5874-5879. Raut, M.P., Prince William, S.P.M., Bhattacharyya, J.K., Chakrabarti, T., Devotta, S., 2008. Microbial dynamics and enzyme activities during rapid composting of municipal solid waste - A compost maturity analysis perspective. Bioresour. Technol.. 99, 6512-6519. doi:10.1016/j.biortech.2007.11.030.
Reynolds, D.M., Ahmad, R.S., 1997. Rapid and direct determination of wastewater BOD values using a fluorescence technique. Water Res. 31, 2012-2018.
Santín, C., Yamashita, Y., Otero, X.L., Álvarez, M.A., Jaffé, R., 2009. Characterizing humic substances from estuarine soils and sediments by excitation-emission matrix spectroscopy and parallel factor analysis. Biogeochemistry. 96, 131-147.
Sellami, F., Hachicha, S., Chtourou, M., Medhioub, K., Ammar, E., 2008. Maturity assessment of composted olive mill wastes using UV spectra and humification parameters. Bioresour. Technol. 99, 6900-6907. doi:10.1016/j.biortech.2008.01.055.
Sierra, M.M.D.S., Donard, O.F.X., Lamotte, M., Belin, C., Ewald, M., 1994. Fluorescence spectroscopy of coastal and marine waters. Mar. Chem. 47, 127-144.
Soriano-Disla, J.M., Gomez, I., Guerrero, C., Navarro-Pedreno, J., Garcia-Orenes, F., 2010. The potential of NIR spectroscopy to predict stability parameters in sewage sludge and derived compost. Geoderma 158, 93-100. doi:10.1016/j.geoderma.2009.12.022
environments using a new approach to fluorescence spectroscopy. Mar. Chem. 82, 239-254. Stedmon, C.A., Bro, R., 2008. Oceanography: methods characterizing dissolved organic matter fluorescence with Parallel Factor Analysis: a tutorial. Environ. Res. 6, 572-579.
Sundberg, C., Smars, S., Jonsson, H., 2004. Low pH as an inhibiting factor in the transition from mesophilic to thermophilic phase in composting. Bioresour. Technol.. 95, 145-150. https://doi.org/10.1016/j.biortech.2004.01.016.
Tang, J.C., Maie, N., Tada, Y., Katayama, A., 2006. Characterization of the maturing process of cattle manure compost. Process Biochem. 41, 380-389.
Tenenhaus, M., 1998. La régression PLS. Théorie et pratique. Editions Technip, 264 p.
Tian, W., Li, L.Z., Liu, F., Zhang, Z.H., Yu, G.H., Shen, Q.R., Shen, B., 2012. Assessment of the maturity and biological parameters of compost produced from dairy manure and rice chaff by excitation-emission matrix fluorescence spectroscopy. Bioresour. Technol.. 110, 330-337.
Wang, Z.G., Liu, W.Q., Zhao, N.J., Li, H.B., Zhang, Y.J., Si-Ma, W.C., Liu, J.G., 2007. Composition analysis of colored dissolved organic matter in Taihu Lake based on three dimension excitation-emission fluorescence matrix and PARAFAC model, and the potential application in water quality monitoring. J. Environ. Sci. 19, 787-791.
Wei, Z., Wang, X., Zhao, X., Xi, B., Wei, Y., Zhang, X., Zhao, Y., 2016. Fluorescence characteristics of molecular weight fractions of dissolved organic matter derived from composts. Int. Biodeterior. Biodegr. 113, 187-194.
Wold, H., 1975. Soft Modeling by Latent Variable; the Non-lineare Iterative Partial Least Squares Approach in Perspectives in Probability and Statistics, Papers in Honour of M. S. Bartlett. Academic Press, Ed. J. Gani, London.
Wold, S., Ruhe, A., Wold, H., Dunn, W.J., 1984. The Collinearity Problem in Linear Regression. The Partial Least Squares (PLS) Approach to Generalized Inverses. SIAM J. Sci. Statist. Comput. 5, 735-743.
Young, B.J., Rizzo, P.F., Riera, N.I., Torre, V.D., López, V.A., Molina, C.D., Fernández, F.E., Crespo, D.C., Barrena, R., Komilis, D., Sánchez, A., 2016. Development of phytotoxicity indexes and their correlation with ecotoxicological, stability and physicochemical parameters during passive composting of poultry manure. Waste Manage. 54, 101-109.
Zbytniewski, R., Buszewski, B., 2005. Characterization of natural organic matter (NOM) derived from sewage sludge compost. Part 2: Multivariate techniques in the study of compost maturation. Bioresour. Technol. 96, 479-484.
Zhang, M., He, Z., Zhao, A., Zhang, H., Endale, D.M., Schomberg, H.H., 2011. Water-extractable soil organic carbon and nitrogen affected by tillage and manure application. Soil Sci. 176, 307-312.
Zhang, S., Chen, Z., Wen, Q., Ma, J., He, Z., 2016. Assessment of maturity during co-composting of penicillin mycelial dreg via fluorescence excitation-emission matrix spectra: characteristics of chemical and fluorescent parameters of water-extractable organic matter. Chemosphere. 155, 358-366.
Zhao, H., 2011. Analyse de la matière organique et ses propriétés dans l’environnement naturel en spectroscopie de fluorescence 3D traitée par PARAFAC. PhD Thesis. Université du Sud Toulon Var (France), 164 p.
Zmora-Nahum, S., Markovitch, O., Tarchitzky, J., Chen, Y., 2005. Dissolved organic carbon (DOC) as a parameter of compost maturity. Soil Biol. Biochem. 37, 2109-2116. doi:10.1016/j.soilbio.2005.03.013
Fluorescence Spectroscopy the Sources of Dissolved Organic Matter in Soils Subjected to Drying. Chemosphere. 38 (1), 45-50.