HAL Id: hal-02998713
https://hal.archives-ouvertes.fr/hal-02998713
Submitted on 10 Nov 2020
HAL is a multi-disciplinary open access
archive for the deposit and dissemination of
sci-entific research documents, whether they are
pub-lished or not. The documents may come from
teaching and research institutions in France or
abroad, or from public or private research centers.
L’archive ouverte pluridisciplinaire HAL, est
destinée au dépôt et à la diffusion de documents
scientifiques de niveau recherche, publiés ou non,
émanant des établissements d’enseignement et de
recherche français ou étrangers, des laboratoires
publics ou privés.
Directions
Vincent Motto-Ros, V Gardette, L Sancey, M Leprince, D Genty, S Roux, B
Busser, F Pelascini
To cite this version:
Vincent Motto-Ros, V Gardette, L Sancey, M Leprince, D Genty, et al.. LIBS-Based Imaging: Recent
Advances and Future Directions. Spectroscopy, 2020, 35. �hal-02998713�
LIBS-Based Imaging: Recent
Advances and Future Directions
Laser-induced breakdown spectros-copy (LIBS)-based imaging is becom-ing a promisbecom-ing technique in the panel of spatially-resolved elemental ap-proaches. This method has outstand-ing advantages, such as all optical in-strumentation, fast acquisition speed, operation at ambient atmosphere, and detection limits at the ppm scale for most elements. LIBS-based imag-ing has an extensive range of applica-tions, including biology, medicine, in-dustry, and geology. In this paper, we aim to report recent advances in LIBS imaging, focusing on instrumentation, performance, and applicability. Two examples are shown; first, a speleo-them with application to paleoclimate studies, and second, a biological organ with implications for toxicology of new drugs based on nanoparticles. Finally, some future directions are discussed.
V. Motto-Ros, V. Gardette, L. Sancey, M. Leprince, D. Genty, S. Roux, B. Busser, and F. Pelascini
I
n the past few years, the applica-tion of laser-induced breakdown spec-troscopy (LIBS) to microscopic elemental imaging has known strong developments, both in terms of instrumentation and ap-plications (1–4). In LIBS imaging, a series of laser-induced plasma is generated at different positions on the sample surface with a predefined sequence covering the region of interest. Such plasma sources allow specific optical responses resulting from the electronic relaxation of atoms and ions excited by the high plasma tempera-ture to be elicited from the elements con-stituting the sample. The light emitted by the plasma is collected and analyzed using an optical spectrometer. The elemental “signal” (atomic and ionic emissions) is then extracted from the recorded spectra, and elemental maps can be obtained in a pixel-by-pixel manner (Figure 1) (5,6).The main advantage of LIBS certainly lies in its simple implementation. This is because a single laser pulse simultane-ously samples the material by laser ab-lation, atomizes, and then excites the vaporized mass by heating the plasma plume. Such apparent simplicity endows this technique with a series of advantages, including an all-optical design compat-ible with conventional optical microscopy, operation in ambient atmosphere, and fast operating speed up to kHz. In addi-tion to its table-top instrumentaaddi-tion, this technique has multielement capabilities, no restrictions in the detection of light
elements, detection limits in the range of ppm for most elements, and microscopic-scale resolution (2). It also has quantitative capabilities through the use of standards with known concentrations or an external calibration using different strategies (6–9). All of these advantages make LIBS imag-ing highly promisimag-ing, with the potential to become a reference technique in the area of spatially-resolved elemental techniques with good complement to gold standard methods, such as laser ablation inductively coupled plasma mass spectrometry (LA-ICP-MS), synchrotron radiation microanaly-sis, or electron probe microanalysis (EPMA) (10–13).
Recently, the LIBS community demon-strated the interest of this technique for various ranges of applications, covering geological, industrial, and biomedical do-mains. For example, the capability of LIBS imaging to characterize complex samples was explored with the analysis of a multi-phase hydrothermal ore sample (14). More than 30 elements were identified, with the concentration ranges extending from major to trace elements. For application to paleoclimate, large-scale speleothems and coral samples (> 10 cm²) were
ana-lyzed, with the aim of revealing the laminar structures related to vegetation or climatic variations (5). Several studies applied to industrial materials have also been con-ducted on crystals (7,9) or heterogeneous catalysts (8,15). The possibility of obtaining elemental images of biological tissues was
also demonstrated in different biomedical situations (16–18). In this paper, we illustrate recent advances in LIBS imaging in terms of instrumentation and applicability. Two different examples are shown to illustrate the specificities and the current perfor-mance of this technique.
Experimental
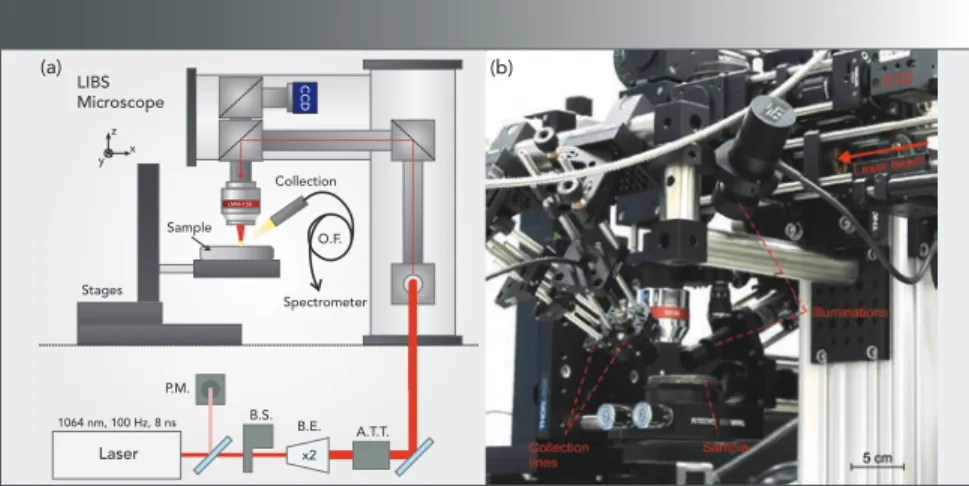
The micro-LIBS system developed in our group is based on a custom microscope (Figure 2). The opto-mechanical structure has been designed with the use of cage and tube systems commercialized by Thorlabs. The device includes a laser in-jection line, monitoring cameras (sample surface, plasma), and illuminators (white light, laser pointer), as well as up to three collection lines connected to spectrom-eters with optical fibers (19). The device is also equipped with a Raman system op-erating at 735 nm, and allowing punctual analysis to be performed. The laser used is a nanosecond Nd:YAG laser working at the fundamental wavelength (1064 nm)
with a frequency rate of 100 Hz (Centu-rion, Quantel). The typical pulse energy is
in the range of 1 mJ for most applications. The laser energy is stabilized throughout
FIGURE 1: LIBS-based imaging principle. (a) Schematic view of the micro-LIBS setup
showing the 15x microscope objective used to focus the laser pulse, the motorized platform supporting the sample and an optical detection system connected to the optical spectrometer via an optical fiber. (b) Example of single-shot emission spectra recorded in four different regions of the sample (a rat kidney sampled one hour after gold nanoparticle administration) with the characteristic emission lines of iron (Fe), phosphorous (P), and gold (Au). (c) Principle of data extraction using LasMap Soft-ware. (d) Example of relative-abundance images of Au (yellow), Fe (red), and P (blue).
the experiment by using a servo control loop consisting of a power meter and a computer-controlled attenuator (Figure 2a). The system is equipped with several Czerny-Turner spectrometers (Shamrock 303 and Shamrock 500, Andor technology) coupled to ICCD cameras (Istar, Andor Technology) as well as compact spectrom-eters (MayaPro and HR2000+ from Ocean Optics), which can be operated simultane-ously. In our instrument, the laser beam is focused using a 15x magnification objec-tive (LMM-15X-P01, Thorlabs). The typical crater size is in the range of 7 µm. For all imaging experiments, a laser-induced plasma is generated continuously while scanning the sample surface. The scanning is performed line by line, continuously, in a raster scan mode with the use of motor-ized x–y–z stages. The operating speed is equivalent to the laser frequency (100 Hz), and a 1-megapixel image is typically obtained in less than 3 h (5). In addition,
the measurements are performed at room temperature under ambient pressure in air or in an argon atmosphere. Finally, in-house developed software written in the LabVIEW environment is used to control the entire imaging setup, thereby allowing automatic scanning sequences in any se-lected region of interest of a given sample with a preset laser pulse energy and spatial resolution.
For processing the spectral dataset, our group has developed a custom LabVIEW software, named “LasMap.” This software allows the relevant intensities to be ex-tracted from the spectra before building the corresponding elemental images. We generally use the average spectrum (com-puted with the whole spectral dataset) to obtain an overview of the spectral struc-ture of the sample, allowing the selection of the lines of interest free of interference. Algorithms then extract the net intensity of the lines by taking into account the
base-line level to generate a 2D matrix (relative abundance image) (20). This procedure is relatively fast for a single matrix sample, with a megapixel dataset typically pro-cessed in less than a few minutes.
Results and Discussion Imaging “Performances”
In LIBS-based imaging, the achievable per-formance (for example, spatial resolution and detection limits) are strongly related to the laser ablation process. To guaran-tee the best shot-to-shot repeatability, it is important to set up the experiment to avoid any overlap between consecutive laser shots. The lateral resolution is then ultimately governed by the laser-induced damage and the limits of detection (LoD) depend both on the mass of vaporized ma-terial (such as the crater volume) as well as the excitation capability of the laser pulse. Therefore, there is a compromise between these parameters. As an example, the evo-lution of the detection limit of magnesium (Mg) as a function of the crater diameter is shown in Figure 3a. This result was ob-tained on a reference glass by modifying the laser pulse energy. The LoD shows a strong deterioration when reducing the crater size due to the reduction of the ab-lated mass (plasma density). For larger cra-ter size, there is also an increase of the LoD due to the saturation of the detector, that was optimized for detecting weak signals. To give priority to the detection limits, we preferentially use crater sizes in the range of 6 to 10 µm. It is important to mention that laser ablation is a violent process. It is accompanied by different mechanisms, in-cluding shock wave formation and thermal diffusion through the sample, that might cause more sample deterioration than the ablation itself. The resolution will then be dependent on the material proper-ties, particularly the hardness. However, a resolution lower than 15 µm can easily be obtained for the large majority of materials.
Figure 3b shows the typical accessible range of LoDs, expressed in weight %, obtained in this configuration for most of the elements. Sub-ppm LoDs are gener-ally achieved for alkali and alkali-earth metals. The sensitivity remains attractive for other metals, with LoDs better than 20
(a) (b) Crater size (µm) Limit of Detection Mg (ppm) Volume Saturation 10 8 6 4 2 0 2 4 6 8 10 12 14 16 < ppm < 20 ppm > 500 ppmunknown H Li Be Na Ca K Mg Rb Sr Sc Y Ti Zr Hf Ta W Re OsIr Pt Au Hg TI Pb Bi Po At Rn V Nb Cr Mo Mn Tc Fe Ru Co Rh Ni Pd Cu Ag Zn Cd Ga In Ge Sn As Sb Se Te Br I Kr Al Si P S Cl Ar B C N O F Ne He Xe Cs Ba Fr Ra R.E.E. La Ce Pr NdPmSm Eu Gd Tb Dy Ho Re Tm Yb Lu Ac Th Pa UNpPu Am Cm Bk Cf Es Fm Md No Lr
FIGURE 3: (a) Evolution of the Mg limit of detection (LoD) with increasing
crater size. (b) Estimated values of relative detection limits obtained in single pulse configuration. (a) LIBS (b) Microscope Stages Sample Spectrometer Collection O.F. P.M. B.S. B.E. A.T.T. x2 Laser 1064 nm, 100 Hz, 8 ns y z x LMM-15X CCD
FIGURE 2: LIBS imaging setup. (a) Schematic view of the LIBS setup: P.M.
(power meter), B.S. (beam shutter), B.E. (beam expander), A.T.T. (attenuator), and O.F. (optical fiber). (b) Photo of the LIBS imaging instrument.
ppm, but strongly deteriorates for organic and halogen elements. It is important to emphasize that such relative LoDs are ob-tained in a single pulse configuration and from an ablated mass in the range of 0.1 nanogram (typical ablated mass from a single laser pulse). Expressed in absolute detection limits (for example, the smallest mass quantity that can be detected), val-ues typically lower than the femto-gram can be achieved.
Paleoclimate Application
Thanks to the 100 Hz scanning speed, and because there is no constraint on the size of the sample (such as, for example, no need for an ablation cell), large surfaces can be easily analyzed. Such aspects may be valuable in the case of geological sam-ples, particularly for the characterization of speleothems. Stalagmites, stalactites, or columns precipitate from seepage wa-ters in caves, and usually consist of calcium carbonate, with calcite being the most common mineral phase. Climate proxies, such as Mg, Sr, or Ba, can be retrieved from these materials, and may indicate changes in climate or environmental conditions that occurred during the growth periods and provide information on past temperature, precipitation, and vegetation changes over the last hundreds of thousands of years (21). For recording paleoclimate proxies, it is interesting to analyze several centime-ters, or even more, of a sample while keep-ing a resolution on the scale of the annual speleothem growth (typical rates of 0.01 to 2 mm per year) (22).
An example is shown in Figure 4 for a speleothem extracted from a Gallo-Roman copper ore mine situated close to the “Grotte Bleue” in Aude, France (courtesy of D. Genty and P. Cabrol of DREAL, in Tou-louse, France). At the collection site, there is a strong abundance of copper, which gives a particular blue color to this mineral. This site is also known to be rich in iron, lead and arsenic. Amphoras discovered on the site suggested Roman exploitation of the cave from the 1st century BC, but it is suspected that the site was also occu-pied in the Bronze Age (23). In the example shown in Figure 4, a mapping sequence of 2300 x 1600 pixels was performed with a
step size of 24 µm, which corresponds to a surface of analysis of more than 20 cm². The optical image of the sample and el-emental images of Mg and Pb are shown. These results illustrate that the resolution capabilities of the LIBS imaging method and annual growth layers can be observed. It is worth mentioning that other elements, such as Cu, Ag, Sr, Ba, Al, and Si, were also detected. The interpretation of such results is currently being explored by specialists.
Imaging Biological Specimens
LIBS-imaging can also be applied on soft biological tissues. Our first work was con-ducted on a mouse kidney to image the biodistribution of nanoparticles before administration to animals (6,24,25). These works were followed by several articles reporting biological studies conducted on murine animals, where LIBS was used in complement with more conventional techniques such as transmission
elec-FIGURE 4: Example of elemental images obtained from a speleothem section
re-covered from the Gallo-Roman copper ore mine located close to the “Grotte Bleue” in Aude, France. Images shown are (from left to right): an optical image, and high-lighted composition images for magnesium (Mg), lead (Pb), and copper (Cu).
edax.com
Orbis Micro-XRF
Analysis System
• Non-destructive X-ray elemental analysis from Na to Bk • Excitation geometry perpendicular to sample for accurate sample targeting• High-intensity analysis for micro to millimeter areas
• Increased sensitivity with filters as standard
• Fastest analytical speed with state of the art detectors
For more information, please visit:
https://www.edax.com/micro-xrf
tronic microscopy (TEM) or fluorescence microscopy (17,18,26). More recently, some studies were also conducted with human specimens of medical interest (16,27). In health infrastructures, the possibility of coupling LIBS imaging with conventional histopathology could be highly valuable for the completion of some medical diag-noses. Because LIBS imaging is compatible with the light microscopy used in pathol-ogy laboratories, it may provide impor-tant support for uncovering the elemental composition of tissues, particularly in the case of numerous pathologies relating to exposure to metals (such as respiratory diseases, dermatological diseases, and cancers, for example.).
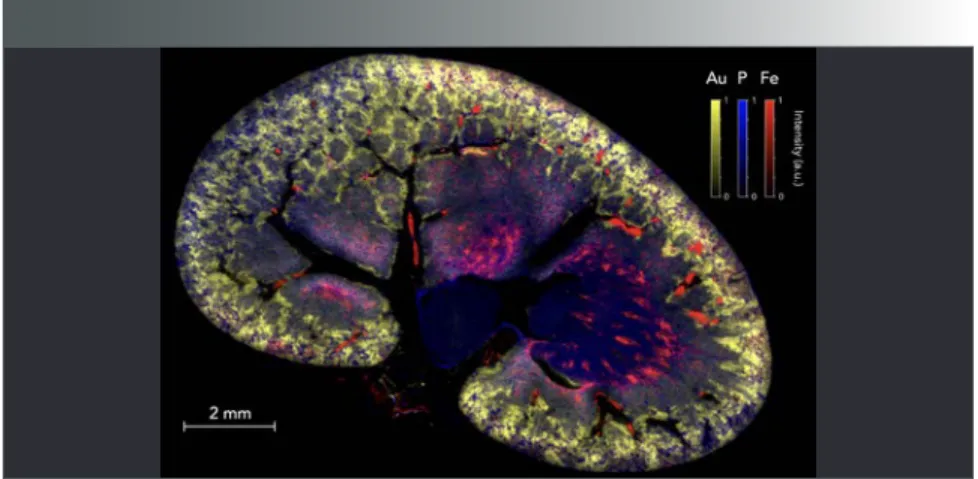
As an example, Figure 5 shows an image obtained for a rat kidney section. The organ was sampled 1 h after intrave-nous administration of gold nanoparticles. This experiment was performed with a resolution of 10 µm, and represents 2 mil-lion individual pixels. Three elements are represented with a false color scale: Au in yellow, P in blue (the P distribution reflects the histological structure of the tissue), and Fe in red (in this case, the threshold allows for visualizing Fe from hemoglobin, and by extent, blood vessels). As observed in several previous work (6,26), small NPs are mainly eliminated by the renal route with partial retention in the cortex region of the organ ( peripheral region), indicating a normal elimination process. More gener-ally, the possibility of imaging nanoparticle
distribution at the entire organ scale and without any labeling is highly relevant for studies involving the development of new drugs based on metals.
Status and Future Directions
LIBS-based imaging is a mature technique for various classes of materials. These ma-terials consist of a homogeneous matrix in which it is desired to observe the possible heterogeneity of minor or trace elements (both examples shown above (Figures 4 and 5). The advantage of such a simple ma-terial is that matrix effects can be avoided, greatly facilitating the calibration of raw intensities. In addition, since we are inter-ested in minor or trace elements, line satu-ration phenomena (such as self-absorption and detector saturation) are nonexistent, and the intensity of the measured lines is linearly dependent on the concentration.
However, difficulties arise when con-sidering complex materials with multiple matrices. These difficulties are inherent to all elemental imaging methods. Regard-less of the analytical technique, the inter-action between the primary beam and the material will always depend on the sample properties. The recorded signal will then be dependent on the material (nature, hardness, composition, and so on), so it is difficult to generate a quantitative analysis on such complex material, regard-less of the technique used. Currently, the classical way to calibrate the intensities is to use reference samples for each phase
of the material, knowing that in practice these standards do not always exist. An interesting possibility for the future is to implement a calibration-free approach. Such a method does not require external references because it only relies on the physical analysis of the spectra. By consid-ering a given plasma model and measur-ing its parameters (such as temperature or electronic density, for example), it is pos-sible to extract the concentrations of the various detected elements, regardless the type of the matrix. Such a method could be highly promising for the development of the technique, and several groups are currently working on its implementation.
An additional difficulty related to emis-sion spectroscopy comes from the possible complexity of the signal. Some elements, such as transition metals, have a large num-ber of emission lines from the ultraviolet (UV) to near infrared (NIR) range. This is the case in particular for iron or titanium. If one or more of these elements are a matrix con-stituent, the observed spectra will be spec-trally dense, and the desired lines (generally from minor or trace elements) will likely be masked. In this case, the performance in terms of sensitivity will deteriorate.
Managing the processing of data ob-tained on complex samples also repre-sents a challenge and limits the fields of possible exploration of the technique. It must be kept in mind that the data to be processed are very large (up to several tens of gigabytes), and the soft-ware used cannot be supervised. It is indeed impractical to interpret spectra one by one for a megapixel analysis. A promising possibility that is currently being explored is the use of statistical analysis methods (such as chemomet-rics). In general, these methods allow the dimensionality of a series of data to be reduced by looking for correlations among the different variables, thus mak-ing the information less redundant and easier to handle. We recently published an article detailing the implementation of principal component analysis (28), and several groups in the LIBS com-munity are currently exploring other methods, such as the possibility to use machine learning approaches.
FIGURE 5: Multielemental image of a rat kidney after intravenous injection of gold
(Au) nanoparticles. Merged image composed of the combination of three false color elemental images for Au (yellow), P (blue) and Fe (red). These animal experiments were approved by the local ethics committee under agreement A21231016EA.
Conclusion
LIBS imaging is currently experiencing strong development with an increase in the number of published papers during the three last years. Due to the feasibility studies conducted in labo-ratories, this approach is becoming increasingly mature, and is currently a good candidate to become a refer-ence approach for spatially-resolved elemental characterization in the near future. LIBS has unique specificities, such as the possibility of reaching mi-crometric scale resolution with limits of detection down to ppm, operation at ambient conditions with table top and all optical instrumentation. Re-garding the acquisition rate, recent work has demonstrated the possibility of access to kHz acquisition rates (29), and higher operating speeds should be achieved very soon.
The future will tell if this LIBS-based imaging can be generalized and used outside academic laboratories. What is certain is that, at some point, its development will have to be sup-ported by large industrial groups. In the meantime, researchers still have some work to explore. In particular, the analysis of complex materials (those composed of several matrices) appears challenging, both for quanti-fication and data processing. Further studies dedicated to these issues need to be conducted, and the use of calibration-free LIBS and advanced chemometric tools represent interest-ing opportunities.
Acknowledgments
This work was partially supported by the French region Rhônes Alpes Auvergne (Optolyse, CPER2016) and the French ANR (projects MediLIBS ANR-17-CE18-0028-04 and Imazinc ANR-16 -CE29- 0 024). In addition, we gratefully acknowledge Florian Trichard from Ablatom S.A. S, Nicolo Omenetoo from the University of Florida, Ludovic Duponchel from the University of Lille, and Chris-tophe Dujardin from ILM for fruitful discussions.
References
1. M.P. Mateo and G. Nicolas, App.
Spec-trosc. Rev. 48, 357–383 (2013).
2. L. Jolivet, M. Leprince, S. Moncayo, L. Sorbier, C.P. Lienemann, and V. Motto-Ros, Spectrochim. Acta Part B 151, 41–53 (2019).
3. B. Busser, S. Moncayo, J.-L. Coll, L. Sancey, and V. Motto-Ros, Coord.
Chem. Rev. 358, 70–79 (2018).
4. R. Gaudiuso et al., Spectrochim. Acta
Part B 152, 123–148 (2019).
5. J.O. Cáceres, F. Pelascini, V. Motto-Ros, S. Moncayo, F. Trichard, G. Panczer, A. Marín-Roldán, J.A. Cruz, I. Coronado, and J. Martín-Chivelet, Sci. Rep. 7, 5080 (2017).
6. L. Sancey, V. Motto-Ros, B. Busser, S. Kotb, J.M. Benoit, A. Piednoir, F. Lux, O. Tillement, G. Panczer, and J. Yu, Sci.
Rep. 4, 6065 (2014).
7. G. Alombert-Goget, F. Trichard, H. Li, C. Pezzani, M. Silvestre, N.s Barthalay, V. Motto-Ros, and K. Lebbou,
Opti-cal Materials, ISSN 0925-3467 (2016). (NEED MORE INFO)
8. F. Trichard, L. Sorbier, S. Moncayo, Y. Blouët, C.-P. Lienemann, and V. Motto-Ros, Spectrochim. Act. B 133, 45–51 (2017).
9. P. Veber et al., CrystEngComm 21, 3844–3853 (2019).
10. K. Janssens, W. de Nolf, G. van der Snickt, L. Vincze, B. Vekemans, R. Ter-zano, and F.E. Brenker, Trends Anal.
Chem. 29, 464–478 (2010).
11. K.L. Moore, E. Lombi, F.-J. Zhao, and C.R.M. Grovenor, Anal. Bioanal. Chem.
402, 3263–3273 (2012).
12. D. Pozebon, G.L. Scheffler, V.L. Dressler, and M.A.G. Nunes, J. Anal. At.
Spec-trom. 29, 2204–2228 (2014).
13. M. Reich, R. Large, and P.A. Deditius,
Ore Geol. Rev. 81, 1215–1217 (2017).
14. C. Fabre et al., J. Anal. At. Spectrom.
33, 1345–1353 (2018).
15. F. Trichard, F. Gaulier, J. Barbier, D. Es-pinat, B. Guichard, C.-P. Lienemann, L. Sorbier, P. Levitz, and V. Motto-Ros, J.
Catal. 363, 183–190 (2018).
16. B. Busser et al., Mod. Pathol. 152, 1–7 (2017).
17. S. Kunjachan et al., Nano Lett. 15, 7488 (2015).
18. X. Le Guével et al., Nanoscale 10, 18657–18664 (2018).
19. V. Motto-Ros, E. Negre, P. Pelascini, G. Panczer, and J. Yu, Spectrochim. Act. B
92, 60–69 (2014).
20. V. Motto-Ros, S. Moncayo, F. Trichard, and F. Pelascini, Spectrochim. Act. B 155, 127-133 (2019).
21. J. Ian Fairchild et al., Earth-Sci. Rev. 75, 105–153 (2016).
22. D. Genty, A. Baker, and B. Vokal, Chem.
Geol. 176, 191–212 (2001).
23. G. Munteanu, E. Kammenthaler, J. Mantenant, and C. Rico,
ArcheoSci-ences 40, 163–180 (2016).
24. V. Motto-Ros, L. Sancey, Q. L. Ma, F. Lux, X. S. Bai, X. C. Wang, J. Yu, G. Panczer, and O. Tillement, App. Phys.
Lett. 101, 223702 (2012).
25. Y. Gimenez et al., Nature Sci. Rep. 6, 29936 (2016).
26. L. Sancey et al., ACS Nano 9, 2477 (2015).
27. S. Moncayo, F. Trichard, B. Busser, M. Sabatier-Vincent, F. Pelascini, N. Pinel, I. Templier, J. Charles, L. Sancey, and V. Motto-Ros, Spectrochim. Act. B 133, 40–44 (2017).
28. S. Moncayo, L. Duponchel, N. Mousa-vipak, G. Panczer, F. Trichard, B. Bous-quet, F. Pelascini, and V. Motto-Ros, J.
Anal. Atom. Spectrom. 33, 210–220
(2018).
29. K. Rifai, F. Doucet, L. Özcan, and F. Vidal, Spectrochim. Act. B 150, 43–48 (2018).
V. Motto-Ros, V. Gardette and M. Leprince are with the Institut
Lu-mière Matière at the Université de Lyon, in Villeurbanne, France. Lep-rince, L. Sancey and B. Busser are
with the Institute for Advanced Bio-sciences at the Univ. Grenoble Alpes, in Grenoble, France. B. Busser is also
with Grenoble University Hospital, in Grenoble, France. D. Gentry is with
the Université de Bordeaux, in Pes-sac, France. S. Roux is with the
Uni-versité de Franche-Comté, in Besan-çon, France. F. Pelascini is with Cetim
Grand Est, in Illkirch-Graffenstaden, France. Direct correspondence to: [email protected]