ÉCOLE DE TECHNOLOGIE SUPÉRIEURE UNIVERSITÉ DU QUÉBEC
MANUSCRIPT-BASED THESIS PRESENTED TO THE ÉCOLE DE TECHNOLOGIE SUPÉRIEURE
IN PARTIAL FULFILLMENT OF THE REQUIREMENTS FOR THE DEGREE OF DOCTOR OF PHILOSOPHY
Ph.D.
BY Thomas HEID
INNOVATIVE NANOSTRUCTURED EPOXY COMPOSITES FOR ENHANCED HIGH VOLTAGE INSULATION SYSTEMS
MONTREAL, AUGUST 18th, 2015 Thomas HEID, 2015
This Creative Commons licence allows readers to download this work and share it with others as long as the author is credited. The content of this work can’t be modified in any way or used commercially.
BOARD OF EXAMINERS
THIS THESIS HAS BEEN EVALUATED BY THE FOLLOWING BOARD OF EXAMINERS
Mr. Eric David, Thesis Supervisor
Department of Mechanical Engineering at École de Technologie Supérieure
Mr. Michel F. Fréchette, Thesis Co-supervisor
Department of Material Sciences at Hydro-Québec’s Research Institute
Mr. Sylvain Cloutier, President of the Board of Examiners Dean of Research at École de Technologie Supérieure
Mr. Martin Viens, Member of the jury
Department of Mechanical Engineering at École de Technologie Supérieure
Mr. Michael Muhr, External Evaluator
Institute of High Voltage Engineering and System Performance at Graz University of Technology
THIS THESIS WAS PRESENTED AND DEFENDED
IN THE PRESENCE OF A BOARD OF EXAMINERS AND PUBLIC ON AUGUST 12th, 2015
INNOVATIVE NANOSTRUCTURED EPOXY COMPOSITES FOR ENHANCED HIGH VOLTAGE INSULATION SYSTEMS
Thomas HEID RÉSUMÉ
Afin de faire face à la demande croissante en électricité, les tensions et les puissances d’opération ont été amenées à augmenter au cours des dernières années. Ceci engendre inévitablement une augmentation des contraintes électrothermiques sur les systèmes d'isolation électrique existants. Cependant, les matériaux polymériques habituellement utilisés pour les systèmes d’isolation haute tension sont vulnérables à la dégradation due à la présence de décharges électriques et présentent généralement de faibles conductivités thermiques. Ces raisons, choisies parmi d’autres, expliquent pourquoi il y a un besoin de créer une nouvelle génération de matériaux isolants avec de meilleures performances diélectriques et thermiques.
Durant les dernières décennies, l'attention s’est portée sur une nouvelle classe de matériaux diélectriques: les nanocomposites polymériques ou nano diélectriques. Ces diélectriques, renforcés de particules de dimension nanométrique à la place des particules micrométriques habituellement utilisés, ont montré des performances considérablement améliorées, comme, par exemple, une amélioration de la rigidité diélectrique même à de très faibles teneurs en particules, ce qui suggère leur grand potentiel d'application dans les systèmes d'isolation HT. Néanmoins, ces matériaux ne peuvent atteindre leur potentiel maximum que lorsqu’une bonne dispersion et une bonne distribution des particules dans la matrice-polymère sont atteintes. Toutefois, des grappes de nanoparticules avec des dimensions micrométriques ou submicrométriques peuvent survenir, surtout à cause de l'incompatibilité entre les particules inorganiques et le polymère organique. Ces agglomérations peuvent limiter l'amélioration des propriétés diélectriques attendue dans le cas de nanoparticules bien dispersées. Afin d'améliorer l'interaction entre les particules inorganiques et la matrice organique, et par conséquent afin d'améliorer la dispersion de ces particules dans des polymères, la fonctionnalisation de nanocharges par l’intermédiaire de traitements de surface est souvent utilisée. Pourtant, on sait peu sur la stabilité à long terme de ces traitements de surface sous les contraintes électrothermiques d’opération, ce qui peut limiter leur utilisation à l’échelle industrielle, dans le domaine de la haute tension.
L'objectif de cette thèse a été le développement de matériaux innovants à base d’époxy nanostructurés, en vue d’améliorer les performances diélectriques et thermiques du polymère de base, ainsi que d'évaluer leur applicabilité pour les systèmes d'isolation à haute tension. Afin de réaliser une contribution originale au domaine des nano diélectriques, une nouvelle approche a été explorée par l’utilisation d’additifs fonctionnels nanométriques - des silsesquioxanes oligomères polyédriques (POSS) - au lieu d'appliquer une fonctionnalisation de surface pour des nanocharges habituellement utilisées. En outre, dans le cadre de ce travail, des composites nanostructurées à plusieurs phases ont été conçus, impliquant des
additifs fonctionnels (POSS) dans la matrice polymère ainsi que des particules micro ou sbmicrométriques avec une haute conductivité thermique - nitrure de bore (BN) - comme deuxième additif, afin d’augmenter la conductivité thermique des composites résultants. Pour atteindre cet objectif, dans une première étape, des composites d’époxy avec du nitrure de bore ayant une structure cristalline hexagonale (h-BN) ou cubique (c-BN), ont été élaborés et analysés, avec des teneurs en charge bien en dessous du seuil de percolation. Notre objectif a été de trouver le type de renfort le plus prometteur, le pourcentage massique de celui-ci ainsi que la taille idéale, pour augmenter la conductivité thermique dans les composites à base d’époxy. Dans ce contexte, il a été montré que l'incorporation de faibles fractions massiques (≤ 5 %) de particules h-BN submicrométriques ou micrométriques dans la résine époxy conduit à des améliorations notables dans la résistance à la dégradation sous décharges couronne ainsi que dans la conductivité thermique résultantes des composites, par rapport au polymère de base. L'addition de 5 % (en poids) de c-BN submicrométriques, cependant, a généré l'amélioration la plus significative de la conductivité thermique par rapport aux matériaux composites époxy/h-BN. Toutefois, tous les composites époxy/BN ont vu une légère réduction de leur rigidité diélectrique, allant jusqu’à 18 % par rapport à la résine époxy de base, ce qui est un phénomène couramment observé quand des particules de ces tailles sont utilisées. Cependant, comme les valeurs retrouvés sont nettement plus élevés que les contraintes électriques courantes pour l'isolation à haute tension (des rigidités diélectriques au-dessus de 130 kV / mm pour le h-BN, et au-dessus de 170 kV / mm pour les composites c-BN), l’amélioration notable de la résistance à l'érosion ou de conductivité thermique dans le cas des composite restent des résultats qui pourraient avoir un impact notable dans le domaine de l’appareillage de haute tension.
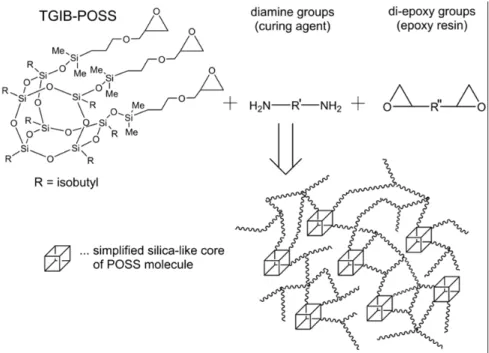
Dans une deuxième étape, deux types différents de nanocharges fonctionnelles de type POSS ont été utilisées pour fabriquer des composites. POSS est un matériau hybride organique/inorganique, qui a un noyau en silice, entouré par des groupes fonctionnels. Ces groupes fonctionnels ont une nature réactive dans le cas des deux additifs POSS utilisés dans ce projet, et donc, peuvent créer des liaisons covalentes avec l'époxy. Le premier additif POSS a été un Triglycidylisobutyl-POSS (TG-POSS) avec 3 groupes fonctionnels, compatibles avec notre système époxy. Lors de notre étude, on a constaté que la création de liaisons covalentes entre la matrice époxy et POSS améliore de manière significative l'interaction nanocharge-matrice et, par conséquent, conduit à des améliorations significatives de la rigidité diélectrique et de la résistance aux décharges couronne pour les composites TG-POSS. De plus, des performances supérieures ont été retrouvées pour les composites avec des teneurs en particules allant de 1 à 2,5 % (en poids), cas pour lesquels aucune agglomération n’a été retrouvée, et par conséquent, lorsque la dispersion de POSS dans la résine époxy peut être considérée comme étant réalisée à un niveau moléculaire. La présence des agglomérations pour des teneurs plus élevées de TG-POSS et la dégradation concomitante des performances diélectriques pour ces composites (avec 5 ou 10 % en poids) a limité l’exploration des chargements plus élevés en POSS, initialement envisagée pour améliorer encore d’avantage la résistance aux décharges couronne. Par conséquent, un glycidyl-POSS (G-POSS) fortement fonctionnalisé a été choisi pour poursuivre l'étude. Cette fois-ci, il a été montré que les composites à faible teneur en G-POSS ont d’excellentes
propriétés en terme de rigidité diélectrique et des résistances notamment accrues aux décharges couronne. Plus encore, les mêmes composites ont présenté des conductivités thermiques améliorées ainsi que de faibles pertes diélectriques. Globalement, l’ajout de 2,5 % (en poids) de chaque type de POSS dans une matrice d’époxy a été retrouvé comme la valeur optimale en termes de rigidité diélectrique et pour les pertes diélectriques. Pour conclure cette partie de l’étude, des composites époxy avec des teneurs en particules de Glycidyl-POSS beaucoup plus élevés qu’avant (jusqu’à 20 % en poids) ont été investigués et ils ont montré une résistance encore plus élevée aux décharges couronne. Toutefois, pour ce qui est de la conductivité thermique pour les deux types POSS, les composites à faible teneur (2,5 % en poids POSS ou moins) ont vu la plus importante amélioration par rapport au polymère de base. Ce comportement a été investigué en détail plus loin dans ce travail de thèse.
Dans la troisième étape de notre étude, des composites multi-phases ont été produits en utilisant deux types de charges. Ces matériaux contiennent à la fois 1 % (en poids) de POSS et 5 % (en poids) de particules de c-BN, afin d'étudier l'interaction entre le POSS - un composant hybride organique/ inorganique et le c-BN, purement inorganique, dans la matrice organique d’époxy. Les échantillons obtenus ont été comparés en termes de leurs propriétés diélectriques et thermiques à chaque composite individuellement chargé (contenant seulement 1 % en poids POSS ou 5 % en poids de c-BN incorporés dans l’époxy). Cette partie de l'étude a révélé que, même si aucun traitement de surface chimique complexe n’a pas été appliquée pour les particules c-BN utilisées dans notre étude, une dispersion très homogène de ces particules c-BN inorganiques a été retrouvée dans les matériaux multi-phases. Ceci a été considéré comme l’effet de l’ajout de POSS dans la résine, qui semble agir comme un dispersant des charges submicrométriques de c-BN et, cet effet positif sur la dispersion des renforts doit être considéré comme un point d'intérêt majeur dans le domaine des nanodiélectriques ou nanocomposites en général, où la dispersion des charges inorganiques nanométriques dans les polymères est encore un problème courant. En conséquence, la possibilité de concevoir des composites d’époxy combinant le POSS réactive, en même temps que d'autres charges afin d’améliorer leur dispersion dans la matrice d'époxy, représente un résultat qui pourrait contribuer de manière significative à l'avancement de la mise en œuvre des nanocomposites à base d'époxy à l'échelle industrielle. En termes de conductivité thermique ou concernant la rigidité diélectrique, lorsque les deux POSS et les particules de c-BN ont été incorporés ensemble dans le même composite, aucune amélioration n’a pas été observée par rapport à ceux retrouvés auparavant pour les composites ayant 5 % (en poids) de c-BN. En conclusion, on peut affirmer que les composites comportant uniquement les nanoparticules G-POSS possèdent, dans l’ensemble, les meilleures performances diélectriques et ils sont appropriés pour une utilisation dans le domaine de l’isolation haute tension, après avoir montré des pertes diélectriques plus faibles, une plus grande rigidité diélectrique, ainsi qu'une augmentation de la conductivité thermique, par rapport à la résine d’époxy de base.
La dernière partie de ce travail de thèse présente une analyse par éléments finis basée sur le phénomène de transfert de chaleur observé pour les composites POSS. Par conséquent, des simulations 3D du transfert de chaleur par conduction dans les composites d’époxy
sélectionnés ont été développés dans COMSOL Multiphysics en vue d'analyser d’avantage le phénomène de transport de chaleur trouvé pour les matériaux mono ou pluri-composites, étant donné que nos résultats ont montré que les teneurs croissantes en POSS ont conduit à une diminution en termes de conductivité thermique, ce qui est en contradiction avec le comportement suggéré par les lois théoriques des mélanges. L'approche de calcul en utilisant des éléments finis a finalement conduit à la proposition d'un nouveau modèle, apte à expliquer le phénomène de transport de chaleur dans les composites POSS investigués. Basé sur ces résultats, il a été conclu que la nature réactive du POSS, avec ses groupes fonctionnalisés, doit avoir un impact sur la morphologie du réseau/POSS époxy, d'une manière qui améliore le transport des phonons à travers le composite. Cette conclusion a finalement abouti avec la proposition du modèle de restructuration d'interface (IFRM), pour expliquer les résultats particuliers de la conductivité thermique dans les composites en question.
Mots-clés:, comptabilisant, composites époxy, conductivité thermique, nitrure de bore, polymères nanodiélectriques POSS, réponse diélectrique, résistance aux décharges corona, rigidité diélectrique, simulations par Éléments Finis,
INNOVATIVE NANOSTRUCTURED EPOXY COMPOSITES FOR ENHANCED HIGH VOLTAGE INSULATION SYSTEMS
Thomas HEID ABSTRACT
In order to cope with the growing demand in electricity, operating voltages and power ratings have seen an increase in the past years. This means that electro-thermal stresses on the existing electrical insulation systems have increased concomitantly. However, polymeric materials used for high voltage insulation are prone to degradation due to electrical discharges and commonly boast rather low thermal conductivities, which is why there is an impelling need for a new generation of insulating materials with improved dielectric and thermal performances.
During the last decades, attention was drawn towards a novel class of dielectric materials: polymer nanocomposites or nanodielectrics. These dielectrics feature nanometric filler particles instead of micrometric particles, which can lead to significantly enhanced performances - such as improved dielectric breakdown strengths - already at very low contents, thus indicating their great potential for application in HV insulation systems. Nevertheless, such nanodielectrics only unfold their full potential when a good dispersion and distribution of those filler particles within the polymer matrix are achieved. Albeit, clusters of nanoparticles with submicrometric or micrometric dimensions are often found, which is due to the incompatibility of inorganic particles with the organic polymer. Such agglomerations will subsequently cancel the beneficial effect seen for well dispersed nanoparticles. In order to enhance the interaction between inorganic filler particles and organic matrix, and hence, improve the dispersion of such particles in polymers, the functionalization of nanofillers has become rather common. Still, little is known about the long-term stability of such functionalizers under electro-thermal stresses, which poses a drawback to their broad industrial use in high voltage engineering.
The objective of the presented thesis was to develop innovative, nanostructured epoxy composites that reveal enhanced dielectric and thermal performances, and to evaluate their applicability for high voltage insulation systems. In order to achieve an original contribution to the field of nanodielectrics, a novel approach was explored by using functional nanometric additives, so-called polyhedral oligomeric silsesquioxanes (POSS) instead of applying surface functionalization for the filler particles used. Even more, multifunctional nanostructured composites were to be designed, involving functional POSS additives along with thermally conductive filler, to further enhance the thermal conductivity of the resulting composites.
To achieve our objectives, in a first step, epoxy composites with hexagonal boron nitride (h-BN) and cubic boron nitride (c-(h-BN) were developed and analyzed, with filler contents well below the percolation threshold, to find the most promising type of BN filler and its
respective size, to boost thermal conductivity in epoxy composites. In this context, it was shown that incorporation of low weight fractions (≤ 5 wt%), of submicrometric and micrometric h-BN particles in epoxy resin resulted in noticeable improvements in corona resistance and thermal conductivity of the resulting composites. Addition of 5 wt% c-BN in submicrometric particle sizes, however, was found to achieve the most significant improvement of the thermal conductivity compared to the h-BN composites. At the same time, all the BN composites have seen a slight reduction in their dielectric breakdown strength of up to 18 % compared to the base epoxy, which is a common phenomenon observed for the filler sizes used. With the respective breakdown strengths being above 130 kV/mm for the h-BN, and above 170 kV/mm for the c-BN composites, thus still significantly higher than common electric stresses in high voltage insulation systems, the improvements found in the composites’ erosion resistance or thermal conductivity should be granted a higher emphasis.
In a second step, two different types of functional POSS fillers were used to fabricate composites. POSS is a hybrid inorganic/organic material, which has a silica-like core surrounded by functional groups. These functional groups were of reactive nature in the case of the two POSS additives used, and thus, could covalently bond with the epoxy. The first POSS additive was a Triglycidylisobutyl-POSS (TG-POSS) which had 3 functional groups that were compatible with our epoxy system. It was found that the formation of covalent bonds between POSS and the epoxy matrix significantly improved the filler/matrix interaction, and hence, led to significant improvements in dielectric breakdown (BD) strengths and corona resistances for the TG-POSS composites. This was further supported by the superior performances of the lower content composites with 1 and 2.5 wt% of TG-POSS, where no agglomerations were found, and hence, where the dispersion of POSS in the epoxy can be considered to be at a molecular level. The presence of agglomerations for higher TG- POSS contents (with 5 or 10 wt% POSS) and the concomitant deterioration of the dielectric performances for these composites prevented to exploit higher POSS loadings, to further enhance the resistance to corona discharges for instance. Therefore, a highly functionalized Glycidyl-POSS (G-POSS) was chosen to continue with the study. This time around, it was shown that composites with low G-POSS content have excelled in high BD strengths and notably increased resistances against corona discharges, as well as enhanced thermal conductivities and low dielectric losses. Overall, the addition of 2.5 wt% of both types of POSS in epoxy was found to be an optimal value in terms of dielectric strength and losses. Further increase of the Glycidyl-POSS loading would then contribute towards an even higher resistance to corona discharges, whereas in terms of thermal conductivity for both POSS types, the composites with low contents, of 2.5 wt% POSS and below, have seen the most significant enhancements.
In the third step of this study, multiphase composites were produced, which contained both, 1 wt% of POSS and 5 wt% of c-BN particles, in order to investigate the interaction between the hybrid inorganic/organic POSS and the inorganic c-BN. The obtained multiphase samples were compared in terms of their dielectric and thermal properties with the respective single-phase composites, where only 1 wt% POSS or 5 wt% c-BN were incorporated in epoxy. This part of the study revealed that although no complex chemical surface treatment was applied
for the c-BN particles used in our study, yet a homogeneous dispersion of the inorganic c-BN particles was seen in the multiphase composites. This effect of POSS, which was shown to act as a dispersant of the inorganic c-BN filler should be regarded as a major point of interest in nanodielectrics or nanocomposites in general, as the dispersion of nanometric inorganic filler particles within polymers is still a very current problematic. And thus, the approach of formulating epoxy composites combining reactive POSS and other filler particles to improve their dispersion within the epoxy matrix, could significantly contribute to the advancement of the implementation of epoxy-based nanocomposites on an industrial level. In terms of thermal conductivity or breakdown strengths no improvement compared to the 5 wt% c-BN composite was seen, when both POSS and c-BN were incorporated together in a multiphase sample. In conclusion, it can be stated that the G-POSS composites feature the overall best performance of a dielectric material for high voltage insulation, with lower dielectric losses, higher BD strength, as well as increased thermal conductivity, compared to the base epoxy. The last part of this work presents a simulation-based analysis of the heat transfer phenomenon observed for the POSS composites. Therefore, 3D FEM simulations of the conductive heat transfer in selected epoxy composites were conducted in COMSOL Multiphysics, given that our results have shown that increasing POSS contents have led to a decrease in terms of thermal conductivity, which is in contradiction with the behavior suggested by theoretical mixing laws. The FEM computational approach finally led to the proposal of a novel model, which can explain the heat transport phenomenon in the presented POSS composites. The Interfacial Restructuration Model (IFRM) points out that the reactive nature of POSS, with its functionalized groups, must have an impact on the morphology of the epoxy/POSS network, in a way that enhances phonon transport through the bulk composite, thus explaining the particular results of thermal conductivities in the POSS composites in question.
Keywords: Boron nitride, compatibilizer, corona resistance, dielectric breakdown strength, dielectric response, epoxy composites, FEM modeling, polymer nanodielectrics, POSS, thermal conductivity
TABLE OF CONTENTS
Page
INTRODUCTION ...1
0.1 Research objectives and approach ...2
0.2 Specific research objectives & structure of PhD thesis ...2
0.3 Methodology ...4
CHAPTER 1 DIELECTRICS VS. NANODIELECTRICS ...5
1.1 Physical properties of dielectrics for high voltage applications ...5
1.1.1 Thermal properties ... 6
1.1.2 Electrical properties ... 7
1.1.3 Mechanical properties ... 8
1.1.4 Chemical properties ... 8
1.2 From micro to nano – or is it sub-micro really? ...8
1.2.1 When is “nano” really nano? ... 8
1.2.2 Introduction to nanocomposites ... 9
1.3 Theories and models for nanocomposites ...10
1.3.1 Electric double layer ... 10
1.3.2 Intensity model ... 11
1.3.3 Multi-core model ... 12
1.3.4 Water shell model ... 13
1.4 Overview of the impact of nanoparticles on some electrical properties of NC ...14
1.4.1 Impact on AC breakdown strength ... 15
1.4.2 Impact on the resistance to corona discharges ... 15
1.5 Materials Review ...16
1.5.1 Epoxy resins ... 16
1.5.2 Boron nitride ... 20
1.5.3 Polyhedral oligomeric silsesquioxanes (POSS) ... 21
CHAPTER 2 PHYSICAL PROPERTIES OF POLYMER DIELECTRICS ...23
2.1 Electrostatics of dielectrics ...23
2.2 Polarization mechanisms in dielectrics ...24
2.2.1 Electronic or optical polarization ... 25
2.2.2 Atomic or ionic polarization ... 25
2.2.3 Dipolar or orientational polarization ... 26
2.3 Dielectric relaxation in polymers ...26
2.3.1 Complex relative permittivity and the dielectric losses ... 27
2.3.2 Complex permittivity vs. polarization mechanisms in NC ... 29
2.3.3 Dielectric relaxation theory and models ... 30
2.3.4 Dielectric relaxation processes in polymers ... 33
2.4 Conduction mechanisms in polymers ...36
2.4.1 Electronic conduction ... 36
2.4.3 Thermal conduction ... 38
CHAPTER 3 EPOXY/BN MICRO- AND SUBMICRO-COMPOSITES: DIELECTRIC AND THERMAL PROPERTIES OF ENHANCED MATERIALS FOR HIGH VOLTAGE INSULATION SYSTEMS ...41
3.1 Introduction ...41
3.2 Materials and sample preparation ...43
3.3 Experimental methods ...44
3.3.1 Microstructure analysis ... 44
3.3.2 Differential scanning calorimetry ... 44
3.3.3 Dielectric spectroscopy ... 44
3.3.4 AC breakdown strength ... 45
3.3.5 Resistance to electrical discharge ... 45
3.3.6 Thermal conductivity ... 46
3.4 Experimental results and discussion ...47
3.4.1 Microstructure analysis ... 47
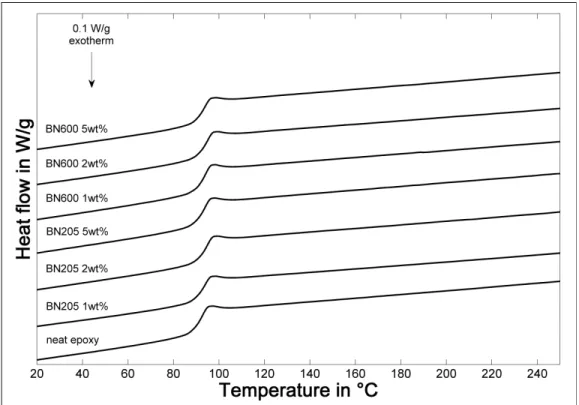
3.4.2 Differential scanning calorimetry ... 47
3.4.3 Dielectric spectroscopy ... 50
3.4.4 AC breakdown strength ... 54
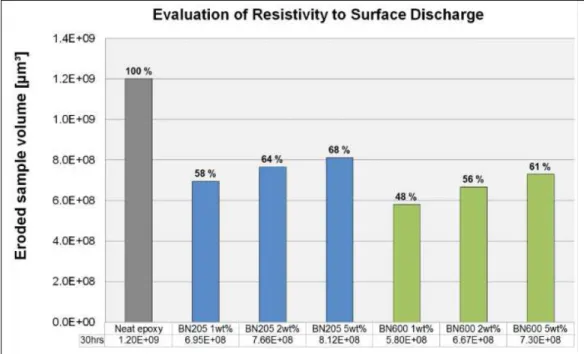
3.4.5 Resistance to electrical discharge ... 56
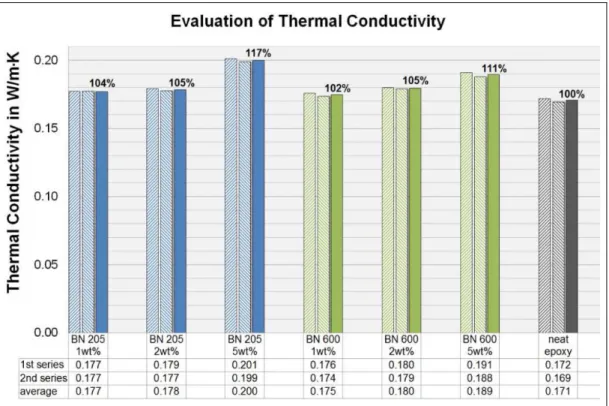
3.4.6 Thermal conductivity ... 58
3.5 Conclusions ...60
3.6 Acknowledgment ...62
CHAPTER 4 NANOSTRUCTURED EPOXY/POSS COMPOSITES: ENHANCED MATERIALS FOR HIGH VOLTAGE INSULATION APPLICATIONS ...63
4.1 Introduction ...64
4.2 Materials and sample preparation ...65
4.3 Experimental methods ...67
4.3.1 Microstructure analysis ... 67
4.3.2 Differential scanning calorimetry ... 67
4.3.3 AC breakdown strength ... 67
4.3.4 Resistance to corona discharges... 68
4.3.5 Thermal conductivity ... 69
4.3.6 Dielectric spectroscopy ... 69
4.4 Experimental results and discussion ...70
4.4.1 Microstructure analysis ... 70
4.4.2 Differential scanning calorimetry ... 70
4.4.3 AC breakdown strength ... 73
4.4.4 Resistance to corona discharge ... 75
4.4.5 Thermal conductivity ... 76
4.4.6 Dielectric spectroscopy ... 78
4.4.7 Relaxation behavior ... 82
4.6 Acknowledgment ...85
CHAPTER 5 ENHANCED ELECTRICAL AND THERMAL PERFORMANCES OF NANOSTRUCTURED EPOXY/POSS COMPOSITES ...87
5.1 Introduction ...88
5.2 Materials and sample preparation ...89
5.3 Experimental methods ...91
5.3.1 Microstructure analysis ... 91
5.3.2 Differential scanning calorimetry ... 91
5.3.3 AC breakdown strength ... 91
5.3.4 Resistance to corona discharges... 92
5.3.5 Thermal conductivity ... 93
5.3.6 Dielectric spectroscopy ... 93
5.4 Results and discussion ...93
5.4.1 Microstructure analysis ... 93
5.4.2 Differential scanning calorimetry ... 95
5.4.3 AC breakdown strength ... 96
5.4.4 Resistance to corona discharges... 98
5.4.5 Thermal conductivity ... 99
5.4.6 Dielectric spectroscopy ... 103
5.4.7 Relaxation behavior ... 106
5.5 Concluding remarks ...109
5.6 Acknowledgment ...110
CHAPTER 6 FUNCTIONAL EPOXY COMPOSITES FOR HIGH VOLTAGE INSULATION INVOLVING C-BN AND REACTIVE POSS AS COMPATIBILIZER ...111
6.1 Introduction ...112
6.2 Materials and sample preparation ...114
6.2.1 Materials ... 114
6.2.2 Compounding ... 115
6.3 Experimental methods ...117
6.3.1 Microstructure analysis ... 117
6.3.2 Dielectric spectroscopy ... 117
6.3.3 Differential scanning calorimetry ... 118
6.3.4 AC breakdown strength ... 118
6.3.5 Thermal conductivity ... 118
6.4 Results and discussion ...119
6.4.1 Microstructure analysis ... 119
6.4.2 Dielectric spectroscopy ... 121
6.4.3 Differential scanning calorimetry ... 122
6.4.4 AC breakdown strength ... 123
6.4.5 Thermal conductivity ... 125
6.5 Concluding remarks ...127
CHAPTER 7 MATHEMATICAL VALIDATION AND ESTIMATION OF
MATERIAL PROPERTIES ...129
7.1 Theoretical models for the complex permittivity of composite materials ...129
7.1.1 Two phase models... 129
7.1.2 Three phase models... 133
7.2 Theoretical models for the thermal conductivity of composite materials ...134
7.3 Comparison of theoretical models with the experimental data ...136
7.3.1 Estimation of the thermal conductivities of h-BN composites ... 136
7.3.2 Estimation of the thermal conductivities of c-BN composites ... 138
7.4 Conclusion on the applicability of mixing laws to estimate material properties ...139
CHAPTER 8 3D FEM MODELING OF THE THERMAL CONDUCTIVITY OF COMPOSITE MATERIALS ...141
8.1 Basics of heat transfer in solids ...142
8.2 Modeling the thermal conductivity of epoxy/c-BN composites ...143
8.3 Unraveling the thermal conductivity of the multiphase and functional POSS composites...148
8.4 Evaluation of POSS’ contribution to the thermal conductivity in the multi-phase composites...149
8.4.1 Simulations based on the assumption that POSS is represented only by its silica core ... 150
8.4.2 Proposal of the Interfacial Restructuration Model (IFRM) for conductive heat transfer in functional POSS composites ... 153
8.4.3 Evaluation of the interfacial restructuration zone (IFRZ) of POSS by means of 3D FEM simulations ... 154
8.4.4 Validation of the proposed model of the interfacial restructuration zones ... 158
8.5 Concluding remarks on the interfacial restructuration zones in functional POSS composites...160
CONCLUSION………..163
RECOMMENDATIONS ...171
APPENDIX I PERSONAL PUBLICATION LIST ...173
LIST OF TABLES
Page
Table 3.1 Specifications for BN filler particles as provided by supplier ...43
Table 3.2 Glass transition temperatures of neat epoxy and the BN composites ...49
Table 3.3 Weibull parameters obtained from Figure 3.9 ...55
Table 4.1 Glass transition temperatures of neat epoxy and TGIB-POSS composites...72
Table 4.2 Weibull parameters obtained from Figure 4.5 ...74
Table 4.3 Activation energies obtained by fitting the β-relaxation process...84
Table 5.1 Overview and nomenclature of prepared samples ...90
Table 5.2 Glass transition temperatures Tg of test specimens ...95
Table 5.3 Weibull parameters from the breakdown experiment ...97
Table 5.4 Evaluation of the eroded sample volumes after exposure to corona discharges and the respective relative resistances against corona discharges of the composites compared to NE ...99
Table 5.5 Evaluation of thermal conductivity measurements ...100
Table 5.6 Activation energies obtained by fitting the β-relaxation process...108
Table 6.1 Overview and nomenclature of prepared samples ...115
Table 6.2 Glass transition temperatures Tg of test specimens ...122
Table 6.3 Weibull parameters from the breakdown experiment ...124
Table 6.4 Evaluation of thermal conductivity measurements ...126
Table 7.1 Parameters for the comparison between the theoretical mixing laws and the experimental data for the h-BN sample series ...138
Table 7.2 Parameters for the comparison between the theoretical mixing laws and the experimental data for the c-BN sample series ...139
Table 8.1 Resulting thermal conductivities obtained by COMSOL simulations (coherent results are highlighted in green, unmatched results in orange) ...145
Table 8.2 Comparison of simulation results with the experimental value for the thermal conductivity in the case of cBN 5wt% with clusters of c-BN particles (coherent results are highlighted in green, unmatched
results in orange) ...146 Table 8.3 Overview of the sample natures and the respective measured
thermal conductivities in case of cBN 5wt% and the two
multiphase samples ...148 Table 8.4 Simulation results of bulk thermal conductivity for the MP composite
(right column) as a function of a variation in the matrix’ thermal conductivity (left column). The values for λmatrix which will lead
to the measured values of λMP composite are highlighted in green ...151
Table 8.5 Simulation parameters and resulting thermal conductivities for the GP 1wt% composite, where POSS was embodied by 9 silica
spheres (unmatched results highlighted in orange) ...152 Table 8.6 The calculated bulk thermal conductivities of GP 1wt% in W/m·K
as a function of the interfacial restructuration zone’s λIFRZ and its
radius around the silica core. Possible combinations of λIFRZ and
its radius giving the same bulk thermal conductivity as measured
for GP 1wt% are highlighted in green ...157 Table 8.7 Final results of the COMSOL simulations on the bulk thermal
conductivity of the G-POSS composites showing matching
parameter combinations for the IFRZs ...158 Table 8.8 Final results of the COMSOL simulations presenting the matching
combinations of IFRZ parameters to achieve a λmatrix =0.166
W/m·K by incorporation of 1wt% G-POSS in the multiphase
LIST OF FIGURES
Page Figure 1.1 Illustration of increasing dominance of interfacial areas with
decreasing filler sizes
Taken from Andritsch (2010, p. 3) ...9 Figure 1.2 A schematic of the electrical double layer surrounding a particle
Taken from Andritsch (2010, p. 35) ...11 Figure 1.3 Change of intensities Iα defining phases A and B over the distance
across the interface
Taken from Lewis (2005, p. 203) ...12 Figure 1.4 Illustration of the multi-core model for polymeric NC
Taken from Tanaka et al. (2005, p. 674) ...13 Figure 1.5 Water shell model with quasi DC (QDC) conduction
(a) no overlapping water shells (b) overlapping water shells
Adapted from Zou et al. (2008, p. 114) ...14 Figure 1.6 Relative impact on various nanofillers on the ACBD strength of
polymer NCs compared to the base polymers
Taken from David and Fréchette (2013, p. 31) ...15 Figure 1.7 Simple molecule of diglycidyl ether of bisphenol A with two epoxide
groups ...17 Figure 1.8 Basic processing schematic for epoxy based composites ...19 Figure 1.9 Different crystal structures of boron nitride
Taken from Haubner et al. (2002, p. 6) ...20 Figure 1.10 (a) shows a typical POSS molecule with the inorganic silica-like
core and the organic side-groups “R” which are depending on the respective POSS-type; (b) and (c) show the proposed interaction with POSS and the epoxy matrix, rendering the amorphous epoxy
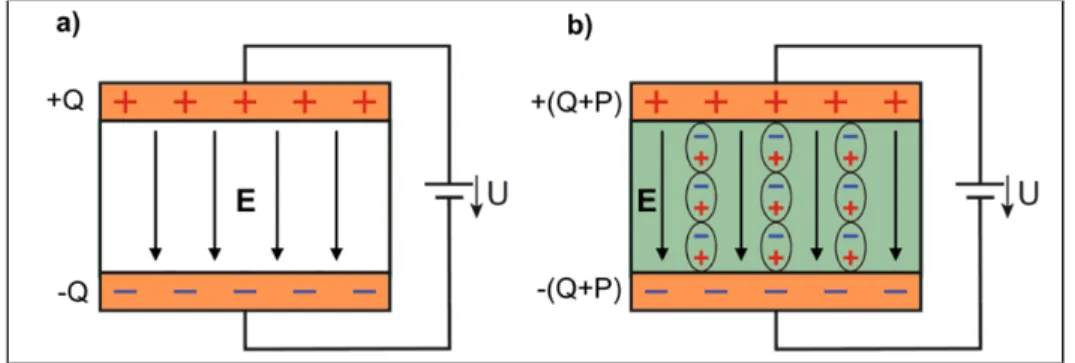
resin (b) into a structured composite on a nanometric scale (c) ...21 Figure 2.1 Polarization charges on a parallel plate condenser; a) with vacuum
and b) with a dielectric medium between the plates ...23 Figure 2.2 Polarization mechanisms in dielectrics ...25
Figure 2.3 Dielectric between two electrodes forming a condenser (left) and the phase diagram of a complex current through the dielectric due to an applied AC voltage (right) ...27 Figure 2.4 Frequency dependent polarization mechanisms
Taken from Andritsch (2010, p. 147) ...30 Figure 2.5 Schematic of dielectric relaxation processes observable in polymers
(left) and their temperature dependence (right) ...34 Figure 2.6 Relaxation map showing the dielectric losses (ε′′) and the relaxation
phenomena of neat epoxy as a function of frequency and temperature ...36 Figure 2.7 Schematic of heat transfer by phonons in amorphous dielectrics. A
phonon moves along a polymer chain until reaching its end, where phonon scattering occurs, resulting in reduced bulk thermal
conductivity of the polymer ...39 Figure 3.1 Schematic of surface erosion setup ...46 Figure 3.2 Schematic of heat flow meter setup ...47 Figure 3.3 SEM micrographs of epoxy/BN composites a) BN205 1wt%,
b) BN205 2wt%, c) BN205 5wt%, d) BN600 1wt%, e) BN600 2wt%, f) BN600 5wt% ...48 Figure 3.4 DSC graphs from the second thermal cycle for neat epoxy and the BN
composites...49 Figure 3.5 3D plots of dielectric losses for all samples measured at either 3 or
500 V, showing the main relaxation phenomena. BN composites revealed lower dielectric losses at high temperatures and low frequencies with increasing filler loadings. Electrode polarization (EP) due to a delay in charge transport at electrode-composite
interfaces could additionally be detected for all samples ...51 Figure 3.6 Dielectric response of neat epoxy and BN composites measured at
3 V and 20 °C; a) real part and b) imaginary part of the complex
permittivity ...52 Figure 3.7 Neat epoxy temperature dependent real part (a), imaginary part (b) of
complex permittivity and (c) loss tangent ...53 Figure 3.8 BN205 5wt% temperature dependent real part (a), imaginary part (b)
of complex permittivity and (c) loss tangent ...53 Figure 3.9 Weibull plots of breakdown strengths with 95 % confidence intervals ...55
Figure 3.10 Schematic evolution of the microstructure in epoxy resin with
increasing filler and subsequently defect contents ...57 Figure 3.11 Comparison of eroded sample volume after exposure to partial
discharges for 30 hours at 4 kVRMS and 300 Hz ...57
Figure 3.12 Comparison of thermal conductivities; two measurements were taken on each sample type. The comparison of thermal conductivity was
based on the average value for each ...59 Figure 4.1 Proposed reaction of TGIB-POSS with curing agent and epoxy resin
with the formation of covalent bonds, and hence, forming a
nano-structured epoxy/POSS network ...66 Figure 4.2 Schematic of point-to-plain setup for corona resistance experiment ...68 Figure 4.3 SEM micrographs with increasing magnification from left to right,
for a) neat epoxy, b) ePOSS 1wt%, c) ePOSS 2.5wt%, d) ePOSS
5wt% and e) ePOSS 10wt% ...71 Figure 4.4 Overlaid DSC curves from the second thermal cycles ...72 Figure 4.5 Weibull plot of breakdown data with 95 % confidence intervals ...74 Figure 4.6 Evaluation of resistance to electrical discharges based on eroded
sample volume after 30 hours of exposure to PD ...76 Figure 4.7 Evaluation of thermal conductivities for the test specimens, with the
first and second measurement series plotted as dashed columns and
the respective average values in solid columns ...77 Figure 4.8 Dielectric responses at 20 °C and 1 V of neat epoxy and the TGIB-
POSS composites; a) real parts and b) imaginary parts of the
complex permittivities ...79 Figure 4.9 Temperature-dependent real part (left column) and imaginary part
(right column) of complex permittivity for a) neat epoxy, b) ePOSS 1wt%, c) ePOSS 2.5wt%, d) ePOSS 5wt% and e)
ePOSS 10wt% ...81 Figure 4.10 Relaxation time plots of the β relaxation process ...83 Figure 5.1 Structure of a Glycidyl-POSS molecule in its cage-form (with 8
epoxy groups) reacting with the curing agent and the epoxy resin (top) to form a nano-structured epoxy/POSS composite due to the
Figure 5.2 Schematic of the erosion setup used (on the left) and a typical 3D erosion pattern retrieved on a NE sample (right) viewed from the top. The original sample surface is colored in red, and the zones
with the deepest erosion traces are represented in blue ...92 Figure 5.3 SEM micrographs of the samples at a magnification of x200k
(upper six images) and a TEM image showing a zoom on one crystalline structure found in the GP 20wt% composites (bottom right), which itself consists of several hexagonal substructures. The crystalline structures had sizes starting
from just a few nanometers up to some hundreds of nanometers ...94 Figure 5.4 Weibull plot of the breakdown data with 95 % confidence intervals ...97 Figure 5.5 Evolution of the thermal conductivity for the POSS composites
as estimated with mixing laws, compared to experimental values. While the calculations result in a continuously increasing thermal conductivity with increasing POSS content, the experimental
values show a logarithmic decrease ...102 Figure 5.6 Dielectric response of NE and the POSS composites for a) 20°C,
b) 60°C and c) 100°C ...104 Figure 5.7 Relaxation maps of the dielectric losses as a function of applied
frequency and temperature; for a) NE, b) GP 2.5wt% and c)
GP 20wt% ...106 Figure 5.8 Relaxation time plots of the β-relaxation process ...108 Figure 6.1 Proposed reaction of the two different POSS types with curing
agent and epoxy resin, TG-POSS (left) with the three epoxy groups and the G-POSS (right) with the cage structure represented for the case of R=8 epoxy groups. The formation of covalent bonds between POSS and epoxy matrix results in
nano-structured epoxy/POSS networks ...114 Figure 6.2 Micrographs of the composites captured at different
magnifications: (a) G-POSS, (b) TG-POSS, (c) cBN,
(d) MP/G-POSS and (e) MP/TG-POSS ...120 Figure 6.3 Dielectric response of test specimens at 20 °C and 1 V; (a)
real part of complex permittivity, (b) imaginary part of
complex permittivity and (c) the resulting loss tangent ...121 Figure 6.4 Weibull plot of the breakdown data with 95 % confidence intervals ...124
Figure 7.1 (a) Single spherical inclusion within a medium to develop Maxwell’s equations for mixtures (b); the small inclusions in (b) are the same as the inclusion shown in (a)
Adapted from Kremer (2003, p. 89) ...130 Figure 7.2 Comparison of thermal conductivities between the experimental
data obtained for the submicrometric BN205 sample series and the
theoretical mixing laws ...137 Figure 7.3 Comparison of thermal conductivities between the experimental
data obtained for the micrometric BN600 sample series and the
theoretical mixing laws ...137 Figure 7.4 Comparison of thermal conductivities between the experimental
data obtained for the submicrometric c-BN sample series and the
theoretical mixing laws ...138 Figure 8.1 Geometries for the cases of a) neat epoxy, b) cBN 1wt% and c)
cBN 5wt% ...143 Figure 8.2 The defined boundary conditions for the models, here in case of
cBN 1wt%. The temperature difference over the sample volume will cause a heat flow from top to bottom of the model. The heat flux out of the unit cell with 2 µm side lengths was defined zero
(qx = qy = 0) ...144
Figure 8.3 Micrograph of the cBN 5wt% sample (with increasing magnification from left to right) showing that the c-BN particles were not well dispersed in the matrix, but
formed clusters with c-BN agglomerations ...146 Figure 8.4 New geometries for the cBN 5wt% sample with a) small distance
between the particles, b) an agglomerated “X” structure and c) an
agglomerated “┼” structure ...146 Figure 8.5 Scenario with 8 unit cells (cases b) and c) in equal numbers),
representing a random structure of cBN 5wt% ...148 Figure 8.6 Microstructures of a) cBN 5wt%, b) MP/G-POSS and c)
MP/TG-POSS. In the two MP samples a clearly improved
dispersion of the c-BN particles resulted ...149 Figure 8.7 The geometry for the calculation of the thermal conductivity of
GP 1wt%, with G-POSS represented by 9 well dispersed
Figure 8.8 Schematic to explain the enhanced phonon transport in POSS composites compared to neat epoxy, caused by an interfacial restructuration of the polymeric network due to covalent
bonding between epoxy and POSS ...154 Figure 8.9 Different geometries used for the simulations of the impact
of the IFRZ on the thermal conductivity of GP 1wt%, showing the varying size of the IFRZ for a) no IFRZ
at all (0 nm), b) with a 3 nm and c) with a 5 nm IFRZ ...155 Figure 8.10 Computed bulk thermal conductivity of the GP 1wt%
composite as a function of radius and thermal conductivity of the IFRZs. The dashed red line shows the experimental value of the GP 1wt% composite, whichis the desired bulk thermal
conductivity for our model cases ...156 Figure 8.11 The final geometries for the cases of a) GP 5wt%, b) GP 10wt%
and c) GP 20wt% with the IFRZ sizes that gave the matching
LIST OF ABBREVIATIONS
AC Alternating current
BD Breakdown
BDS Broadband dielectric spectroscopy
BN Boron nitride
c-BN Cubic boron nitride
DC Direct current
DGEBA Diglycidyl ether of bisphenol A
DSC Differential scanning calorimetry G-POSS Glycidyl-POSS
h-BN Hexagonal boron nitride
HV High voltage
IFRM Interfacial Restructuration Model
IFRZ Interfacial restructuration zone NC Nanocomposite
PD Partial discharge
POSS Polyhedral Oligomeric SilSesquioxanes SEM Scanning electron microscopy
TEM Transmission electron microscopy Tg Glass transition temperature
TGIB-POSS Triglycidylisobutyl-POSS TG-POSS Triglycidylisobutyl-POSS
INTRODUCTION
Insulating systems are a key part of any high voltage (HV) apparatus used in power generation, energy transformation and energy transportation. Bushings, rotating machines, spacers and cable terminations are only some examples of applications that require well designed and reliable insulating systems. In an ongoing effort to make power systems more reliable, sustainable, as well as meeting the growing demand in electricity, changes in the existing insulating materials are inevitable. However, most of the organic materials used for high voltage insulation like, e.g. epoxy resins, are prone to degradation due to electrical discharges and usually feature rather low thermal conductivities. Further, considering the increasing electro-thermal stresses on electrical insulation systems due to growing operating voltages and power ratings, there is an impelling need for a new generation of insulating materials with improved dielectric and thermal performances.
In the past, the above mentioned deficient properties of HV insulating materials have been counteracted by the addition of micrometric inorganic filler materials, e.g. silica, which can render the resulting microcomposites more resilient to electro-thermal stresses and improve parameters such as thermal conductivity and erosion resistance.
During the last decade though, much has been reported about a novel class of dielectric materials: the so-called polymer nanocomposites or nanodielectrics, featuring nanometric filler particles (Fabiani et al., 2010; Fréchette et al., 2001; Iyer et al., 2011; Krivda et al., 2012; Tanaka et Imai, 2013). However, such nanodielectrics only unfold their full potential when good dispersion and distribution of those filler particles within the matrix are achieved. Albeit, due to the incompatibility of inorganic particles with the organic polymer, dispersion and distribution are regularly compromised, resulting in agglomerations of nano particles, often leading to aggregates with submicrometric or micrometric dimensions.
In order to enhance the interaction between inorganic filler particles and the organic matrix, and hence, improve the dispersion of such particles in polymers, the functionalization of
nanofillers has become rather common. Surface treatments with coupling agents such as silane (Dongling et al., 2005b; Huang et al., 2012; Preda et al., 2013), or more complex processes, like grafting organic brushes on particle surfaces (Virtanen et al., 2014), have been explored with varying success in the past. Still, little is known about the long-term stability of such functionalizers under electro-thermal stresses, which might pose a drawback to a broad industrial use in high voltage engineering. For example, when the surface functionalization was conducted just by surface coating of the filler particles, thermal degradation of the used agents, and hence, the loss of the compatibilizing effect has been shown by (Wen et Ding, 2004) and by (Vahid, Mostafa et Pascal, 2012). In the latter case, the degradation of the surface coating occurred during polymer processing.
0.1 Research objectives and approach
In this context, my PhD was started in May 2012 as a part of a bigger research project, called “recherche et développement cooperative” (RDC), in collaboration between École de
Technologie Supérieure (ETS) and Hydro Québec’s Research Institute (IREQ), aiming to
tailor the dielectric and thermal properties of polymer composites by nanostructuration. In this framework, the objective of my thesis was to develop innovative, nanostructured epoxy composites that reveal enhanced dielectric and thermal performances, and to evaluate their applicability for high voltage insulation systems. Due to the above mentioned reasons of thermal degradation of common surface treatments, a novel approach was explored by using functional fillers, instead of applying surface functionalization for the used filler particles.
0.2 Specific research objectives & structure of PhD thesis This PhD project was divided into three main steps:
In the first step, hexagonal boron nitride (h-BN) and cubic boron nitride (c-BN) with submicrometric and micrometric particle sizes are used to fabricate epoxy/BN composites with improved thermal conductivities. The results of this part led to the publication of Article I (Chapter 3) and two conference papers (Heid et al., 2013a; Heid et al., 2013b).
In the second step, nanostructured epoxy/POSS (Polyhedral Oligomeric Silsesquioxanes) composites are fabricated, using various reactive liquid POSS additives, which are compatible with our used epoxy system. Accordingly, the filler can form covalent bonds with the epoxy matrix, which is supposed to change the morphology of the epoxy by increasing the order locally, and consequently, structure the epoxy network on a nanometric scale. The findings of this part were published in Article II (Chapter 4) and Article III (Chapter 5) as well as in multiple conference papers (Heid, Fréchette et David, 2013; Heid, Fréchette et David, 2014b; 2014c).
For all of the retrieved epoxy/POSS and epoxy/BN composites, the dielectric and thermal properties are evaluated for various filler types and concentrations, in order to find the most promising constituents and their optimal concentrations for designing multiphase composites in the third step.
In the third and final step, novel nanostructured multiphase epoxy composites featuring both POSS and BN are designed and characterized. These materials were expected to have both enhanced dielectric and thermal properties due to the impact of both fillers. Considering that the incorporated POSS is forming covalent bonds with the epoxy matrix, the additional BN filler will now be integrated in an organized and structured epoxy/POSS network instead of an amorphous epoxy. This change in morphology and the polymer chain structure is assumed to affect the interaction of BN with the network. Based on this, we aimed on achieving a synergetic effect, where the hybrid POSS with its inorganic core and the organic side-groups could act like a functionalizing agent, and thus, improve the integration of BN in the epoxy/POSS matrix. The conclusions found for this part were published in Article IV (Chapter 6) and in one conference paper (Heid, Fréchette et David, 2015a).
Subsequently, the aim of this PhD project is to design and analyze innovative nano-structured multiphase epoxy composites, which should take advantage of the specific features of both POSS and BN as filler materials, thus exhibiting improvements such as reduced degradation due to electrical discharges and enhanced thermal conductivities.
0.3 Methodology
In order to evaluate the potential of our created composites for industrial use in HV insulation systems, all single filler and multiphase composites are characterized by means of broadband dielectric spectroscopy (BDS), AC breakdown testing, surface erosion due to partial discharges and thermal conductivity measurements.
Thermal analysis like Differential Scanning Calorimetry (DSC) will give deeper insights on the materials morphology and reticulation states of our composites, while chemical analysis like Fourier Transform Infrared Spectroscopy (FTIR) will help understand changes of dielectric properties due to chemical processes and changes of the composites’ chemistry due to the subjected treatments.
In addition, morphological investigations will help to understand the achieved results of incorporating the various fillers in epoxy, by revealing the intrinsic structures of the composites. Therefore Scanning Electron Microscopy (SEM), Transmission Electron Microscopy (TEM) and Atomic Force microscopy (AFM) are used. In some special cases, more specifically for the POSS composites, X-Ray Diffraction spectroscopy (XRD) is used to assess the level of molecular dispersion of the POSS additives in the respective composites.
Finally, analytical and numerical modelization based on the finite element method (FEM) will be conducted, to further understand the underlying heat transfer mechanisms observed for our composites.
CHAPTER 1
DIELECTRICS VS. NANODIELECTRICS
Insulation is a key part of any electrical insulation system and therefore of any high voltage equipment. Per definition, an electrical insulation system is an “Insulating structure
containing one or more electrical insulating materials (EIM) together with associated conducting parts employed in an electrotechnical device.” according to the IEC 62332-1
standard. Due to the technical development towards higher electrical field strengths and frequently concomitant increased thermal loads, improved materials are needed to meet the demands. Consequently this embodies a continuous point of interest in research in order to achieve better performances and longer lifetimes. There are three basic groups of electrical insulating materials, also called dielectrics:
• solid dielectrics; • fluid dielectrics;
• and gaseous dielectrics.
Common solid dielectrics, along numerous types of polymers (e.g. epoxy resin, PE), are ceramics and glass. Well known representatives of fluid dielectrics would be mineral oils and more recent their biodegradable pendants, whereas air is probably the most common gaseous dielectric in high voltage power transmission and distribution grids besides various other gases like SF6.
1.1 Physical properties of dielectrics for high voltage applications
During operation, an electrical insulation system can be exposed to several kinds of stress factors, which can be of thermal, electrical, ambient and mechanical nature, often referred to as the “T.E.A.M.” stresses, each leading to corresponding ageing mechanisms. Accordingly,
the functionality of insulation systems can generally be characterized by four main categories of material’s properties: • thermal properties; • electrical properties; • mechanical properties; • chemical properties. 1.1.1 Thermal properties
A known limiting factor for high voltage insulation systems is their thermal conductivity. If the heat generated, mainly due to Joule heating in conducting parts, cannot be dissipated properly, it causes an increase of the temperature in the insulation system. With such an increase in temperature, the thermal degradation, and hence the ageing process, is accelerated, leading to shorter lifetimes of polymeric insulation materials according to the Arrhenius model given by
= (1.1)
where L is the lifetime in hours, L0 a material specific constant, E the activation energy in eV,
R the universal gas constant and T the temperature in Kelvin. Additional information on the
topic of thermal ageing in electrical insulation can be found in literature, e.g. (Mazzanti, Montanari et Motori, 1994).
A crucial temperature for polymeric materials, and especially for epoxy resins, is given by their glass transition temperature Tg. When the temperature of an epoxy-based insulation
system exceeds its Tg, the insulating material experiences a permanent weakening of both,
mechanical and electrical strengths. Accordingly, the optimal operating temperatures of apparatus with epoxy-based insulation systems lie well below their Tg.
Furthermore, the thermal stability of the insulation systems’ properties is an important parameter as well. In this aspect epoxy resins are known to have comparably stable electrical properties below their glass transition temperatures (Arora et Mosch, 2011).
1.1.2 Electrical properties
Obviously, the electrical or dielectric properties are amongst the most important parameters for electrical insulating materials. The specific resistivity is a basic parameter of an electrical insulator, since it defines the ability of a material to prevent electric currents from passing through it and lies in the range of 1016 Ωm for epoxies in high voltage applications. Its inverse value, the specific conductivity, thus ranges around 10-16 S/m. For some particular applications like field grading systems, higher values of the specific conductivity or non-linear conductivity behaviors might be required.
Additionally, the dielectric breakdown strength (in kV/mm) is another important aspect of insulating materials. It describes the maximum electric field strength a material can withstand without having an intrinsic breakdown (BD) and therefore losing its ability to prevent an electric current from flowing. The BD strength of dielectrics strongly depends on the thickness of the material and generally decreases with increasing thickness. In literature, this dependency is described by an empiric inverse power law (Chen et al., 2012):
( ) = (1.2)
with EBD, the electric field strength applied at breakdown, as a function of the thickness d and the empiric materials constants k and n.
Another parameter which is very important in describing dielectric material is the complex permittivity ε* which will be treated in more detail in chapter 2.3. Besides those already mentioned parameters, the resistance to erosion due to partial discharge and the resistance of materials to electrical treeing represent two additional crucial features of dielectrics.
1.1.3 Mechanical properties
Depending on the application, mechanical properties like the mechanical strength of dielectric material can be of importance as well. In case of epoxy, winding insulations of electric machines would be a prominent example of an application where high mechanical stresses act on the insulation system during operation and especially during transient states.
Based on the application for which the dielectric material is used, it is always of importance to find an adequate balance between rigidity and flexibility of the insulation system, according to possible stresses during operational states.
1.1.4 Chemical properties
Further important properties for dielectrics are their resistance to environmental (ambient) aspects, like UV radiation or air pollution for outdoor insulators, as well as hydrophobicity. In some applications the chemical resistance to degradation due to reactants caused by partial discharge (PD), for instance in gas insulated lines (GIL) filled with SF6 gas, embodies one more point of interest for insulating materials (Küchler, 2009).
1.2 From micro to nano – or is it sub-micro really? 1.2.1 When is “nano” really nano?
Nanodielectrics are commonly defined as electrical insulation materials, with incorporated fillers of particle sizes in the range of some tens of nanometers, forming structures of less than 100 nm in one dimension. Composites showing dimensions above 100 nm up to 500 nm are specified as mesocomposites and those with internal structures exceeding 500 nm are considered microcomposites.
1.2.2 Introduction to nanocomposites
It is commonly agreed today that the key point for the improved or altered properties of nanocomposites (NC) lies within the particle-host interfaces (Fréchette, 2009; Lewis, 2005; Nelson et Hu, 2005; Raetzke et Kindersberger, 2006; Roy et al., 2005), which become more and more prominent with decreasing filler sizes (see Figure 1.1). Those interfacial layers, or interaction zones are estimated to be of approximately 10 nm thickness around the particle surfaces, and possibly more if certain prerequisites are met (Lewis, 2004). Models like the “Multi-Core Model” of Tanaka et al. (Tanaka et al., 2005), the “Polymer Chain Alignment Model” of Andritsch et al. (Andritsch et al., 2011) or the “Overlap Model” of Preda et al. (Preda et al., 2014) try to predict the properties of NC or explain their structural composition, respectively.
Figure 1.1 Illustration of increasing dominance of interfacial areas with decreasing filler sizes
Taken from Andritsch (2010, p. 3)
Often, such nanocomposites expose very distinct properties which cannot easily be explained and might derive from the characteristics of their meso- and microscopic pendants, respectively. The origins of those comportments are thought to be due to several factors (Nelson, 2010; Roy et al., 2005):
• the large surface area of nanoparticles;
• a reduction in the internal field caused by the decrease in size of particles; • change in space charge distribution;
• scattering mechanisms.
In addition many other aspects like filler size, aspect ratio, dispersion and distribution of introduced particles in the polymer matrix, may strongly affect the resulting composites’ electric, dielectric, thermal as well as mechanical parameters.
The polymeric matrix in NC can be of diverse origin: rubbers, Polyethylene and epoxy resins, to name just a few important polymeric materials in electrical insulation engineering. This thesis focuses on epoxy based composites and their characteristics, although many of the following properties and models are generally applicable to polymeric NCs.
1.3 Theories and models for nanocomposites
Several models for describing the special dielectric characteristics of NC exist, all of them stressing the importance of the particle-matrix interface. But as there are still many unknowns to be understood, probably none of these following models can claim to fully explain all processes in NC.
1.3.1 Electric double layer
The electric double layer introduced by Lewis (Lewis, 2004) describes a coulombic interaction between a filler particle and the surrounding polymer matrix. It consists of two layers (see Figure 1.2) formed at the particle-host interface, the inner Stern layer where ions are bound to the particle surface and the outer layer, also called diffuse Gouy-Chapman layer, which represents a diffuse region where the charge decreases exponentially with the distance from the particle.
Any ions beyond the so called slipping plane are not affected by the charges surrounding the particle. The electric double layer forms a long distance dipole, with a slow time response,
which affects electrical conduction and dielectric properties in the low frequency domain. Regarding the triboelectric series, epoxy resins tend to get negatively charged (Andritsch, 2010; Nelson, 2010).
Figure 1.2 A schematic of the electrical double layer surrounding a particle
Taken from Andritsch (2010, p. 35) 1.3.2 Intensity model
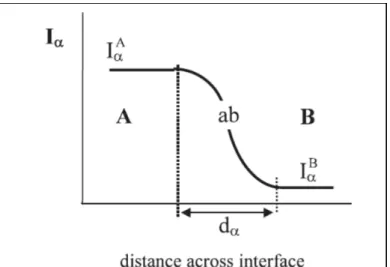
Proposed by Lewis in 2005 (Lewis, 2005), the intensity model is built on the idea that a material property α embodied by its intensity Iα can only change gradually with the distance
over an interfacial area between two different phases (see Figure 1.3), meaning there are no abrupt boarders for those properties. The intensity Iα does not necessarily have to stay between the values for phases A and B, but can reach intensities exceeding or even deceeding both of those values, depending on the nature of the phases.
Atoms along with molecules located in this interfacial area interact with their surrounding media via short and long ranged forces. This model provides only a general view on the impact of nanoscale fillers on macroscopic composites.
Figure 1.3 Change of intensities Iα defining phases
A and B over the distance across the interface Taken from Lewis (2005, p. 203) 1.3.3 Multi-core model
The multi-core model developed by Tanaka et. al (Tanaka et al., 2005) is a theoretical approach to explain the possible interactions of filler particle and matrix. It is based on a three layer geometry (see Figure 1.4), which are overlapped by a fourth, the electric double layer (as described in paragraph 1.3.1):
Bonded layer:
This is a transition layer physically bonded to the particle surface, approximately of 1 nm thickness. It is formed by ionic, covalent, hydrogen and Van-der-Waals bindings (with strength decreasing from first to last).
Bound layer:
Interfacial region between a layer of polymer chains strongly bound to the first layer, as well as the surface of the inorganic particle. A perpendicular alignment of surrounding polymer chains to the filler surface results in a rather structured morphology, and therefore affects the mobility of polymer chains in the proximity of filler particles. The thickness of this layer is assumed to measure between 2 and 9 nm.
Loose layer:
Measuring several tens of nm, this layer is supposed to be loosely coupled with the second layer, consisting of polymer chains with affected morphology due to the presence of the inorganic filler, leading to changes in chain formations and mobility, as well as free volume or crystallinity.
Figure 1.4 Illustration of the multi-core model for polymeric NC Taken from Tanaka et al. (2005, p. 674)
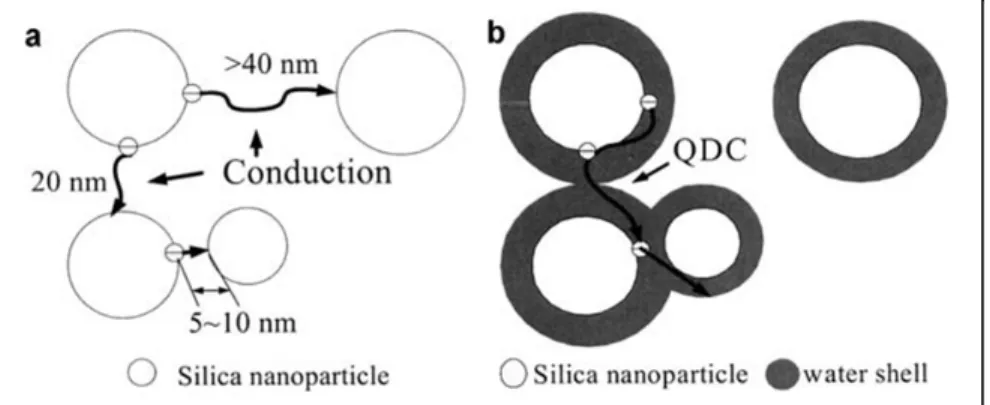
1.3.4 Water shell model
The water shell model (Figure 1.5) as proposed by Zou et al. (Zou, Fothergill et Rowe, 2008) considers water absorption in the interfacial areas between filler particles and polymer. It suggests that water is primary existing in the second layer shown in the multi-core model (see chapter 1.3.3) providing conductive paths (see Figure 1.5b) compared to a polymer with “dry” filler particles (see Figure 1.5a). In the case of dry nanoparticles, and hence, without water shells, no conductive pathways will be formed through the bulk composite. Once enough water is adsorbed by hydrophilic nanoparticles (like silica) though, overlapping water shells will provide conductive pathways for charges, and thus, quasi DC behavior will result at low frequencies.
Figure 1.5 Water shell model with quasi DC (QDC) conduction (a) no overlapping water shells (b) overlapping water shells
Adapted from Zou et al. (2008, p. 114)
1.4 Overview of the impact of nanoparticles on some electrical properties of NC Using nanometric filler particles instead of micrometric particles was found to lead to significantly enhanced performances of the resulting composites, such as improved dielectric breakdown strengths for instance, already at very low contents. Considering that the incorporation of micrometric filler particles in polymer matrices usually causes a diminishment in dielectric strength, it is evident that nanodielectrics have a great potential for application in HV insulation systems.
When inorganic nanoparticles are incorporated in a polymer matrix, the electric field distortion in the bulk composite around these particles, which arises due to the mismatch in permittivity between the polymer and the inorganic filler, will be less pronounced, because of the smaller sizes of nanoparticles compared to their micrometric counterparts. Thus, leading to more homogeneous electric field stresses over the bulk composite compared to the case when micrometric particles are involved. This, however, only holds for well dispersed nanoparticles, as in the case of agglomerated clusters of nanoparticles this beneficial size effect will get lost. In the following paragraph a comprehensive review on specific improvements of dielectric properties is presented, which were achieved by incorporation of nanometric fillers in polymers like epoxy resin or polyethylene.
1.4.1 Impact on AC breakdown strength
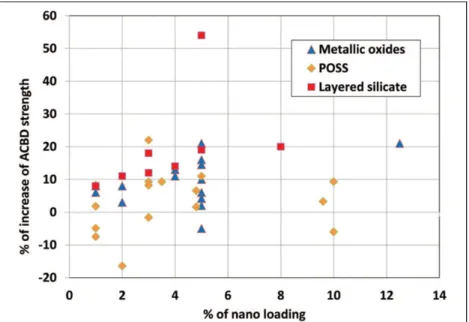
In Figure 1.6, an illustration by David and Fréchette (David et Fréchette, 2013) is presented, which gives an overview of the relative improvements in AC breakdown (ACBD) strengths of NCs reported in literature. It summarizes the effects on ACBD strength of metallic oxides, such as silica and titanium dioxide, or POSS along with layered silicates, when such fillers were incorporated in a polymer matrix. It can be seen, that low contents of metallic oxides and layered silicates, below 5 wt%, have resulted in increased ACBD strengths of the respective NC by up to 20 % compared to the base polymers. Higher nanofiller loadings would usually show no additional improvement. This might be attributable to the formation of agglomerates of micrometric dimensions for such high loadings of nanoparticles, subsequently counteracting the beneficial effect found for low contents of nanoparticles.
Figure 1.6 Relative impact on various nanofillers on the ACBD strength of polymer NCs compared to the base polymers
Taken from David and Fréchette (2013, p. 31) 1.4.2 Impact on the resistance to corona discharges
The resistance to corona discharges or partial discharges in general is one of the key factors for a HV insulation material. Volumetric replacement of the organic polymer by inorganic
materials, such as micrometric silica for instance, was commonly applied in the past to render the composite more resilient to electrical discharges, as the inorganic particles act like a shield towards the electrical discharges, and thus, protect the organic matrix from degradation due to the highly energetic discharges. However, due to the micrometric size of these particles, often a decrease in BD strength would concur. Therefore, nanofillers have come to interest to improve polymer composites’ resistance to electrical discharges, without causing a diminishment in dielectric breakdown strength at the same time, as it was discussed before.
It was shown by (Iyer, Gorur et Krivda, 2012) that the corona resistance for samples containing 5 wt% of nano-silica would result in erosion depths half as profound as measured for neat epoxy. In the same time, the composites with 5 wt% nano-silica performed slightly better than composites involving 65 wt% of micrometric silica particles. It was further pointed out, that a combination of 62.5 wt% micrometric and 2.5 wt% nanometric silica resulted in the best resistance to corona discharges, with erosion depths of less than ¼ compared to neat epoxy. A similar study by (Fréchette et al., 2012) comparing nanocomposites with either 2.5 wt% of nano- or micrometric silica has shown a similar trend, where the silica NC had a better resistance to corona discharges than their micrometric pendants. A work by (Tanaka, Matsuo et Uchida, 2008) showed that nanometric SiC with contents up to 5 wt% have reduced the erosion depth of the respective epoxy composites by more than factor 7 in the case 5 wt% SiC were incorporated in the epoxy. Also in terms of POSS some notable improvements in erosion resistance were reported by (Huang et al., 2014), who achieved a by factor 2 enhanced resistance to corona by addition of 5 wt% POSS in epoxy.
1.5 Materials Review 1.5.1 Epoxy resins
Amongst the polymeric dielectrics, epoxy resins are a frequently used insulating material in various types of high voltage applications, due to their excellent mechanical, electrical and