CONDUCTING A RAPID SYSTEM ASSESSMENT
INTRODUCTION
Nearly all development practitioners work in complex systems, and when a major shock occurs, it is important to understand the impact on the system as quickly as possible. In these situations, system maps serve as vital decision tools, helping practitioners to understand the state of the system after a shock (or throughout a prolonged shock) and to assess the feasibility and appropriateness of different intervention options.
The USAID/Uganda Market System Monitoring Activity has developed tools for practitioners to apply systems thinking to a diverse set of sectors and systems. Our system maps are built around an intuitive framework of behaviors, conditions, and relationships. They allow practitioners to visualize complex systems, track how the systems adapt and transform, and measure how change propagates through the system. To learn more about creating system maps, please contact the MSM team. This document explains how to use a system map to conduct a rapid assessment of the impact of a particular shock on a system. We have also created an example using a free online system mapping tool, Kumu – links to this example map as well as a guide to the example are provided at the end of the document.
WHAT CAN A SYSTEM ASSESSMENT BE USED FOR?
Shocks are sudden changes to the way in which a system operates. They often: Occur from outside the system Affect many parts of the system Evolve over time
Shocks can be regional, national, or global, and almost invariably impact multiple systems. Some examples of system shocks include:
Pandemics (Ebola, COVID-19) Weather (drought, floods)
Pests and animal diseases (locusts, Fall Army worm) Economic disruption (oil price spikes, global recessions) Conflict (war, civil unrest)
The USAID/Uganda Feed the Future Market System Monitoring Activity is led by the Humanitarian Supply Chain Lab at the
Massachusetts Institute of Technology (MIT) in
partnership with The George Washington University. The Activity draws on insights from systems engineering and supply chain management to develop new methodologies and techniques that can be used by practitioners to visualize complex systems, analyze the impact of interventions on a system, and measure systemic change. For more information,
including our research on complex systems and market system facilitation in Uganda, please contact us at
Each system will be impacted by a particular shock in a different way. Actors in the system may change their behaviors (such as hoarding supplies or laying off workers), and certain assumptions about the way the system functions may no longer hold (funding is available for clinics, or livestock markets are able to function effectively). A rapid system assessment allows you to quickly determine which parts of your system have been hardest hit, and to identify changes or breakdowns that prevent the system from functioning normally. The system map will allow you to anticipate how the first-, second- and third-order effects of the shock will flow through the system over time.
Assessing the impact of a system shock provides valuable information that is useful to a variety of stakeholders. Development organizations can use the information to determine which areas of the system could benefit from an intervention (referred to as leverage points). Businesses can use the insights to forecast the impact the shock will have on their operations or supply chains. Government agencies can use the assessment formulate policy that specifically addresses the areas of the system most impacted by the shock.
HOW TO CONDUCT A RAPID SYSTEM ASSESSMENT
This iterative process captures how a shock impacts a particular system, both initially and over time. The assessment proceeds through five stages:
1. Add the system shock and related effects to your map based on existing knowledge 2. Gather information and relevant data to assess the impact of the shock
3. Add new knowledge to your map
4. Analyze your map to generate conclusions and recommendations 5. Iterate through steps 2-4 over time as needed
STEP 1: EVALUATE THE SYSTEM BASED ON EXISTING KNOWLEDGE
The goal of the first stage is to assess which parts of the system are likely to be impacted by the shock based on existing knowledge and intuition. This allows you to quickly evaluate the (anticipated) status of the system.
The exercise is simple, but challenging:
2. Consult with a few key stakeholders or experts to gauge how they expect the system will be impacted.
3. Using this information, and your own knowledge of the system, go through your system map and identify which elements or connections have likely been impacted (or will be impacted in the near future).
4. Color-code these elements on the map according to their status, to create an initial visualization of system health.
In order to represent the shock on your map, you may find that you need to add new elements or connections. The shock itself may have created new conditions in the system, such as restrictions on movement or an increase in interest rates. There may also be new behaviors by actors in the system as a response to the shock. We recommend adding these elements in a different color, to distinguish which are new features of the system as a result of the shock. Once these shock elements are added, you can then also show how they connect to the rest of the system, and which existing elements they are enabling or disabling.
We have developed conventions for representing shocks, which can be seen in the diagram below: An element is added to represent the main shock (in orange-red below, or a color of your
choosing).
The new elements that have cropped up as a result of the shock are also colored orange-red, to distinguish them from existing elements.
Connections (arrows) have been added to show which existing system elements are impacted by the new conditions or behaviors that were generated by the shock.
Existing elements have been color-coded based on how severely they have been impacted by the shock - in this example, they are shaded in red, orange, or yellow. If an element has not been impacted at all, we color it blue, to indicate that the element is functioning as normal under the shock. The rubric for “severity” is subjective, and depends on both the system you are analyzing and the type of shock that has occurred. It is important to apply the same rubric across the map, and document it clearly. You should also communicate to your audience that the status of the element under the shock does not necessarily indicate the status of the element under normal conditions – an element might normally be “red” (clinics do not have adequate funding, for example) but under the shock assessment it might be “blue”, indicating that the element has not been impacted by the shock (whatever funding is available has not been impacted; the normal status has not changed).
(though not broken) are colored orange-red. Connections that are functioning normally remain grey.
In some cases, the status of an element might be unknown – these we have colored grey. You may not know whether the shock has impacted an element at all, or the level of severity of the impact. In some cases it may be possible to make an educated guess, but it is also advisable to flag the elements that are true “unknowns.”
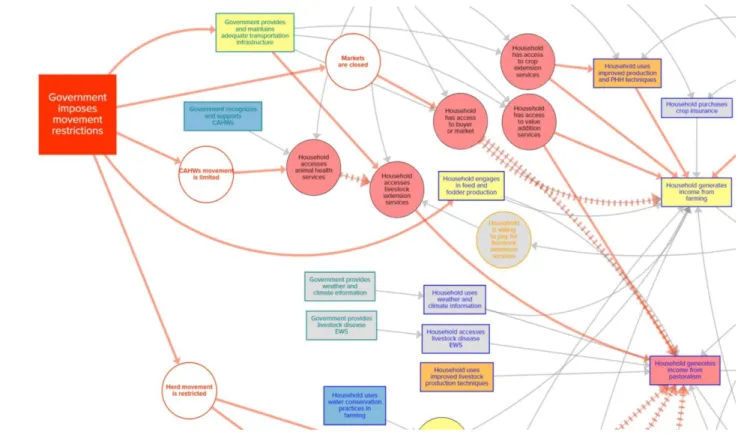
We have included an example from our work in Uganda, in Figure 2 below. We created a notional representation of how COVID-19 could impact income generation in the Karamoja region, a relatively isolated region where households are primarily engaged in agriculture and pastoralism.
The shock is “Government imposes movement restrictions”, which is one of the policies implemented by the Government of Uganda to curb the spread of COVID-19. This shock created three new conditions, which are represented as orange-red circles:
“Markets are closed”: The public markets for both livestock and produce in the region are closed.
“CAHWs movement is limited”: Community animal health workers are less able to reach communities to provide services.
“Herd movement is restricted”: Cattle drives may be limited or rerouted as a result of the restrictions on movement.
These new conditions then impact the rest of the system through new connections: “Markets are closed” is disabling to “Household has access to buyer or market.” “CAHWs movement is limited” directly impacts “Household accesses animal health services.” Some connections are severed, as represented by hashed lines. With public markets closed, the connections from “Household has access to buyer or market” are no longer functioning as expected. “Household generates income from pastoralism” and “Household generates income from farming” are negatively impacted as a result.
Other elements in the system have also been color-coded as red, orange, yellow, or blue, according to the expected impact of the shock. In some cases, you may not know the anticipated impact - as you can see in the figure, several elements have been colored grey.
Having completed Step 1, as in our example above, you now have a clearer picture of the status of your system after the shock. This can already be used as a tool, but its utility will increase if you can add more information to it, which is the focus of Step 2.
STEP 2: GATHER KEY INFORMATION ABOUT THE SHOCK
After starting with your own knowledge and a few experts or stakeholders, it is vital to extend your information-gathering efforts to reach key actors in the system. No matter how extensive the news coverage of a shock, there will always be insights to be gleaned from interacting directly with people who are participating in the system. We recommend that you collect information about how the shock is impacting the system in a targeted, strategic way. This will allow you to refine your assessment of the system status, and enable you to draw more robust conclusions and recommendations.
The snapshot of expected system status that you generated during Step 1 is a key input here. It is likely not feasible to collect information about the entire system, so you will need to prioritize. Based on your assessment of how the system is likely impacted, you can develop a list of priorities for your data collection effort. If you were able to identify important elements that are likely impacted, but are unsure as to the extent of the impact, you should probably collect information about those elements. Your initial assessment in Step 1 may have uncovered areas of the system about which little is known, in which case you should collect information about these elements as well. Perhaps only part of the system is impacted, and you can focus your efforts on a particular group of elements. If your organization works in a particular sector or service area, you may only be interested in the impact of the shock on a specific piece of the system. The process will vary with each system, but your objective should be to identify the set of key elements or topics about which more information is needed.
The level of effort and rigor that is required for collecting more information depends on the severity and speed of the shock. For rapidly developing shocks, there may be only limited time to conduct an initial assessment, followed by a more thorough review of the system once the shock’s effects have subsided. In certain cases, it may be vital to understand one particular element in the system with high accuracy, which would require a more intensive data gathering effort. The table below outlines various information collection methods that you can use to gather data, listed by increasing level of rigor.
We particularly recommend creating sentinel indicators to measure the impact of the shock on the system over time. These indicators are designed to gauge the impact on particular key elements, and are chosen deliberately as signals of change in the system. A change in these
sentinel indicators indicates an imminent ripple effect on the status of other connected elements. The sentinel indicators allow you to keep an eye on changes to the system in a targeted way, acting as early warning indicators of nearby system change.
Source of Information Level of Rigor Timing
Existing expertise or intuition 1 Immediate Targeted interviews with system actors
(such as local government officials, rural households, freight companies, or nurses)
2 repeated as needed 2-3 weeks,
Sentinel indicators that monitor
the status of key system elements 3
2-3 weeks, and then ongoing Systematic surveying of system actors,
or a broader sample of actors 4 2-3 months System dynamics model based
on extensive and robust data collection 5 6-9 months
STEP 3: UPDATE YOUR SYSTEM ASSESSMENT
With the information collected in Step 2, you can now update your assessment of the system map to more closely reflect reality. You may have identified new elements that need to be added as a result of the shock, or changes in actors’ behavior that need to be represented. The status of particular elements may have changed (you now know an element should be orange, not red, for example), or you may have new insight into which connections in the system have been broken. We recommend documenting these changes and the metadata that accompany them – the reason for the change in status, and the evidence or data that the status of the element is based on. These changes can easily be documented using our templates in Kumu, the free online software program that we use for mapping.
elements, you will be able to see which pieces of the system have been hardest hit, and how much the shock has propagated through the system. You can now use the map to ask a few overarching questions as a starting point:
Which elements or parts of the system are most affected? Does this match your expectations?
Are assumptions about the system no longer valid? Has the shock changed certain key conditions or caused a large group of actors to change their behaviors?
Has anything “broken”? Have any pathways or sections of the system stopped functioning entirely? Are there any key connections that no longer work, and that are acting as a barrier to the rest of the system?
Can you anticipate any medium-term or long-term impacts of the shock? Will any of the impacts persist after the shock has ended?
You may not be able to make a fully accurate assessment of the impact of the shock, as you are working with the best available information and/or limited and rapidly changing new data. This caveat should be included in any recommendations that you make using your system map. However, once you have determined the status of the system, analyzing the result will allow you to glean insights and inform decisions in a way that would not be possible without the map.
You can now begin to identify leverage points – opportunities for your organization to intervene in the system in order to correct or counterbalance the impact of the shock.
STEP 5: REPEAT AS NEEDED
Depending on the duration and severity of the shock, it may be necessarily to periodically repeat this exercise, in order to stay abreast of the latest developments in the system. We recommend regular, periodic information collection cycles, returning to the same sources of information and adding new sources as needed. It can be incredibly valuable, for example, to check in with the same system actors once a month, or measure the same set of sentinel indicators every two weeks. This provides a level of continuity to your information, and makes it easier to see changes over time. The time interval between each cycle will depend on how current the data needs to be and how quickly the system is changing. If the shock has been particularly severe, or lasts more than a year, we also recommend an update to your system map as well – the system may have dramatically or permanently changed.
LEARN MORE
System maps are a valuable tool for assessing the impact of a shock on a complex system. You can easily visualize this impact by conducting a rapid, flexible, targeted assessment. This output can then be used to analyze the effects of the shock (both direct and indirect) and identify potential opportunities for intervention. System mapping may seem complex, but it can be intuitive and straightforward, and it is a powerful tool to have in your arsenal – particularly during a shock.
View an example online:
The example from Karamoja, Uganda included in Figure 2 can be viewed online on the Kumu mapping platform. There you will be able to zoom in and out, click on the elements, and explore how the map was put together. The map is available here:
https://kumu.io/MSM/example-shock-assessment-map-usaid-uganda-ftf-market-system-monitoring-activity
We have also put together a quick guide to help you navigate Kumu and explore the map:
https://humanitarian.mit.edu/rapid-system-assessment-methodology-kumu-example/
To learn more about system maps and our methodology, or to ask questions about conducting a rapid system assessment, please reach out to our team at [email protected].