HAL Id: hal-02316058
https://hal.archives-ouvertes.fr/hal-02316058
Submitted on 15 Oct 2019HAL is a multi-disciplinary open access archive for the deposit and dissemination of sci-entific research documents, whether they are pub-lished or not. The documents may come from teaching and research institutions in France or abroad, or from public or private research centers.
L’archive ouverte pluridisciplinaire HAL, est destinée au dépôt et à la diffusion de documents scientifiques de niveau recherche, publiés ou non, émanant des établissements d’enseignement et de recherche français ou étrangers, des laboratoires publics ou privés.
High temperature piezoelectric properties of flux-grown
α-GeO 2 single crystal
Philippe Papet, Micka Bah, Abel Haidoux, Benoit Ruffle, Bertrand Ménaert,
Alexandra Pena Revellez, Jérôme Debray, Pascale Armand
To cite this version:
Philippe Papet, Micka Bah, Abel Haidoux, Benoit Ruffle, Bertrand Ménaert, et al.. High temperature piezoelectric properties of flux-grown α-GeO 2 single crystal. Journal of Applied Physics, American Institute of Physics, 2019, 126 (14), pp.144102. �10.1063/1.5116026�. �hal-02316058�
1
High temperature piezoelectric properties of flux-grown
-GeO
2single crystal
Philippe Papeta, Micka Baha, Abel Haidouxa, Benoit Ruffleb,
Bertrand Menaertc, Alexandra Peñac, Jérôme Debrayc, Pascale Armanda
a
ICGM, CNRS-UM-ENSCM, UMR 5253, Université Montpellier, Place Eugène Bataillon, 34095 Montpellier Cedex 5, France
b Institut Charles Coulomb, Université Montpellier, Place Eugène Bataillon, 34095 Montpellier Cedex 5, France cUniv. Grenoble Alpes, CNRS, Grenoble INP, Institut Néel, 38000 Grenoble, France
E-mail: Philippe.Papet@univ-montp2.fr
Abstract:
The temperature-dependence of the piezoelectric properties of trigonal -GeO2 single-crystals
obtained by the high-temperature flux method was measured by the resonance technique of the electrical impedance in the 20°C - 600°C range. To approach the values of the two independent
piezoelectric coefficients d11 and d14, we first measured as a function of temperature the elastic
coefficients S11, S14 and S66 and the dielectric permittivity 𝜀11which are involved in the coupling
coefficient k of both the thickness shear mode and the transverse mode. A Y-cut plate with a simple +45°-rotation ((YXtwl) +45°/0°/0°) was used to measure the coupling coefficient of the thickness shear mode, and two X-turned plates ((XYtwl) +45°/0°/0° and (XYtwl) -45°/0°/0°) were prepared to characterize the coupling coefficient of two transverse modes. From the whole experimental
measurements, the piezoelectric coefficients of -GeO2 were calculated up to 600 °C. They show that
this crystal is one of the most efficient in regard of the -quartz-like family at room temperature, and that its thermal comportment retains large piezoelectric properties up to 600°C.
1. Introduction
Piezoelectric materials are extensively used as sensors or actuators in a wide range of applications involving the measurement of stresses / strains, the energy conversion, the generation and detection of ultrasonic waves, etc. Today, there is a strong demand for piezoelectric materials with improved performances or tailored properties for high temperature applications. For instance, -quartz, langasite
(La3Ga5SiO14) and -GaPO4 have been widely investigated for Surface Acoustic Waves/Bulk
Acoustic Waves high temperature sensor applications (for high temperature pressure, mass and
chemical/gas measurements) 1. This implies to dispose of materials having a large thermal stability of
dielectric and piezoelectric properties. Moreover, for resonant frequency-based sensor devices, such as SAW/BAW resonators, the knowledge of frequency temperature characteristics is important. In
addition, a high mechanical quality factor QM at an elevated temperature is required to improve
sensitivity.
The use of a piezoelectric material at elevated temperature presents many challenges such as possible phase transition, chemical degradation or structural defect propagation which can cancel or lead to thermal instability of the dielectric, piezoelectric and electromechanical coupling constants. For these reasons, the development of lead-free and environmental-safe non centrosymmetric materials with both a high thermal stability and valuable physical properties is challenging.
In the α-quartz-like family, space group P3121 or P3221, with TO2 (T = Si, Ge) and MXO4 (M = B,
Al, Ga, Fe, Mn; X = P, As) compounds, the piezoelectric coupling factor k strongly depends on the
This is the author’s peer reviewed, accepted manuscript. However, the online version of record will be different from this version once it has been copyedited and typeset.
2
structural distortion. It has been shown that one of the most distorted and thus, most promising
piezoelectric material, would be -GeO2 3-6. The single crystal growth of -GeO2 was already reported
by using the low-temperature hydrothermal method in aqueous solutions from a quartz seed 5-7. These
hydrothermally-grown crystals present a phase transition to the stable tetragonal polymorph at around
180°C due to the presence of OH groups in the as-grown crystal which act as a catalyzer 5,7,8. The
growth of -GeO2 single crystal at high temperature by the fluxmethod 9-12, is a growth method which
avoids the presence of OH impurity in the crystal structure 13 giving rise to α-quartz-structure GeO2
single crystals without phase transition up to their melting 1116°C 12. This was already explained by
their high crystalline quality 14 and by the low degree of dynamical disorder at high temperature
originating from the absence of libration mode of the GeO4 tetrahedra 15.
In this study, oriented plates were obtained from high-quality flux-grown -GeO2 crystals and the
high-temperature dependence of the dielectric, piezoelectric and electromechanical coupling constants
were measured. This paper reports on the first set of piezoelectric constants of OH-free -GeO2 single
crystal from room temperature to 600°C.
2. Experimental procedure
Colorless, high-transparent and large-size right-handed single crystals of the non-centrosymetric
phase of GeO2 were grown from a high temperature solution. Details on the experimental crystal
growth conditions were already published 11.
Using a Cartesian coordinate system, plates cut perpendicular to [21̅0], [010] and [001] directions are known as X, Y, and Z cuts respectively, with the center of the plate at the origin. The Z axis of the coordinate system coincides with the natural c axis of the crystal. All experimental dielectric and piezoelectric measurements were performed on simple rotated plates. We used the IEEE system of
notation for designating the orientation of crystalline plates 18. By convention, for a simple rotation,
the rotational symbol uses as a starting reference one of three hypothetical plates with thickness along X, Y, or Z, and then carries this plate through simple rotation about coordinate axes, fixed in the reference plate, to reach the final orientation. The notation l, w, t (length, width, and thickness of the plate) denotes the orthogonal coordinate axes fixed in the reference plate. By convention the first letter (X, Y, or Z) indicates the initial principal direction of the thickness of the hypothetical plate and the second letter (X, Y, or Z) indicates the initial principal direction of the length of the hypothetical plate. The third letter (l, w, or t) denotes which of the three orthogonal coordinate axes in the hypothetical plate is the axis of the rotation.
The sound velocity translating in the -GeO2 single crystal in function of the crystallographic
orientations was obtained through the Brillouin shift B registered at = 514.5 nm in the
[20°C-600°C] temperature (T) range with a backscattering geometry. The temperature of the samples was regulated with a stability of ±1 °C. Detailed information on the Brillouin instrumental setup was
already published 16.
The elastic compliance constants SE(T) were calculated from the measured elastic stiffness
coefficients CE(T) through the relationship (matrix form), given in Eq. (1).
CE(T)*SE(T) = 1 (1)
An electrically driven mechanical resonance can be created in piezoelectric materials of fixed
geometry depending on the boundary conditions 17. Even if 5 fundamental vibration modes,
characterized by an electromechanical coupling factor k, exist in crystals belonging to the crystal class
This is the author’s peer reviewed, accepted manuscript. However, the online version of record will be different from this version once it has been copyedited and typeset.
3
(32), the measurements of only two suitable modes are enough to get the non-zero piezoelectric
constants 𝑑11 and 𝑑14.. From the measurements of the temperature-dependent frequencies fr and faR of
the impedance using the resonance method, the evolution with the temperature of a given
electromechanical coupling factor can be obtained. For a lossless resonator the frequency fr, commonly
identified as the resonance frequency, is defined as the frequency of maximum admittance (minimum
impedance). The upper frequency faR is defined as the frequency of maximum impedance (minimum
admittance) and is called the antiresonance frequency.
In this work, we have chosen, according to the IEEE standard 18, to measure:
- the coupling factor 𝑘26′ of shear thickness vibration mode with Eq. (2) 18 using a simple-rotated
plate (YXt)+45° (counterclockwise rotation of 45° along Y axis, thickness t = 0.78 mm, length l = 5.9 mm, width w = 3.05 mm). 𝑘26′2 = (𝜋 2∗ 𝑓𝑎𝑅 𝑓𝑅) ∗ tan ( 𝜋 2 ∗ 𝑓𝑎𝑅−𝑓𝑅 𝑓𝑎𝑅 ) (2)
- the coupling factor 𝑘12′ of extensional mode using Eq. (3) 18with two simple-rotated plates,
one (XYt)+45° (l = 5.68 mm, w = 1.78 mm and t = 0.58 mm) to get 𝑘12′(𝑎) and one (XYt)-45° (l = 4.70
mm, w = 1.47 mm and t = 0.36 mm) to get 𝑘12′(𝑏).
𝑓𝑎𝑅−𝑓𝑅
𝑓𝑅 = 4
(𝑘12′(𝑎,𝑏))2
𝜋2 (3)
In a rotated coordinate system all dielectric, elastic and coupling constants are noted with an apostrophe () while the corresponding constants measured in the original coordinate system do not have one. The choice of using a Y rotated plate instead of a Y-cut was due to the size of the as-grown single crystal. Indeed, to respect the boundary conditions for the resonance method it was easier to use
a simple-rotated plate (YXt)+ 45°. In order to calculate the d14 piezoelectric constant (see section 3.3),
two X rotated plates were necessary.
For these three simple-rotated plates, the two large faces perpendicular to the Y (X) axis were
covered with a 20 nm thick layer of Pt metal, deposited by sputtering, which served as electrodes. The
exciting electric field was applied along the Y (X) axis (parallel to the thickness) and fr and faR
frequencies were measured with an Agilent HP 4294A impedance phase analyzer.
The temperature-dependent impedance measurements were carried out with plates connected by
Pt wires in a dense alumina cell placed vertically in a furnace. Even if the -GeO2 material is stable up
to 1100°C 12, it has been decided to perform measurements only up to 600 °C to ensure the reliability
of the measurements. Even if no visible degradation of the electrodes, cracks or peeling off, was observed, Secondary Ions Mass Spectroscopy measurements were performed on samples heated at
600°C for 48 hours in the air and have shown a Pt diffusion in GeO2 up to a 1μm-depth from the
electrode surfaces..
The mechanically-free dielectric permittivity𝜀11𝑋 was obtained by measuring, in the 20°C-600°C
temperature range, the capacitance C at low frequency (1 kHz) of the (XYt)+45° and (YXt)+45° plates
covered with electrodes because they had suitable boundary conditions to measure 𝜀11𝑋(𝑇) = 𝜀22𝑋(𝑇)
17-19.
This is the author’s peer reviewed, accepted manuscript. However, the online version of record will be different from this version once it has been copyedited and typeset.
4
3. Results
3.1 Elastic constants
The Brillouin shift was registered on non-metalized X-cut and Y-cut plates. The high temperature
evolution of the elastic moduli at constant electric field (electrically free) 𝑠44𝐸 (𝑇), |S14E|(T) and 𝑠66𝐸 (T)
are reported in Fig.1.
Fig. 1. Thermal evolution of the elastic compliances S66E, S44E and |S14E|. The error bars are the standard
deviations (close to 1 for S66E, 1.2 for S44E and 0.1 for |S14E|).
3.2 Dielectric properties
The average of the measured values of the mechanically-free 𝜀11𝑋(at 1 kHz) permittivity and the
dielectric loss versus the temperature is reported in Fig. 2. The large error bars of the data measured are due to the weak accuracy of this method of measurement even if we respect the boundary conditions for the geometry of plates.
This is the author’s peer reviewed, accepted manuscript. However, the online version of record will be different from this version once it has been copyedited and typeset.
5
Fig. 2. Mechanically-free 𝜀11𝑋 permittivity and Dielectric Loss depending on the temperature (measured at 1kHz). The points represent the average of five measures at each temperature and the
error bars are the standard deviation (close to 3 pF/m for 11X and 0.01 for Dielectric Loss).
3.3 Piezoelectric properties
• d11 according to the temperature
In the rotated coordinate system, the coupling factor 𝑘26′ of shear thickness vibration mode is given
by Eq. (4).
𝑘26′ = 𝑑26′
√𝑠66′𝐸𝜀 22
′𝑋 (4)
Knowing the elastic constants 𝑠66𝐸 and the permittivity 𝜀22𝑋, we have to compute 𝑠66′𝐸 and 𝜀22′𝑋
and 𝑑26′ using the transformation law for a tensor of rank 4 (elastic coefficients), rank 3 (piezoelectric
coefficients) and rank 2 (permittivity tensor). The new relations are given in Eq. (5).
𝜀22′ = 𝜀22 = 𝜀11 (5a)
This is the author’s peer reviewed, accepted manuscript. However, the online version of record will be different from this version once it has been copyedited and typeset.
6
𝑠66′ = (𝑠
66cos2𝜃 + 𝑠44sin2𝜃) (5b)
𝑑26′ = 2𝑑212′ = 2cos 𝜃 𝑑212 = cos 𝜃 𝑑26 (5c)
Finally, we obtain Eq. (6).
𝑘26′ (𝑇) = 𝑑26′ (𝑇) √𝑠66′𝐸(𝑇)𝜀 22′𝑋(𝑇) = 𝑑26(𝑇) cos 𝜃 √(𝑠66𝐸(𝑇) cos2𝜃+𝑠 44 𝐸 (𝑇) sin2𝜃)𝜀 11𝑋(𝑇) (6)
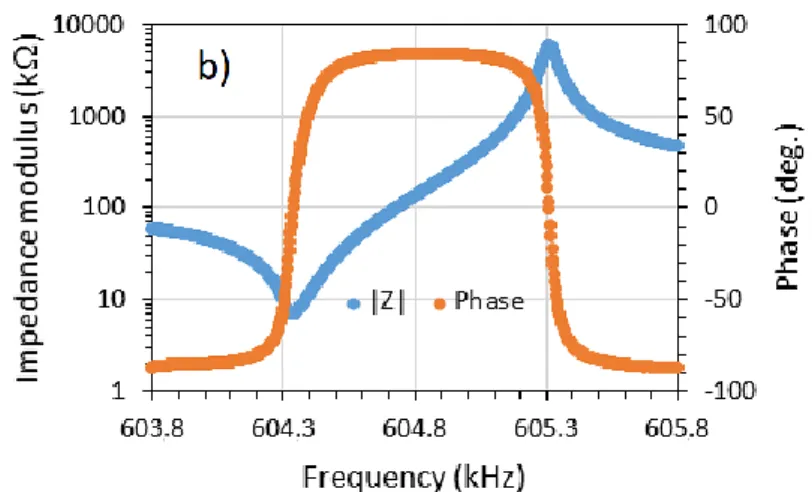
Fig. 3a reports the measures of the electromechanical coupling coefficient 𝑘26′ by the resonance
method depending on the temperature for a (YXt)+ 45° plate.
This is the author’s peer reviewed, accepted manuscript. However, the online version of record will be different from this version once it has been copyedited and typeset.
7
Fig. 3 (a) Thickness shear k'26 and rod extensional 𝑘12′(𝑎) and 𝑘12′(𝑏)coupling factors in the 20-600°C
temperature range (each point represents the average of five measures and the error bars are the standard deviation (close to 0.005)) and (b) room temperature impedance modulus and phase near resonance for the (XYt)+45° plate.
As d26 = -2d11 18, the thermal evolution of the d11(T) piezoelectric coefficient, obtained from the
measured elastic compliances 𝑠44𝐸 (𝑇) and 𝑠
66𝐸 (T) (Fig. 1), dielectric permittivity 𝜀11𝑋(𝑇) (Fig. 2) and
electromechanical coupling coefficients 𝑘26′ (𝑇) (Fig. 3), is shown in Fig. 4.
• d14 according to the temperature
Direct measurement of the piezoelectric strain constant d14 is not easy to perform because it only
appears for shear face vibration mode in X- or Y-cut plates. Nevertheless, it is possible to measure a vibration mode, such as an extensional one, using a X-cut plate rotated along the X axis and electrically
driven with 𝐸⃗ // to the X axis. The electromechanical coupling factor 𝑘12′ for plate extensional mode in
the rotated coordinate system is given by Eq. (7).
(𝑘12′ )2 = (𝑑12′ )2
𝑠22′𝐸∗𝜀11′𝑋 (7)
The new relations are given in Eq. (8) for a simple-rotated plate (XYt)+θ°.
𝜀11′ = 𝜀
11 (8a)
𝑠22′ = (𝑠11cos4𝜃 + 𝑠44sin2𝜃 cos2𝜃 + 2𝑠13sin2𝜃 cos2𝜃 − 2𝑠14sin 𝜃 cos3𝜃 + 𝑠33sin4𝜃) (8b)
𝑑12′ = 𝑑122′ = cos2𝜃 𝑑
12+ cos 𝜃 sin 𝜃 𝑑14 = − cos2𝜃 𝑑11+ cos 𝜃 sin 𝜃 𝑑14 (8c)
Finally, we obtain Eq. (9).
This is the author’s peer reviewed, accepted manuscript. However, the online version of record will be different from this version once it has been copyedited and typeset.
8
𝑘12′ = − cos2𝜃𝑑11+cos 𝜃 sin 𝜃𝑑14 √(𝑠11𝐸 cos4𝜃+𝑠
44𝐸 sin2𝜃 cos2𝜃+2𝑠13𝐸 sin2𝜃 cos2𝜃−2𝑠14𝐸 sin 𝜃 cos3𝜃+𝑠33𝐸 sin4𝜃)𝜀11𝑋
(9)
Thus, by measuring the coupling factor of the transverse vibration mode of two simple-rotated
(XYt )+45° and (XYt )-45° plates and, knowing the 𝑑11 values measured with the Y-cut rotated plate
(see Fig. 4), we can calculate the value of 𝑑14 19-20. Indeed, if 𝜃 = +45°, 𝑘
12 ′(𝑎)
is given by Eq. (10a)
and if 𝜃 = −45°, 𝑘12′(𝑏) is given by Eq. (10b).
𝑘12′(𝑎)(𝑇) = −𝑑11(𝑇)+𝑑14(𝑇) √(𝑠11𝐸(𝑇)+𝑠44𝐸(𝑇)+2𝑠 13𝐸 (𝑇)−2𝑠14𝐸(𝑇)+𝑠33𝐸 (𝑇))𝜀11𝑋(𝑇) (10a) 𝑘12′(𝑏)(𝑇) = −𝑑11(𝑇)−𝑑14(𝑇) √(𝑠11𝐸(𝑇)+𝑠44𝐸(𝑇)+2𝑠 13𝐸(𝑇)+2𝑠14𝐸(𝑇)+𝑠33𝐸(𝑇))𝜀11𝑋(𝑇) (10b)
Since |S14E|(T) with 20°𝐶 ≤ T ≤ 600°𝐶 is almost two orders of magnitude lower than 𝑠44𝐸 (𝑇), see
Fig. 1, we can assume that d14(T) follows Eq. (11) in the temperature range of measurements.
𝑑14(𝑇) ≈ 𝑑11(𝑇) × (1−𝑘12 ′(𝑎)(𝑇) 𝑘12′(𝑏)(𝑇)) (1+𝑘12 ′(𝑎) (𝑇) 𝑘12′(𝑏)(𝑇)) (11)
The temperature dependence of 𝑘12′(𝑎) and 𝑘12′(𝑏) is reported in Fig. 3a, and the deduced values
of 𝑑14(T) can be seen in Fig. 4.
This is the author’s peer reviewed, accepted manuscript. However, the online version of record will be different from this version once it has been copyedited and typeset.
9
Fig. 4. Temperature dependence of the piezoelectric strain constants d11 and d14. The error
bars are the standard deviation (close to 0.3 pC/N for d11 and 0.5 pC/N for d14).
4. Discussion
4.1 Room-temperature characterizations
Table 1 presents the room-temperature parameters measured in this study compared to experimental and calculated values found in literature.
Table 1
Calculated and room-temperature measured parameters for -GeO2 single crystal.
This work Experimental
results Theoretical results |S14E| (TPa-1) ≈ 0.00 ± 0.03 1.29 21 2.60 22 𝑆44𝐸 (TPa-1) 25.8 ± 0.6 27.17 21 30.20 22 𝑆66𝐸 (TPa-1) 47 ± 2 47.87 21 55.54 22 𝜀11𝑋 (pF.m-1) 61± 5 48.00 16 65.78 21 45.25 22 53.12 23 𝑑11(pC.N-1) 6.2 ± 0.4 5.70 16 6.31 22
This is the author’s peer reviewed, accepted manuscript. However, the online version of record will be different from this version once it has been copyedited and typeset.
10
4.10 21 6.00 6
𝑑14(pC.N-1) 2.7 ± 0.5 3.82 21 3.1122
Concerning the elastic constants, we quite agree with the published values except for the S14E
constant for which our value is close to zero.
Our room-temperature d11 and d14 piezoelectric strain constants are close to the theoretical ones
and the low d11 and the high d14 experimental values reported in published articles were obtained from
plates of -GeO2 synthesized by hydrothermal process which contains a notable concentration of OH
group (d11 = 4.04 and d14 = 3.82 pC/N 21).
In Table 2, room temperature experimental piezoelectric constants for single crystals belonging to
the -quartz family are reported. As it can be seen, -GeO2 exhibits the highest values of the
piezoelectric parameters as it was predicted based on the degree of crystal structure distortion in the
-quartz family 3-6.
Table 2
Comparison of the experimental piezoelectric parameters in the -quartz family single crystals
(Langasite La3Ga5SiO14 belongs to the trigonal system, point group 32).
-SiO2 25 -AlPO4 4 -GaPO44 -GeO2 La3Ga5SiO14 28
𝑑11 (pC.N-1) 2.31 3.30 4.50 6.2 ± 0.3 6.15
𝑑14 (pC.N-1) 0.73 1.62 1.94 2.7 ± 0.5 -
4.2 Temperature dependence of the elastic, dielectric and piezoelectric properties
The dielectric permittivity is stable in the 20-600°C temperature range and the slight enhancement of the dielectric permittivity with temperature observed in Fig. 2 may be explained by an increase of the mobility of charged defects/impurities present in the material. The thermal activation of the mobility of charged defects may improve the contribution of the space charge polarization (induced by defects) to the dielectric permittivity. However, this phenomenon, observed in many inorganic
materials with a low dielectric permittivity17, is small for -GeO
2 for temperatures under 600°C (the
slope of the linear curve is 8.61*10-4 F.m-1.C-1).
The coupling coefficient 𝑘26′ (𝑇) and 𝑘12′ (𝑇), which are nondimensional coefficients useful for the
description of a piezoelectric material under a particular stress and electric field configuration for
conversion of stored energy to mechanical or electric work18, decrease when the temperature increases.
However, we must avoid attributing all the behaviour of piezoelectric coupling coefficients, in the temperature range explored, Fig. 4, only to the resonator. By using thin films of platinum for electrodes, some degradation phenomena as a result of agglomeration, recrystallization, and dewetting
effects can be observed at high temperatures 25 and can lead to partial loss of thin film’s electrical
conductivity 26-27. Moreover, the resonator is placed between a plate of platinum that ensures the
electrical contact with the lower electrode and a platinum wire in contact with the upper electrode. If, at high temperature there is a bad adhesion between the plate and the electrode, capacitive effects may appear. To take into account all the parasitic effects due to the experimental measurement system, a
serial impedance Rel-Cel branch in series with the equivalent circuit (near the resonance) of the
This is the author’s peer reviewed, accepted manuscript. However, the online version of record will be different from this version once it has been copyedited and typeset.
11
resonator can be used, with Rel and Cel respectively the resistance and the capacitance of experimental
measuring system (Pt plates, wires and electrodes). For ideal lossless materials, the resonator impedance is purely reactive, and the characteristic frequencies of a vibration mode coincide with the
minimum and maximum of the impedance 18. Adding a branch in series to the equivalent circuit allows
to underline the likely effects of experimental measurements system at high temperatures onto the
impedance data. Indeed, introduction of Cel term in the reactive expression of impedance could lead to
small change in the characteristic frequencies at high temperature.
The piezoelectric constant d14 seems to be less sensitive to temperature in the studied temperature
range, Fig. 4. However, the accuracy of d14 values is less reliable than the d11 one because we had to
use the d11 data modulated by the ratio of coupling coefficients of two rotated X plates experimentally
measured in order to calculate d14.
5. Conclusion
-GeO2 crystal structure is of the same crystal class (32) as -quartz, which is the piezoelectric
single crystal of reference. At room temperature, this material is largely more efficient than -quartz with piezoelectric coefficients 3 times higher. In addition, piezoelectric properties are preserved when
subjecting the -GeO2 material to high temperatures. The measurements, by the resonant method on
oriented -GeO2 plates, of the electromechanical coupling factors depending on the temperature,
allowed us to highlight that this material is still piezoelectric at 600°C with high values of piezoelectric
coefficients d11 and d14. The decreases of d11, and to a lesser extent the one of d14, when the temperature
is increased, consider the intrinsic behaviour of the material, but also the likely evolution of electrical contacts (wires and electrodes).
This first high-temperature characterization of the piezoelectric performance of the -GeO2
single crystal shows that this lead-free material, due to its thermal stability of both its structure and its piezoelectric constants, is a good candidate for high temperature piezoelectric applications.
Acknowledgements.
This work has been done with the financial support of the French National Agency ANR (contract 14-CE07-0017)
References
1 M.V. hamidon, V. Skarda, N.M. White, F. Krispel, P. Krempl, M. Binhack and W.Buff, Sens. Actuators, A 123-124, 403 (2005).
2 S. Zhang, and F. Yu, J. Am. Ceramic Society 94(10), 3153 (2011).
3 E. Philippot, A. Goiffon, A. Ibanez, and M. Pintard, J. Solid State Chem. 110, 356 (1994). 4 E. Philippot, D. Palmier, M. Pintard, and A. Goiffon, J. Solid State Chem. 123,1 (1996).
5 D.V. Balitsky, V.S.Valitsky, Y.V. Pisarevley, E. Philippot, O.Y Silvestrova, and D.Y Pushcharovsky, Ann. Chim. Sci. Mat, 26, 183 (2001).
This is the author’s peer reviewed, accepted manuscript. However, the online version of record will be different from this version once it has been copyedited and typeset.
12 6 P.W. Krempl, J. Phys. IV France 126, 95 (2005).
7 R. Roy, and S. Theokritoff, J. Crystal Growth, 12, 69 (1972).
8 L.N. Demianets, Prog. Crystal Growth and Charact., 21, 299 (1990). 9 C.B. Finch, and G.W Clark, Am. Mineral., 53, 1394 (1968).
10 J.W. Goodrum, J. Cryst. Growth 13/14, 604 (1972).
11 A. Lignie, B. Ménaert, P. Armand, A. Peña, J. Debray, and P. Papet, Cryst. Growth Des. 13, 4220 (2013). 12 P. Armand, A. Lignie, M. Beaurain and P. Papet, Crystals 4, 168 (2014).
13 A. Lignie, P. Armand and P. Papet, Inorg. Chem. 50, 9311 (2011).
14 A. Lignie, D. Granier, P. Armand, J. Haines and P. Papet, J. Appl. Cryst. 45, 272 (2012).
15 G. Fraysse, A. Lignie, P. Hermet, P. Armand, D. Bourgogne, J. Haines, B. Ménaert and P. Papet, Inorg. Chem. 52, 7271 (2013).
16 A. Lignie, W. Zhou, P. Armand, B. Rufflé, R. Mayet, J. Debray, P. Hermet, B. Ménaert, P. Thomas, and P. Papet, ChemPhysChem 15, 118 (2014).
17R.E. Newnham, Properties of materials, anisotropy, symmetry, structure, Oxford University Press (2005). 18 IEEE Standard on Piezoelectricity, IEEE/ANSI Std. 176 (1987).
19 W. G. Cady, Piezoelectricity, McGraw-Hill, New York (1946). 20 A.C. Lynch, Proc. Phys. Soc. B 63, 890 (1950).
21 D.V. Balitsky, V.S.Valitsky, Yu.V. Pisarevsky, E. Philippot, O.Yu. Silvestrova and D.Yu. Pisharovsky, Ann. Chim. Sci. Mat., 26, 183 (2001).
22 Kh. E. El-Kelany, A. Erba, P. Carbonnière and M. Rérat, J. Phys. Condens. Matter 26, 205401 (2014). 23 E. Ghobadi, J.A. Capobianco, Phys. Chem. Chem. Phys. 2, 5761 (2000).
24 R. Bechmann, Phys. Rev. 110, 1060 (1958).
25 D. Frankel, G. Bernhardt, B. Sturtevant, T. Moonlight, M. Pereira da Cunha, R.S Lad, In Proceedings of the IEEE Sensors, Lecce, Italy, 82 (2008)
26 D. Richter, S. Sakharov, E. Forsén, E. Mayer, L. Reindl, S. Fritze, Procedia Eng. 25, 168 (2011). 27 S.L. Firebaugh, K.F. Jensen, M.A. Schmidt, J. Microelectromech. Syst. 7, 128 (1998).
28 J. Bohm, E. Chilla, C. Flannery, H.J. Frohlich, T. Hauke, R.B. Heimann, M. Hengst, and U. Straube, J. Cryst. Growth, 216, 293 (2000).
This is the author’s peer reviewed, accepted manuscript. However, the online version of record will be different from this version once it has been copyedited and typeset.
This is the author’s peer reviewed, accepted manuscript. However, the online version of record will be different from this version once it has been copyedited and typeset.
This is the author’s peer reviewed, accepted manuscript. However, the online version of record will be different from this version once it has been copyedited and typeset.
This is the author’s peer reviewed, accepted manuscript. However, the online version of record will be different from this version once it has been copyedited and typeset.
-100
-50
0
50
100
1
10
100
1000
10000
603.8
604.3
604.8
605.3
605.8
P
hase
(de
g.
)
Im
p
ed
an
ce
m
o
d
u
lu
s
(k
)
Frequency (kHz)
|Z|
Phase
b)
This is the author’s peer reviewed, accepted manuscript. However, the online version of record will be different from this version once it has been copyedited and typeset.
This is the author’s peer reviewed, accepted manuscript. However, the online version of record will be different from this version once it has been copyedited and typeset.