Publisher’s version / Version de l'éditeur:
Canadian Geotechnical Journal, 7, 3, pp. 326-333, 1970-08
READ THESE TERMS AND CONDITIONS CAREFULLY BEFORE USING THIS WEBSITE.
https://nrc-publications.canada.ca/eng/copyright
Vous avez des questions? Nous pouvons vous aider. Pour communiquer directement avec un auteur, consultez la première page de la revue dans laquelle son article a été publié afin de trouver ses coordonnées. Si vous n’arrivez pas à les repérer, communiquez avec nous à [email protected].
Questions? Contact the NRC Publications Archive team at
[email protected]. If you wish to email the authors directly, please see the first page of the publication for their contact information.
NRC Publications Archive
Archives des publications du CNRC
This publication could be one of several versions: author’s original, accepted manuscript or the publisher’s version. / La version de cette publication peut être l’une des suivantes : la version prépublication de l’auteur, la version acceptée du manuscrit ou la version de l’éditeur.
Access and use of this website and the material on it are subject to the Terms and Conditions set forth at
Groundwater flow in eastern Ottawa
Jarrett, P. M.; Eden, W. J.
https://publications-cnrc.canada.ca/fra/droits
L’accès à ce site Web et l’utilisation de son contenu sont assujettis aux conditions présentées dans le site LISEZ CES CONDITIONS ATTENTIVEMENT AVANT D’UTILISER CE SITE WEB.
NRC Publications Record / Notice d'Archives des publications de CNRC:
https://nrc-publications.canada.ca/eng/view/object/?id=3927353a-db63-4110-ad65-aa9ee91ea907 https://publications-cnrc.canada.ca/fra/voir/objet/?id=3927353a-db63-4110-ad65-aa9ee91ea907
Groundwater flow in eastern Ottawa1
P. M. JARRETTDepartment o f Civil Engineering, The University, Glasgow, Scotland AND
W . J .
EDEN
Division o f Building Research, National Research Council of Canada, Ottawa, Canada
Received January 14, 1969
A mile-long line of piezometers were installed a t various depths in a clay terrace system east of the City of Ottawa. Measurements indicated a significant downward piezometric gradient through the clay layer to the underlying bedrock. The downward flow of water through the clay affects both existing effective stresses and the stress history of the clay deposit.
On a install6 B diverses profondeurs une skrie de piCzom6tres sur une distance d'un mille dans I'argile des terrasses fluviales B l'est d'ottawa. Les mesures ont indiquC un gradient piCzo- mCtrique fortement dtcroissant au travers des couches d'argile jusqu'au roc sous-jacent. L'Ccoule- ment des eaux au travers de I'argile influence B la fois contraintes actuelles et 1'Cvolution des contraintes affectant le dCpBt d'argile.
TECHNICAL NOTES 327
The discovery of an ancient earth flow in a river terrace to the east of Ottawa led to an investigation of slope stability in neighboring areas (Crawford and Eden 1967). These studies were undertaken to try to correlate present-day methods of analysis with known cases of slope failure. During these and allied investigations in this area a downward flow of the groundwater became apparent. The hydrau- lic pressure gradient necessary to maintain this downward flow radically affects any estimate of the in situ effective stresses, which in turn
are of paramount importance in slope stability problems. It was therefore decided to investi- gate the nature of this downward flow.
Study Area
The area studied is located along the south bank of the Ottawa River. At this location, the river has cut into postglacial clay sediments which are up to 160 ft (49 m ) thick. The clay is underlain by a thin layer of glacial till and then by bedrock which may be either shale or limestone (Wilson 1946). A contour plan of the study area (Fig. 1 ) shows two flat plains divided by a slope 90 ft (27 m ) high. The landslide scar is seen in the southeast part of the plan. Figure 3 is an aerial photograph of the same region.
Piezometric Instrumentation
It was decided at the outset to install a line of piezometers in the clay, southward from the river to the height of land at the Montreal Road where the clay beds thin out into the till or rock formations. In case drainage was not per- pendicular to the river, some piezometers were offset from the general line to give an indication of the lateral drainage. All these piezometers were the "Geonor" type having a porous bronze tip with a plastic stand-pipe of 3 in. (0.95 cm) diameter extending to the surface. An electrical probe was lowered down the stand-pipe to determine the water level.
A section taken along the line of the piezom- eters showing their positions is illustrated in Fig. 2. Piezometers 11 and 12 are those offset from the line. They are plotted on this section in the position they hold when joined perpen- dicularly to the main line. Figure 1 gives the plan positions of the installations. Two rock-
points were installed at the locations shown in Figs. 1 and 2. These points are merely small diameter casings (approximately 2 in. ( 5 cm) diameter) driven and sealed into the upper layers of the rock. A core was then drilled out through the casings for about 5 ft (1.5 m ) to allow water into the stand-pipe, permitting measurement of the piezometric elevation in the rock. The elevations of all the piezometers and rockpoints are listed in Table I.
Pore-water Pressure Observations Measurements of the piezometric levels have now been made in all the instruments for at least 1 y, and some have been observed for considerably longer periods. Table I lists the maximum and minimum piezometric elevations measured in each stand-pipe. It will be noted that the piezometers near the slope have large variations between maximum and minimum levels, whereas those in the flat areas tend toward constant values.
Discussion
The piezometric observations are useful for the analysis of the groundwater flow regime in the slope between the flat areas as outlined in the paper by Crawford and Eden (1967), or for the analysis of the downward piezometric gradient in the flat areas. The following dis- cussion deals with this latter aspect.
It may first be helpful to define the com- ponent parts of groundwater pressures. From Bernoulli's equation one can relate the total hydraulic head at a given point to a particular datum elevation in the following way.
Total Head = Pressure Head
+
Elevation Head+
Velocity Head. Pressure head is the water pressure at any point considered and in the soil mechanics sense is the pore pressure as measured in an open stand-pipe. Elevation head is that due to the position of the point considered with re- spect to the datum level. Velocity head is that due to the velocity of the water. In the case of groundwater this term may generally be ig- nored.It follows that' where general groundwater flow is discussed then changes in the total head
CANADIAN GEOTECHNICAL JOURNAL. VOL. 7, 1970
Frc. 3. Aerial photo of study area (courtesy City of Ottawa).
are considered. Where effective stresses and typical values of the pressure heads in piezom- related soil properties are concerned, the pres- eters 7 and 8 at station A. They are plotted sure head (pore pressure) at the point in irom their respective elevations and show that question is the parameter used. in the 20-ft (6-m) vertical distance between The results from the piezometers at stations their tips there is a loss in total head of 7.2 ft A, B, F, and G reveal a substantial total head (2.2 m ) of water. A comparison of the pressure loss in a downward direction. Figure 4 gives heads between piezometers 8 and 14, which
TECHNICAL NOTES
TABLE I
Details of piezometric installations Maximum Minimum
Surface Tip piezometric piezometric Difference elevation elevation elevation elevation
Station Piezometer (ft) (ft) measured (ft) measured (ft) ft m
A 7 8 287 287 237 257 281.3 273.9 279.3 272.7 2.0 1.2 0.61 0.37 S u r f a c e z'./,,//, /m
1
Sta. A-
I :
R 1 R o c k S t a . B-
A p p r o x . 6 0 0 f e e t-
- 1 6 0 P r e s s u r e h e a d a s m e a s u r e d o n 2 3 - 5 - 6 7 s h o w n w i t h r e s p e c t t o t i p e l e v a t i o n 1 5 0FIG. 4. Typical values of pressure head of water on upper flat area.
are at similar elevations but at stations A and B respectively, shows there is a loss towards the river of only 11.3 ft (3.4 m ) in a distance of approximately 600 ft (180 m) horizontally.
The total head gradient is thus about 20 times greater in the vertical direction than in the horizontal. Similar relative conditions exist be- tween the piezometer groups on the lower plain at stations F and G.
It is known2 that in this area the interface between the rock and the clay is a water- bearing stratum. It is believed that cracks and fissures in the upper part of the bedrock pro- vide a good drainage system towards the river. None of the observations has cast doubt on the river as the final drainage sink. Indeed at the deepest piezometer, rockpoint R2, the total head is at least 10 ft ( 3 m ) above mean river level.
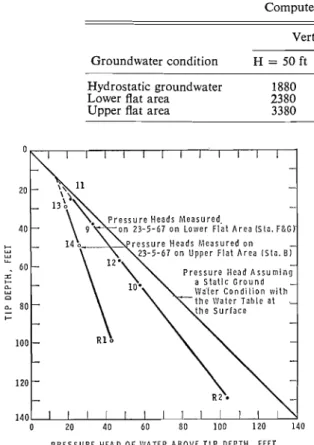
It can be seen from Fig. 5 that there is an appreciable difference in the relationship of pressure head to depth between the upper and lower flat areas. The important factor in this relationship is the pressure head at bedrock which has a dominating influence on the pore pressures in the clay. The pressure head at R 1 is relatively low, due to the configuration of the bedrock which drops sharply a short dis- tance north of R1. At this point, therefore, the water passing along the rock does not need a
CANADIAN GEOTECHNICAL JOURNAL. VOL. 7, 1970
TABLE I1 Computed stresses
Vertical effective stress lb/ft2 (kg/cmz) Groundwater condition H = 50 ft (15 m) H = 100 ft (30 m) Hydrostatic groundwater 1880
Lower flat area 2380
Upper flat area 3380
1 4 0 1 1 1 1 1 1 1 1 1 1 1 1 1
0 20 40 60 80 1 0 0 1 2 0 1 4 0 P R E S S U R E H E A D 0 F . V I A T E R A B O V E T I P D E P T H . F E E T
FIG. 5 . Relationship of groundwater pressures and
depth below surface.
there is a downward flow of water, the hydro- static condition does not exist and h
<
H. Figure 5 shows the difference between the general assumption of hydrostatic pressure and the measured pressure conditions. Using values of h obtained from Fig. 5, numerical examples of the effective stresses calculated under the varying conditions are given in Table I1 forr,,.,t
= 100 lb/ft3 ( 1.60 g/cm3).The differences obtained in effective stress values are large and increase with depth. At the 100-ft (30 m ) depth in the upper flat area the calculated effective stress value is almost twice that obtained assuming hydrostatic con- ditions. This increase in effective stresses due to downward flow increases the stability of the. slope between the upper and lower plains. O n the other hand, in making settlement estima- tions, great difficulty could be encountered. For example, if the preconsolidation of the subsoil is determined from consolidation tests and the in situ effective stresses are calculated large pressure head as the pressure gradient assuming hydrostatic pore pressures (when in necessary for is provided the loss fact a downward drainage condition existed) in elevation head in the water-bearing strata. then the additional loading that could be
ap-
In many practical engineering situations, in plied without exceeding the preconsolidation sit11 effective stresses are calculated assuming pressure would be overestimated with the hydrostatic conditions below the water table. sibility of unexpected settlements.
Equation [ I ] is a general relationship for the In this case the downward flow of water vertical effective stress
d
at a point X in a mayhave influenced the stress history of the uniform mass, which is f t the clay in the area. The lower flat area is a terrace
ground surface. of the Ottawa River. Some overburden has
111 u' = H-yw - hym, therefore been removed by the erosive action
of the river; the extent of this erosion has been
r,,t
= Unit weight of soil, tentatively estimated by Crawford and Edeny, = Unit weight of water, ( 1965) using measured preconsolidation pres- h = Pressure head of water at X. sures and assuming hydrostatic conditions. I t
is now believed that part of this calculated If the groundwater table is at the surface and overconsolidation may *be caused by a down- hydrostatic conditions prevail then h = H.
If,
ward drainage which may have existed before however, as is the case described in this report, and during the erosion process.TECHNICAL NOTES 333
Conslusions
( 1 ) T h e river acts as the drainage sink for the area, with subsurface drainage to the river through the upper rock layers.
(2) T h e porewater pressures in the clay are directly dependent o n those in the under- lying bedrock.
( 3 ) T h e downward flow of water in the clay strata can radically affect both the stress history of the material and present-day stress analyses. T h e possibilities of such a flow should, there- fore, be considered during design work.
Asknowledgment
T h e authors wish to thank Mr. L. Boyd and Mr. K. Timmins for the collection of the majority of these results. I n addition, most of the personnel of the Soil Mechanics Section of the Division of Building Research at one time
o r another have bcen involved in the collection and discussion of results. This paper is a con- tribution from the National Research Council of Canada, Division of Building Research, and is published with the approval of the Director of the Division.
CRAWFORD, C. B. and EDEN, W. J . 1965. A com- parison of laboratory results with irl si/u proper- ties of Leda Clay. Proc. lnt. Conf. Soil Mech. Found. Eng., 6th, Montreal, Quebec, 1, pp. 31- 35.
1967. Stability of natural slopes in sensitive clay. Amer. Soc. Civil Eng. Conf. "Stability and Performance of slopes and Embankments." J.
Soil Mech. Found. Div., Proc. Amer. Soc. Civil Eng. 93, SM 4, pp. 4 1 9 4 3 6 .
WILSON, A. E. 1946. Geology of the Ottawa - St. Lawrence lowland, Ontario and Quebec. Geol. Survey Memoir 241, No. 2474. Canada Depart- ment of Mines and Resources.