Publisher’s version / Version de l'éditeur:
Journal of Thermal Analysis, 3, 2, pp. 181-190, 1971-09-01
READ THESE TERMS AND CONDITIONS CAREFULLY BEFORE USING THIS WEBSITE.
https://nrc-publications.canada.ca/eng/copyright
Vous avez des questions? Nous pouvons vous aider. Pour communiquer directement avec un auteur, consultez la
première page de la revue dans laquelle son article a été publié afin de trouver ses coordonnées. Si vous n’arrivez pas à les repérer, communiquez avec nous à PublicationsArchive-ArchivesPublications@nrc-cnrc.gc.ca.
Questions? Contact the NRC Publications Archive team at
PublicationsArchive-ArchivesPublications@nrc-cnrc.gc.ca. If you wish to email the authors directly, please see the first page of the publication for their contact information.
NRC Publications Archive
Archives des publications du CNRC
This publication could be one of several versions: author’s original, accepted manuscript or the publisher’s version. / La version de cette publication peut être l’une des suivantes : la version prépublication de l’auteur, la version acceptée du manuscrit ou la version de l’éditeur.
Access and use of this website and the material on it are subject to the Terms and Conditions set forth at
Estimation of tricalcium silicate through polymorphic transformation
Ramachandran, V. S.
https://publications-cnrc.canada.ca/fra/droits
L’accès à ce site Web et l’utilisation de son contenu sont assujettis aux conditions présentées dans le site LISEZ CES CONDITIONS ATTENTIVEMENT AVANT D’UTILISER CE SITE WEB.
NRC Publications Record / Notice d'Archives des publications de CNRC:
https://nrc-publications.canada.ca/eng/view/object/?id=8b4cc2dd-a586-4599-98fd-6106190db657 https://publications-cnrc.canada.ca/fra/voir/objet/?id=8b4cc2dd-a586-4599-98fd-6106190db657J o ~ ~ r t r a l of' Thert>rrrl Atralysis, Vol. 3 (1971) 181-190 ESTIMATION O F TRICALCIUM SILICATE
T H R O U G H POLYMORPHIC T R A N S F O R M A T I O N .
A ~ U ' L V Z E @
Natiorral Researrlt Coutlt il of' Catrnclrr.Dioisiotr of Buildirrg Research, O t t a ~ ~ a . Car~nda
(Received Noveniber 23, 1970)
Tricalci~lni silicate characteristically exhibits the iiiost intense reversible transition at a temperature of about 915". The intensity of this effect can be used to estimate the amount of C,,S in n ~ i x t ~ ~ r e s and t o calculate the degree of hydration of C,S. Low sensitiv- ity for .AT LIP to 800" and higher sensitivity between 800" and 1000" enable estimation of both Ca(OH), and C:,S. Interference effects at higher temperatilres owing t o decarbona- tion, recrystallization to P-wollastonite, and dehydration of the c a l c i ~ ~ m silicate hydrate can be overcome by heating t o 1000°, cooling to 800G, and reheating. A determination of the degree of hydration of C,,S obtained at different periods by D T A correlates well with that sing the X-ray method.
Portland cement is a complex mixture of several phases. Study of the hydration of individual phases is essential for a basic imderstanding of the hydration c, portland cement itself, and should have an important bearing o n resolving the setting phenomenon, dimensional change, strength development, durability of concrete, etc. T h e silicate phases, tricalcium silicate (C:,S) and dicalciuin silicate (C,S) together, are present in portland cement to a value of 70 to 80%, and in pastes their hydrolyzed products predominate and dictate many of the properties of the concrete.
T h e progress of hydration of C,S may be followed by several methods, viz. by estiination of the amount of non-evaporable water or calciuin hydroxide, o r by estimation of the strength or amount of heat developed. These are indirect methods; they assume that the products of hydrolysis of C,,S have a constant chemical coinposition throughout the course of hydration. It is known, however. that the calcium silicate hydrate product has a variable composition in terms of CaO/SiO, ratio during the course of hydration. A simple and convenient way to follow the rate of hydration of C,,S or C,S is to deterinine the amount of silicate hydrated at different times.
In the direct inethod of following hydration of C,S, X-ray quantitative analysis is most widely applied [I]. T h e techniques of differential thermal analysis (DTA), dynamic differential calorimetry, and therinograviilletric analysis have been widely used to estimate the Ca(OH), content in hydrating C,,S o r C,S. These are, however, indirect methods of following hydration. I11 the T G inethod of estimation of C,S suggested by Loilguet [2], especially in clinkers. the free lime is extracted and the
182 R A M A C H A N D R A N : ESTIMATION OF T R l C A L C l U M S I L I C A T E
sample is heated in an atmosphere of CO, at 880" for 12 hrs. The following reac- tion takes place: C,S
+
CO, + CaCOZi+
C,S. The TG curve gives losses due to decarbonation and from these the C,S content is estimated. The values thus obtained approximate those calculated by Bogue's method o r by microscopy. The method is somewhat tedious and it is doubtful whether the reaction between+ C,S and CO, goes to completion. Complications arise when the method is applied to cement pastes.
Tricalcium silicate heated from ambient temperature to about 1000" shows a t least four reversible thermal transformations a t approxin~ately 585, 915, 975 and 990" [3]. The transformations leading to the development of these peaks are still not resolved, but it is well recognized that the transition at about 915" involves absorption of the maximum amount of heat; in other words, of the endothermal t
effects, that near 915" has the maximum amplitude (Table 1). The amplitude of Table I
Characteristics of the reversible transitions of C,,S
mate
I
I A S S I G N M E N T 1 broad valley charac- tcrlstic temp. of transfor- mation,sharp and most intense
Triclinic I$ a g P transition Triclinic I 1
-- - -- Heat of
Nature of the
1
transfor-Triclinic IT= ' Triclinic g
Triclinic I I I
1
Monoclinic Iendotherm
Regourd [ 5 ]
sharp, less 1 Triclinic I I 1 g
j
Monoclinicg intense Monoclinic TrigonalI
j matlon.
Miyabe and Roy [61 Jetfery [71 ('1
I
very small peak 1 Monoclinice (detectable only Orthorhornbic with high reso-
lution DTA) 141 I I Triclinic g I .O Monoclinic
~
Monoclinice 0.5 Trigonalthis effect can be used to estimate the C,S content in hydrating C,S. In fact, heats of transitions of such materials as quartz and potassium s ~ ~ l p h a t e have been used in the calibration of heats of reaction in DTA.
Few attempts have been made to use the heat of polymorphic transition of C,S for estimating it in hydrating systems. One of the reasons is that in the usual hydration experiments low sensitivities are used; otherwise the peak due to Ca(OH), will be too intense to be accommodated in the recording paper. Under such con- ditions the endothermic effects due to transitions in C,S become too feeble to be
R A M A C H A N D R A N . E S T I M A T I O N O F T R l C A L C l U M S I L I C A T E 183
detected in the curve. A second reason why the DTA method has not been em- ployed for estimating C,S is that as hydration progresses the carbonated product, the C - S - H phase, and crystallization of the dehydrated C - S - H all
I produce effects that tend to interfere or co~npletely mask the endothermic effect
due t o crystallization transitions in C,S.
In the present paper a method is proposed for estimating the amount of C3S during hydration by endothermic transition a t about 915". By way of a typical example C3S is hydrated for different periods and the degree of hydration deter- mined by D T A technique is compared with that obtained by X-ray quantitative analysis.
Experimental
Materials
The sample of tricalcium silicate used in this work was made available by the Portland Cement Association, U.S.A., and had the following composition expressed as a percentage ignited basis.
Chemical: CaO, 73.88; SiO,, 26.17; A1,0,, 0.08; free CaO (ASTM), 0.18;
free CaO (Franke), 0.46. Mineralogical: C3S, 99.33; C,S, 0.00; C,A, 0.21 ; CaO (Franke), 0.46. Fineness: Blaine 3310 cm2/g.
Hydration of C3S was carried out by mixing it with double-distilled water a t a water :silicate ratio of 0.5. After mixing the solid with water, the paste was trans- ferred to a tightly-covered polyethylene container and rotated continuously for 24 hrs. At intervals of 1, 3, 7, 14 and 28 days each sample was ground and placed in a desiccator, and was continuously evacuated for 24 hrs using liquid air in the trap. Care was taken to prevent contamination with CO,.
Differential thermal measurements were obtained by the 900-Du Pont thermal analyser. The unit consists of a furnace capable of attaining a temperature of 1200°, platinum cups for housing both sample and reference material, platinum versus platinum-rhodium thermocouples for measuring sample temperature and differential temperature, heating and cooling modes of operation, a variable AT sensitivity with 0.004 mV/in. as the upper limit.
In each experiment a constant quantity of the sample passing through a 100- mesh sieve was placed in the platinum cup with a moderate pressure. Ignited 2-Al,O, was used as a reference material. D T A curves were obtained at a heating rate of 20°/min. The cold junction was maintained at 0" with crushed ice. D T A curves are presented with the temperature on the X-axis and the differ- ential temperature as millivolts a t a sensitivity of 0.02 or 0.004 mV/in. i n cal- ibration experiments the mixture containing a weighed amount of C,S and a-Al,O,
184 R A M A C H A N D R A N : ESTIMAT[ON O F T R I C A L C ~ U M SILICATE
was thoroughly mixed n~anually with agate and mortar and finally with the Wig-1-bug vibrator.
Thermogravimetric analysis of the hydrated calcium silicates was conducted with a Cahn R. H. electrobalance under vacuum at a heating rate of IOO/min.
Results and discussion
Tricalcium silicate exhibits several endothermic effects representing polymorphic
.
transformations, which are reversible. Of these transformations, that occurringat a characteristic temperature of about 915" is not only sharp but also associated with the maximum amount of heat energy. An attempt has therefore been made
726 8 0 6 886 96L lOL0 111L
-
Temperature ,'C
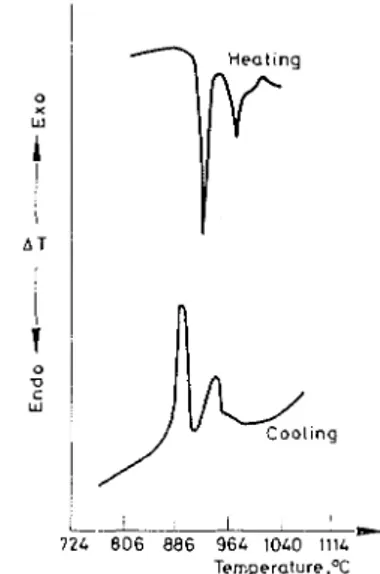
Fig. 1. Reversible endothermic transitions in C:,S
to estimate C,S by measuring the intensity of this effect. The reversibility of the two most intense endothermic peaks of C,S is shown in Fig. 1. In the cooling cycle the peaks reappear but have shifted and are less sharp, with slightly decreased amplitude. The areas enclosed by these exothermic peaks would be of the same magnitude as the endothermic peak areas occurring during the heating cycle.
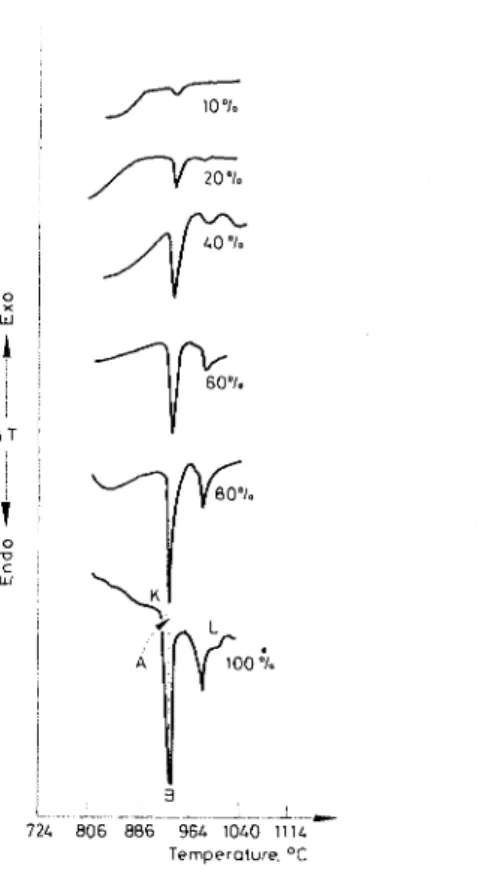
Proper standardization is a prerequisite of any esti~nation by DTA. This was accomplished by mixing C:,S with different amounts of ignited a-Al,O, to obtain mixtures containing 10 to 80% C,,S. DTA curves of these mixtures and of pure C,S (AT, 0.004 mV/in.) indicate an intense endothermic peak at about 940" for C,S, decreasing with decrease in CBS (Fig. 2). As the ther~nal effect is "
sufficiently sharp, it was decided that the peak height rather than the thermal peak area would be more direct and accurate for quantitative estimations.
R A M A C H A N D R A N : ESTIMATION OF TRICALCIUM SILICATE 185
Some endotherms showed a base line shift. In such cases the peak height was obtained as illustrated for 100
%
C,S in Fig. 2. Point K. representing the beginning of the endotherm, and point L, at which the curve ends. were joined. A perpen-Temperature. O t
Fig. 2. Variation of endothermic peak amplitude with C:,S content
c3s. "1.
186 R A M A C H A N D R A N : ESTIMATION O F TRICALCIUM SILICATE
dicular line (with respect to the temperature axis) was drawn from the apex of the peak (B) to meet the line KL at A. The length AB is designated as peak height or amplitude and was used for calibration purposes.
In Fig. 3 are plotted the peak heights of the endothermic transformation realized for different percentages of C,S in the (C3S
+
Al,O,) mixtures. A linear relation is evident. This calibration curve was used to estimate the amounts of unhydrated IC,S in samples of C:,S hydrated for different periods.
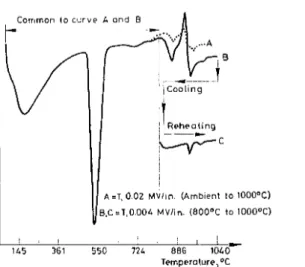
Fig. 4.iElimination of interfering effects in hydrated C:,S
A direct application of this procedure presents certain problems. In most reported work a low sensitivity for AT has been used throughout the course of heating to estimate Ca(OH), from its endothermic effect [9]. At such a low sen- sitivity the effects due to C,S transitions were either not registered at all or were of too low an amplitude. Figure 4 illustrates this aspect more clearly for a hy- drated C,S sample. Curve A refers to a low sensitivity setting wherein a large peak due to Ca(OH), is evident. Beyond 900°, however, the endothermic curve for the C,S transitions is barely registered and is not suitable for a quantitative estima- tion. A distinct peak due to endothermic transition could be obtained along with a measurable peak for Ca(OH), by carrying out DTA a t two different sensitivities, i.e., a t a low sensitivity up to about 800" and then switching over to a higher sensitivity u p to 1000". By such a simple manipulation curve B results. Curve B L refers to a hydrated C,S with AT sensitivity of 0.02 mV/in. up to about 800°, and with 0.004 mV/in. sensitivity beyond this temperature. This curve shows three endothermic and one exothermic effect. The exothermic effect partly inter- feres with endothermic transition in C,S; this may become more pronounced at longer periods of hydration.
RAMACHANDRAN: ESTIMATION-OF T R I C A L C I U M SLLLCATE
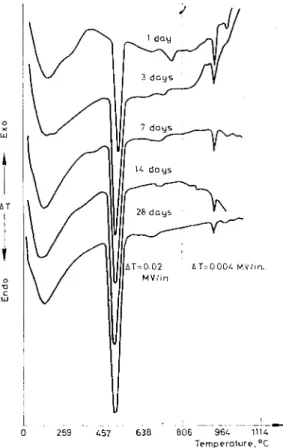
Fig. 5. D T A curves of C,S hydrated for different periods
The interfering effects may be due to decarbonation, crystallization of 8-Wol- lastonite and the dehydration effect of calcium silicate hydrate. A method was discovered to annul these interfering effects. As already described the material was heated t o a temperature of about 800" at a low sensitivity, heated to 1000" at a higher sensitivity, cooled to 800°, and reheated to a temperature of 1000°, as shown below.
Hydrated C,$S Heat (AT = 0.02 mV/in.) Heat (/IT = 0.004 mV/in.)
+ 800- - - .looOo
(Ambient temperature) Ca(OH), peak Endothermic C,S transitions
+
interfering effects
Cool (AT= 0.004 mV/in.)
800" - pp
1 Exothermic (reversible) C,S transit~ons
i
Heat ( J T = 0.004 mV/in.)- - - -
-
1000"Endothermic C,S transitions minus interfering effects
188 R A M A C H A N D R A N : ESTIMATION OF TRICALCIUM SILICATE
Under such a heating schedule the interfering effects can be overcome because they are not reversible. In Fig. 4 curve C represents a curve free of interference effects. X-ray. Kantro et al 20/
-
X-ray.Lochert
.
DTA, t h ~ s study 01 I I D -1 3 7 1L 28Period of hydrallon, days
Fig. 6. Co~nparison of rate of hydration of C:,S by DTA and X-ray methods
This method was used to determine the amounts of unhydrated C3S remaining in C,S hydrated for different periods (Fig. 5). In curves for 14 and 28 days of hydration the interference effects have been eliminated by the reheating method. Duplicate determinations of the heights of the peaks attested to its reliability. The degree of hydration of C,S could then be calculated, on ignited basis, by obtaining ignition loss values through thermogravimetric analysis.
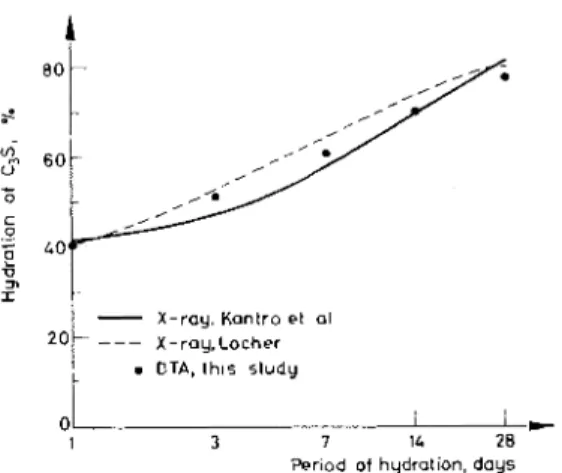
The percentage of C,S hydrated a t different periods, determined by DTA, are plotted in Fig. 6 . A comparison is made by extrapolating the results obtained through quantitative X-ray analysis by Kantro et al. [lo] and Locher [ l l ] . Con- sidering the possible variability in the starting material, hydration procedure and determination, the correlation between DTA and X-ray determinations is very good.
Conclusions i
By adopting a calibration standard, a high sensitivity and manipulation of the heating schedule DTA may advantageously be applied to estimate amounts of C3S and Ca(OH)l. This method should be particularly applicable to a determina- tion of the rate of hydration of C,S or portlsnd cement in the presence of admix-
R A M A C H A N D R A N : ESTIMATION O F T R I C A L C I U M SILICATE 189
lures and additives. The method can be extended to the estimation of P-C,S, which also exhibits reversible transitions. Caution should be exercised if the poly- morphic transition in C,S is affected by the presence of another component.
The author wishes t o thank G . M. Polomark, for experimental assistance.
This paper is a contribution from the Division of Building Research, National Research Council of Canada, and is published with the approval of the Director of the Division.
References
1. L. E. COPELAND and D. L. KANTRO, Proc. Vth Intern. Symp. Chem. Cements, Tokyo, Part 2, 1968, p. 387.
2. P. LONGUET, Rev. Materiaux Constr., 1 (1960) 537.
3. A. GUINIER and M. REGOURD, Proc. Vth Intern. Symp. Chern. Cements, Tokyo, Part 1, 1968, p. I.
4. A. I. BOIKOVA and N. A. TOROPOV, Dokl. Akad. Nauk SSSR, 156 (1964) 1428. 5. M. REGOURD, Bull. Soc. F r a n ~ . Mineral. Crist., 87 (1964) 241.
6. H. MIYABE and D. M. ROY, J . Am. Ceram. Soc., 47 (1964) 318.
7. J. W. JEFFERY, Proc. IIIrd Intern. Symp. Chern. Cements, London, 1952, p. 30. 8. R. ROY, 4th Intern. Symp. Reactivity of Solids, Amsterdam, 1961, p. 225.
9. V. S. RAMACHANDRAN, Applications of D T A in Cement Chemistry, Chemical P ~ ~ b l i s h i n g Co., New York, 1969.
10. D . L. KANTRO, C. H . WEISE and S. BRUNAUER, Symp. Structure of Portland Cement Paste and Concrete, Special Report No. 90, Highway Research Board, Washington, 1966, p. 309.
11. F. W. LOCHER, Symp. Structure of Portland Cement Paste and Concrete, Special Report No. 90, Highway Research Board, Washington, 1966, p. 300.
R i s u ~ i - Le silicate tricalciq~le nlontre ilne transition reversible, intense et caracteristiqile
a
91 5' environ. On peut i~tiliser I'intensitk de cet effet pour estimer la teneur en C,,S des melanges et pour calculer le taux d'hydratation. La sensibilite du signal AT, faible jusqu'a 800' et plus elevee entre 800 et 1000" permet d'estimer a la fois Ca(OH), et C:,S. Les effets d'interfkrence aux tempkratures elevkes dusa
la dkcarbonatation, a la recristallisation en /?-wollastonite, eta
la dkshydratation du silicate calcii~rn hydrate peuvent t t r e evites par chauffage a 100O0, refroidissementa
800" et nouvel Cchauffement. La determination du taux d'hydratation de C,S par A T D recoupe bien les resultats de I'etude ails rayons X.ZUSAMMENFASSUNG - Trikalzi~~rnsilikat zeigt einen charakteristischen Ubergang bei einer
Temperatilr von i~ngefahr 915". Die Intensitat dieses Effektes kann zur Bestimmung der Mengen von C:,S in Gemischen i ~ n d 7.111 Errechnung seines Hydratationsgrades herangezogen
werden. Die niedrige Ernpfindlichkeit fur . IT bis 800' ilnd die hohere zwischen 800-1000"
ermoglicht die Bestimmung von Ca(OH)? ilnd C:,S. InterferenzetTekte bei hoherer Tempera- t ~ ~ r , verursacht durch Entkohlung, Rekristallisation von P-Wollastonit i ~ n d Dehydratation von Kalziirmsilikathydrat, kijnnen durch Gluhen auf 1000r, Abkuhlen auf 800' und erneutes Gluhen behoben werden. Die durch DTA erhaltenen Hydratationswerte von C,S stimmten gilt mit den rontgenographisch erhaltenen Ergebnissen uberein.
190 R A M A C H A N D R A N : E S T I M A T I O N O F T R I C A L C I U M SILICATE
Pe3kO~e - Anrl T ~ U K ~ J I ~ ~ M ~ ~ C U J ~ M K ~ T ~ XapaKTepHO np0rlBneHMe ~ a ~ 6 0 n e e UHTeHCMBHOrO ripe-
BpaWeHUrl npM TeMnepaType OKOnO 915". M H T ~ H C U B H O C T ~ 3TOTO 3 @ @ e ~ ~ a MOXeT 6b1~b UCnOnb30-
BaHa Ann oqeHKu KonArecTBa C,S B cMeca u pacreTa cTeneHu runpaTauuu C,,S. H U ~ K ~ R sye- CTBUTenbHOCTb AT 80 800" U 6onee BbICOKaR rYBCTBMTeJlbH0CTb MeXny 800 ki 1000" AakOT
B03MOXHOCTb OUeHMTb KaK Ca(OH),, TaK U C,S. 3 f $ f $ e ~ ~ b 1 , MelllakOUIMe npU 6onee BblCOKMX TeM-
nepaTypax u 06ycnosne~~b1e ne~ap60~~3aquei1, p e ~ p u c ~ a n n u 3 a ~ u e f i no
8 - B O ~ ~ ~ C T O H U T ~
u E,nerunpa~auuefi r u n p a ~ a c a n u ~ a ~ a ~anbunx, M O ~ Y T 6b1~b npeonone~bl n y ~ e ~ ~ a r p e s a ~ u ~ no 6
1000°, oxnaxneHux no 800" u nosTopHoro HarpesaHufi. C ~ e n e ~ b runpa~aquu C,S, onpenenne- MaR npU pa3nUrHbIX nepUOnaX MeTOAOM ATA, XOpOlIlO KOppenUpyeTCR C AaHHbIMM, nonyrea-
