READ THESE TERMS AND CONDITIONS CAREFULLY BEFORE USING THIS WEBSITE. https://nrc-publications.canada.ca/eng/copyright
Vous avez des questions? Nous pouvons vous aider. Pour communiquer directement avec un auteur, consultez la première page de la revue dans laquelle son article a été publié afin de trouver ses coordonnées. Si vous n’arrivez pas à les repérer, communiquez avec nous à [email protected].
Questions? Contact the NRC Publications Archive team at
[email protected]. If you wish to email the authors directly, please see the first page of the publication for their contact information.
NRC Publications Archive
Archives des publications du CNRC
This publication could be one of several versions: author’s original, accepted manuscript or the publisher’s version. / La version de cette publication peut être l’une des suivantes : la version prépublication de l’auteur, la version acceptée du manuscrit ou la version de l’éditeur.
Access and use of this website and the material on it are subject to the Terms and Conditions set forth at
Precision and accuracy of guarded hot plate method
Bomberg, M. T.; Solvason, K. R.
https://publications-cnrc.canada.ca/fra/droits
L’accès à ce site Web et l’utilisation de son contenu sont assujettis aux conditions présentées dans le site LISEZ CES CONDITIONS ATTENTIVEMENT AVANT D’UTILISER CE SITE WEB.
NRC Publications Record / Notice d'Archives des publications de CNRC:
https://nrc-publications.canada.ca/eng/view/object/?id=5546d1ab-b420-450c-94ad-61db3e1a4fac https://publications-cnrc.canada.ca/fra/voir/objet/?id=5546d1ab-b420-450c-94ad-61db3e1a4fac
Ser
T H ~
National Research
Conseil national
~ 2 1 d
+
Council Canada
de recherches Canada
lo. 1125c. 2 BLDG
,
PRECISION AND ACCURACY OF GUARDED HOT PLATE METHOD
by M. Bomberg and K.R. Solvason
Reprinted from
Thermal Conductivity 17 Proceedings
17th. International Thermal Conductivity Conference Gaithersburg, MD. June 15
-
18,1981p. 3 9 3 - 4 1 0
DBR Paper No. 1125
Division of Building Research
j u s t e s s e que l ' o n peut a t t e i n d r e a v e c l e GHP (guarded h o t p l a t e ) d e 450
mm
du CNRC comportant un 6 l h e n t de chauffage p r i n c i p a l d e 300 mm e t un c a r t e r c h a u f f a n t de p r o t e c t i o n de 75mm,
e t avec un GHP de 600mm
comportant un 6 l h e n t de chauffage p r i n c i p a l de 300 mm e t un c a r t e r c h a u f f a n t de p r o t e c t i o n de 150 mm. Seules les i n c e r t i t u d e s a t t r i b u a b l e s aux i n s t r u m e n t s o n t&ti5
a n a l y s k s .Edited by J, G. Hust
(Plenum
Publishing
Corporation, 19831PRECISION
AND
ACCURACY OF GUARDED HOT PLATE METHODM. Bomberg and K.R. Solvason Thermal Properties Section Division of Building Research National Research Council of Canada Ottawa, Canada KIA OR6
ABSTRACT
This paper presents a summary of an investigation of the precision and accuracy achievable with the NRCC 450 mm square GHP with a 300 am main heater and a 75 mm guard ring heater and a 600 mm GHP with 300 nrm main and a 150 mm guard ring heater. Only the uncertainties that may be attributed to the instrument are discussed here.
INTRODUCTION
This paper deals with instrument errors as calculated or
measured on "ideal" specimens and illustrates the precision to which the thermal resistance of a stable specimen can be determined at the National Research Council of Canada (NRCC) laboratories.
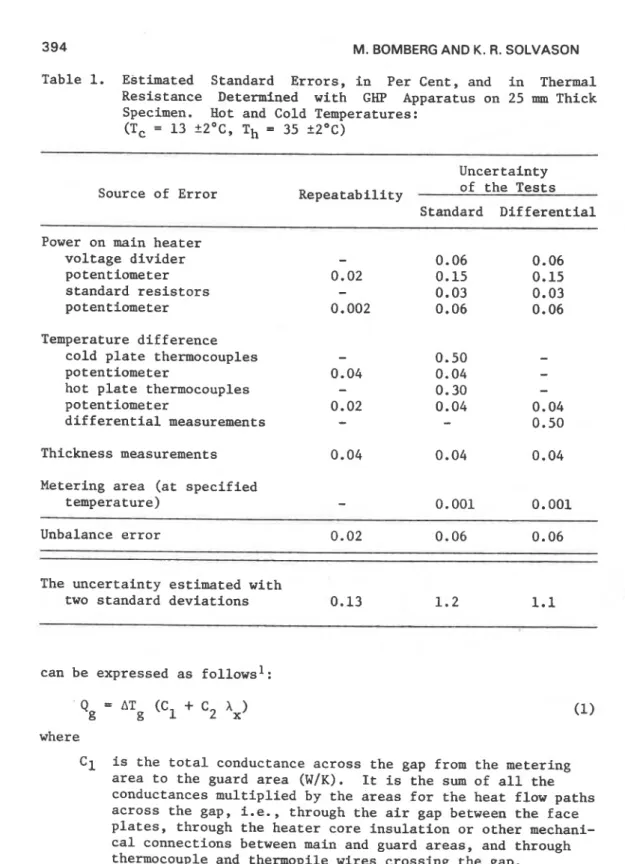
The basic measurement errors, those of temperature, thickness and power, are listed in Table 1. These uncertainties may be compared with the uncertainty in repeating measurements on the same specimen. The agreement is satisfactory since the repeatability precision determined for both 450 and 600 mm square guarded hot plate
(GHP) on the two sigma level was less than about 0.2%.
Having established the basic measurement error, the other errors of the GHP method, i.e., unbalance error, Eg, and specimen edge heat loss error, Ee, can be analyzed.
Unbalance Error
Table 1. Estimated Standard Errors, in Per Cent, and in Thermal
Resistance Determined with GHP Apparatus on 25 mm Thick
Specimen. Hot and Cold Temperatures:
(Tc = 13 +2OC, Th = 35 +2"C)
Uncertainty
Source of Error Repeatability of the Tests
Standard Differential Power on main heater
voltage divider
-
0.06 0.06potentiometer 0.02 0.15 0.15
standard resistors
-
0.03 0.03potentiometer 0.002 0.06 0.06
Temperature difference
cold plate thermocouples
-
0.50-
potentiometer 0.04 0.04
-
hot plate thermocouples
-
0.30-
potentiometer 0.02 0.04 0.04
differential measurements
-
-
0.50Thickness measurements 0.04 0.04 0.04
Metering area (at specified
temperature)
-
0.001 0.001Unbalance error 0.02 0.06 0.06
The uncertainty estimated with
two standard deviations 0.13 1.2 1.1
can be expressed as follows1 :
where
C1 is the total conductance across the gap from the metering
area to the guard area (w/K). It is the sum of all the
conductances multiplied by the areas for the heat flow paths across the gap, i.e., through the air gap between the face plates, through the heater core insulation or other mechani- cal connections between main and guard areas, and through thermocouple and thermopile wires crossing the gap.
C2Ax is the lateral heat flow through the specimens per unit of temperature difference (W/K). The heat flow is assumed to be proportional to the lateral conductivity of the
specimens, , A, (W/mK).
C2 then is the effective area for heat flow parallel to the plate divided by the effective length of the heat flow path
(m2/m or simply m).
Equation (1) is identical to an equation of Woodside and wilson2 for isotropic materials
(A,
=A
) and for test conditions where theY
specimen contribution to the heat flow described by Eq. (1) is constant, and thus the parameter C2
A,
becomes a constant.C1 and partly C2 can be considered characteristic of the plate, both are proportional to the main heater perimeter and roughly inversely proportional to gap width. C1 is also influenced by the size, length, and number of thermocouple and thermopile wires crossing the gap; the thickness of the face plates; and the thermal conductance of any material that bridges the gap. The value of C1 may only be constant if the edge of the main heater face plate is isothermal and the inside edge of the guard ring face plates is isothermal. Since C1 represents the sum of the heat flow through at least three paths, a AT may exist on one path even though the mean AT for the whole gap is zero.
The heat flow through the metered area of the specimen normal to the plate is:
where
AT = Th-Tc, the temperature difference between the hot and cold plates (K)
A
= the area of the main heater, that is, to the centre of the gap (m2)Ay
= thermal conductivity of the specimen in the direction normal to the plate (W/mK)L = thickness of the specimen (m).
The power, Q', supplied to the main heater differs from Q by the lateral heat flow, Qg.
The unbalance error then is:
When Qg is very small compared with Q', Eq. (4) can be simplified to:
In this report, the unbalance error, Eg, is defined as a ratio of heat flow across the gap between metering and guard ring heaters to the power supplied to the metering area. The uncertainty of the unbalance err= is +0.06%. The repeatability of the unbalance error is ?0.02%.
Error Due to Specimen Edge Losses
When the ambient air temperature is maintained at the mean temperature of the specimen, half of the specimen edge temperature is higher and half lower than the ambient; the result is heat exchange, and a distortion of heat flow lines. Any difference between the average heat flux in the metering volume of the specimen and the heat flux on the main heater causes so-called edge loss error.
The error caused by multidimensional heat- flow may be reduced in the following ways:
(1) By limiting sample thickness relative to the width of the guard heaters.
(2) By using additional edge insulation.
( 3 ) By limiting unbalance between the main and guard heaters
since unbalance creates additional distortion of the heat flow lines.
(4)
By maintaining ambient air temperature equal to the specimen mean temperature and, therefore, limiting the difference between heat loss and heat gain at the specimen edges.The edge loss error depends on specimen thickness, edge insulation, and ambient air temperature. Thus, the accuracy with which it can be determined depends largely on how well all of the
other errors can be evaluated, on the testing technique, and on the characteristics of specimens used for the determination. These factors are discussed further in the experimental analysis.
Experimental Analysis of Edge Loss Error
Let us assume that the unbalance errors have already been determined, necessary corrections introduced, and the only error of the GHP apparatus is the edge loss error.
Edge losses are expected to depend on spatial distribution of
the ambient temperature (variation between sides or elevation), ambient temperature variation with time, difference between mean specimen and mean ambient air temperatures as well as the level of edge insulation applied in the test.
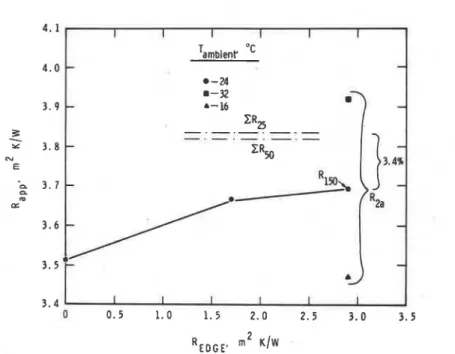
The effect of edge insulation and ambient air temperature was checked on 25 mm thick polystyrene specimens tested in the 450 mm GHP with a 300 nun metering area. Figure 1 shows the thermal resistance
of a 150 mm polystyrene stack composed of six specimens divided with paper septa.
The stack of polystyrene specimens was tested with and without different edge insulations (Re = 1.7, 2.4, and 2.9 m2~/w).
Fig. 1. Apparent thermal resistance of.150.m thick polystyrene/paper stack, tested on 450 nun GHP as a function of edge insulation.
A sum of thermal resistance of 25 and 50 mm layers is shown also.
Figure 1 shows that the lack of edge insulation introduced significant errors for the 150 mm thick polystyrene specimen. The difference between values obtained without edge insulation and with insulation having an Re = 2.9 m2K/w tested at ambient temperature equal to mean specimen temperature was 4.6%. Although the presence of some edge insulation (Re = 1.7 m2K/w) increased the apparent thermal resistance by 4.3%, the additional increase of edge insula- tion to Re = 2.9 m2K/w was not very effective and resulted in a further increase of only 0.3%. The test results with the ambient temperature at 16OC and 3Z°C differed from those with an ambient temperature of 24OC by about -7% and +7% respectively. This indicates that for thick specimens ambient temperature must be controlled fairly close to specimen mean temperature.
The apparent resistance (3.694 m2K/w) obtained on the 149.4 ma specimen with R2.9 edge insulation and with ambient air temperature equal to specimen mean temperature was about 3.3% lower than the sum of the individual R values for the six 25 5 thick layers as reported in Table 2.
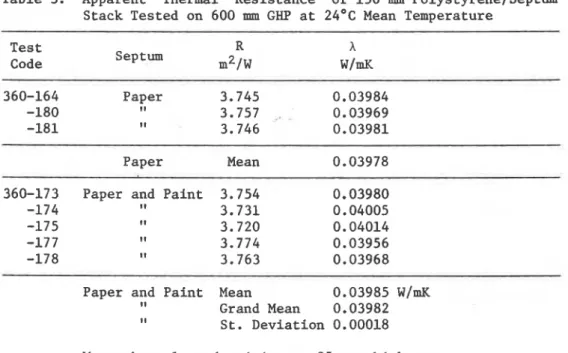
Thermal resistance of the same material was determined in the other GHP using other pieces of polystyrene to build up the test specimen for the 600 mm square plate.
In addition to a standard Kraft paper septum, a special septum was used, i.e., the paper was coated with a few layers of paint known to be opaque to long wave radiation. Table 3 shows that the
difference in results for the coated and uncoated septum did not exceed the variability of test results.
The thermal conductivity from Table 3 is 0.03985 W/mK, i.e., about 1.8% higher than the value 0.03912 W/mK determined on the 25 mm thick specimens.
Another test, labeled "Lateral Heat Flow Test" conducted on a 150 mm thick polystyrene specimen in the 600 mm GHP. The plates, cold plate, guard ring and main heater plates were all maintained at about 3 5 O ~ , and the ambient air temperature was maintained at about 10'~. The heat loss from the edge of the specimen may, therefore, be assumed symmetric, half from the cold plate and half from both the guard ring and the main heater plates. The main heater output, corrected for the small temperature difference across the specimen
(0.04OC) was 0.057W (Table 4), and this output represents the edge loss associated with a 26.4OC temperature difference between the heater plate and ambient.
In a standard test, the specimen is exposed to a temperature difference that varies from (Th
-
Tc)/2 to zero or to a mean temperature difference of (Th-
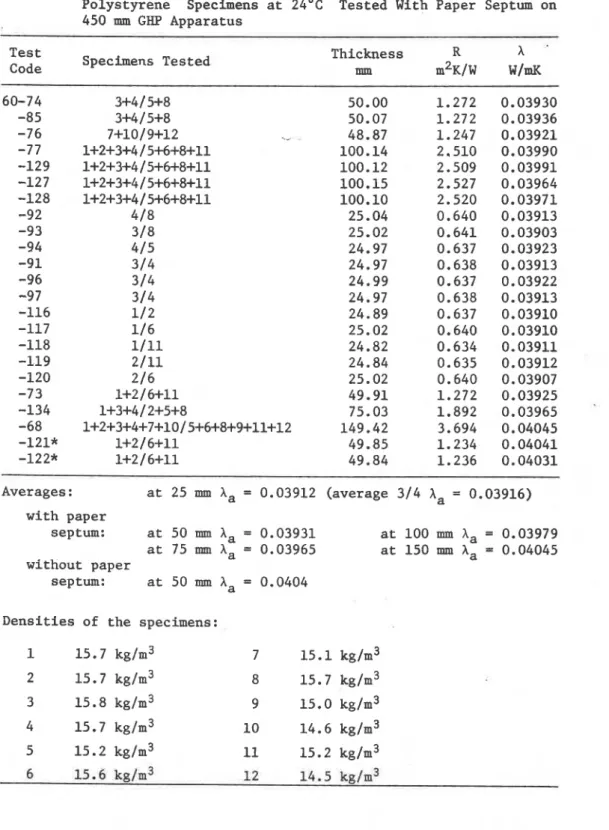
Tc)/4. The percentage error indicated by this heat flow can then be expressed as:Table 2. Apparent Thermal Resistance of Separate or Stacked 25 mm Polystyrene Specimens at 24OC Tested With Paper Septum on 450 mm GHP Apparatus
Test Specimens Tested Code Thickness R h s mm m2~/w W/mK Averages : at 25 mm A, = 0.03912 (average 314
Aa
= 0.03916) with paper septum: at 50 mmXa
= 0.03931 at 100 mm Aa = 0.03979 at 75 mm ha = 0.03965 at 150 mm ha = 0.04045 without paper septum: at 50 mm ha = 0.0404 Densities of the specimens:Table 3. Apparent Thermal Resistance of 150 mm Polystyrene/Septum Stack Tested on 600 mm GHP at 24OC Mean Temperature
Test Code Septum 360-164 Paper 3.745 0.03984 -180 I I 3.757 . 0.03969 -181 I I 3.746 0.03981 Paper Mean 0.03978 . . - - . . . - . .
360-173 Paper and Paint 3.754 0.03980 -174 I I 3.731 0.04005 -175 11 3.720 0.04014 -177 I I 3.774 0.03956 -178 I I 3.763 0.03968 Paper and Paint Mean 0.03985 W/mK
I 1
Grand Mean 0.03982
I I
St. Deviation 0.00018
Mean thermal conductivity at 25 mm thickness
A
= 0.03912 W/mK (from Table 3) Difference between mean measured on 150 and 25 ram thicknessTable 4. Lateral Heat Flow Through Polystyrene/Paper Stack With 150 mm Thickness
Specimen Main Total
where
EL = maximum edge loss error in a standard test due to lateral
heat flow, %.
ATR = temperature difference between plates and the ambient
air, OC.
ATo = temperature difference between main heater and cold plate,
(Th
-
Tc) OC.Qo = heat output on main heater, w/m2, in a standard test.
QR = as above but in a lateral heat flow test.
Substituting data from Tables
4
and 6, one.obtains the maximum edgeloss error:
This would suggest that the 1.8% error indicated by Table 3 consists
of about 1.2% edge loss and about 0.6% unbalance error. Experimental Analysis of Unbalance Errors
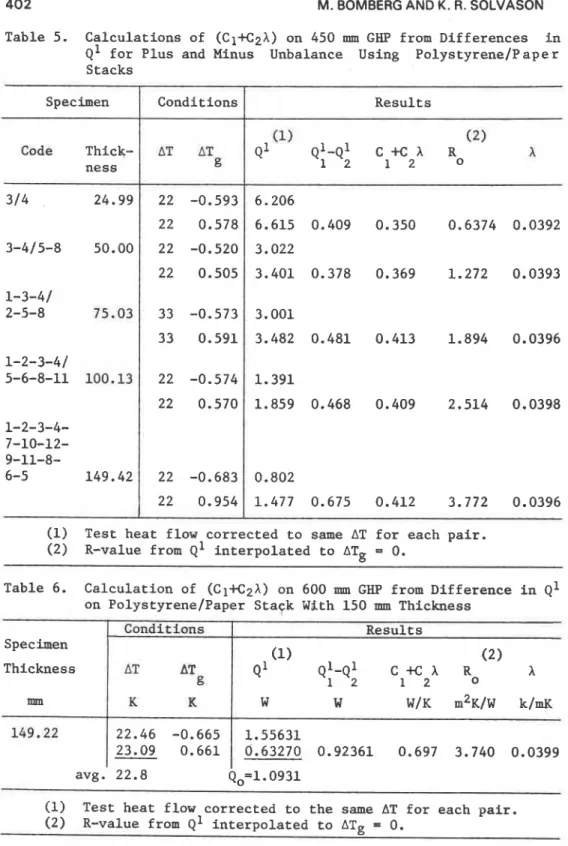
Table 5 shows the results of unbalance tests on 450 mm GHP. In
the test, the guard ring temperature was controlled from 0.5 to 0.6OC above and below the main heater temperature. The temperature
difference was calculated from the differential thermopile output.
The values for C1
+
C2A, shown in Table 6, were calculated from thedifference in heat flow for the positive and negative test values. Heat flows were corrected to the same temperature difference for the
tests with plus and minus guard ring unbalance, ATg. C1
+
C2X valuescalculated in this manner are shown in Table 5.
Two conclusions may be drawn from the results shown in Table
5,
namely:
(1) Unbalance errors are dependent on the specimen thickness,
as shown by an approximately 16% increase in C1
+
C2Xbetween 25 mm and 100 mm thicknesses.
Table 5. Calculations of (C1+C2X) on 450 mm GHP from Differences in
Q1 for Plus and Minus Unbalance Using PolystyreneIP ape r
Stacks
(1) Test heat flow corrected to same AT for each pair.
(2) R-value from Q1 interpolated to ATg = 0.
Specimen Code Thick- ness 314 24.99 3-415-8 50.00 1-3-41 2-5-8 75.03 1-2-3-41 5-6-8-11 100.13 1-2-3-4- 7-10-12- 9-11-8- 6-5 149.42
Table 6. Calculation of (C1X2A) on 600 mm GHP from Difference in Q1
on PolystyreneIPaper Staek With 150 mm Thickness
Conditions AT
AT
g 22 -0.593 22 0.578 22 -0.520 22 0.505 33 -0.573 33 0.591 22 -0.574 22 0.570 22 -0.683 22 0.954 . . ThicknessI
ATQ:-Q:
c
x
Ano
A 1 2 Results (1) (2)Q'
Q'-Q~c
i-c hX
1 2 1 2 6.206 6.615 0.409 0.350 0.6374 0.0392 3.022 3.401 0.378 0.369 1.272 0.0393 3.001 3.482 0.481 0.413 1.894 0.0396 1.391 1.859 0.468 0.409 2.514 0.0398 0.802 1.477 0.675 0.412 3.772 0.0396 Specimen Conditions mm 149.22 Results (13 (2) avg. 22.8 Qo=l. 0931(1) Test heat flow corrected to the same AT for each pair.
(2) R-value from Q1 interpolated to ATg = 0.
K
K
22.46 -0.665 23.09 0.661w
w
W/K rn2~/w k / m ~ 1.55631 0.63270 0.92361 0.697 3.740 0.0399to a significant distortion of heat flow lines without affecting C1
+
CzA, as shown by results on 75, 100 and 150 mm thick specimens. The additional specimen edge loss in tests on the thick specimens did not appear to alter the mean to indicated gap-temperature-difference ratio.The values of (C1
+
C2A) = 0.35 to 0.41 W/K indicate that when ATg is controlled to f0.01K the maximum probable error on heat input is about f0.004W.
The percentage error related to the polystyrene specimens used in the evaluation and tested at a 22OC temperature difference would be 0.06% at 25 mm thickness and about 0.39% at 150 mm thickness.Table 6 shows the calculation of (C1
+
C2h) for 600 mm GHP for the same specimens of polystyrene as those used in 450 mm GHF' verifi- cation. The number (C1+
C2A) being 70% higher indicates more"thermal bridging" through the gap than in 450 mm GHP. For O.Ol°C
unbalance on 150 mm polystyrene/paper stack, the probable error becomes 0.66%.
COMPUTER ANALYSIS OF GHP ERRORS
A commercial* stress-strain and thermal analysis program, ANSYS,
was used to simulate the heat flux and temperature distribution through a specimen in a G W . The simulations were mainly concerned with edge loss errors and did not analyze the heat transfer across the air gap.Two different models were examined:
(i) three-dimensional model with boundary conditions of
uniform but different heat flux in main and guard heaters, model 1
(ii) three-dimensional model with isotherma3, plate surfaces, model 2.
The calculations were performed on a quarter of the specimen divided into one thousand parallelpipeds and a quarter of the metal plates divided into one hundred parallelpipeds. The specimen thermal conductivity was assumed to be uniform throughout and equal to
0.03912 W/mK. The air gap resistance was selected in such a way that it produced the same sensitivity to temperature unbalance as had been found by experiment.
Model 1 was based on uniform but different heat fluxes supplied under the face plate areas of the heater plate. The cold plates were assumed to be isothermal.
A
trial and error procedure was required to set the heat fluxes. The heat flux applied to the main heater plate was such that it would produce the required temperature gradient in one-dimensional heat flow and the heat flux initially applied to the guard ring heater was about 15% higher. When the program was executed, an unbalance between metering and guard areas was calculated and another valiie of the guard heater flux tried, until an unbalance of less than 0.02K was obtained.The first question examined with model 1 was whether there was a significant difference between the integrated temperature difference over the gap and that indicated at a central point on each side, i.e., four points only. For 150 mm polystyrene in the 600 mm GHP
with 22K difference across the specimen, a temperature variation of 0.002K was indicated, but the difference between the integrated ATg and ATg indicated at the center of the gap was less than 0.001K. It indicates that the choice of whether the thermocouples are placed at the center or 113 of the air gap side is perhaps less important than previously expected.
Table 7 shows R-values measured and calculated with the three- dimensional programs for a 150 m thick specimen in the 450 mm GHP. Model 2 indicates very small errors, i.e., 0.3%. This model is based on isothermal plate temperatures that are assumed to extend to the center of the gap and, therefore, heat is supplied to all the
specimen, including the area at the air gap so that the average heat flux entering the central part of the specimen, qo, and the average heat flux on the metering area, q, are equal. Thus, the apparent
AT
thermal resistance Rapp =
-
and the thermal resistance of the9 rn
central part of the specimen Ro = are equal. qo
Model 1 does not simulate heat generation in the air gap layer as the heat flux at each of the boundary points is separately formu- lated in the input data.
An
input flux of 5.738 w/m2 was selected since it would give a 22K temperature difference for a thermal resistance of 3.834 m2~/w.Table 7 shows how the calculated average heat flux, qo, entering the specimen varies with the level of unbalance. Using this heat flux estimate for calculation of thermal resistance Roy one obtains a value close to that of model 2 and only slightly affected by the unbalance. The apparent thermal resistance based on heater output divided by the metering area, q, however, shows a strong dependence on the unbalance.
model 2, particularly as the apparent thermal resistance exceeds the true R-value. It does indicate, however, a different ratio between the heat flux entering the specimen and the average heat flux on the metering area from that calculated for model 2.
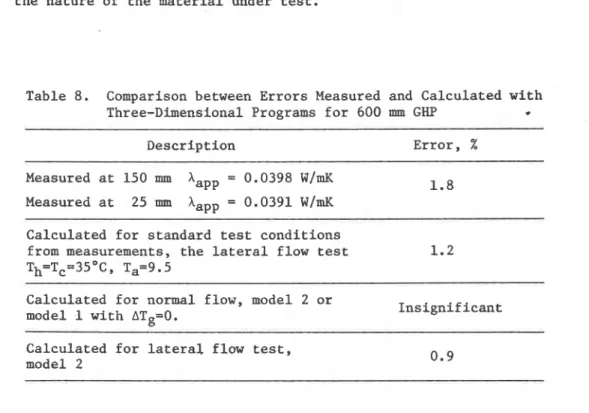
Table 8 shows measurements"and calculation for the 600 mm G W .
The thermal conductivity measured on 150 mm is 1.8% greater than that
determined on 25 mm thick layers. The error of 1.8% on 600 mm GHP
corresponds to the error of 3.3% obtained on 450 mm GHP for these
Table 7. Measured and Calculated R-Values of 150 mm Thgck Polystyrene
Specimen Tested in 450 mm GHP Compared To Measurements on
25 mm Thick Specimens
Heat Flux on the Thermal
Main Heater Meter-
Description Input Into ing
Speci- Area men Resistance m 2 ~ / w -- - - Measured on 25 nun thick (h=O. 03912) 0.15/0.03912 and recalculated
-
-
-
-
-
for 150 mm = 3.834 thickness Measured on 149.4 mm thick 0.15/0.04045 (h=0. 04045) and-
-
6.090 22.58-
recalculated for = 3.708 150 mm thickness Calculated with model 2 (isothermal plates) Calculated with model 1 for 5.738 5.712 5.623 21.79 3.815 3.875 AT, = 0.013K Calculated with model 1 for 5.738 5.589 5.623 21.29 3.810 3.786 AT, = 0.053K Calculated with model 1 for 5.738 5.425 5.623 20.62 3.800 3.667 ATg = 0.112Kspecimens. The calculations with both models 1 and 2 indicate insignificant errors.
Calculations of edge loss errors in a standard test based on the results of "lateral heat flow test" indicate an error of 1.1%.
A
computer simulation using model 2 on the other hand gives O.g%error,i.e., good agreement. Thus, both measurements and calculations as done in the tests labelled "lateral heat flow tests" may be useful for assessment of the errors in testing "thick" specimens.
The computer calculations for standard testing conditions do not agree with the measurements. It would appear, therefore, that the computer program does not adequately simulate the true pattern of heat flow in a GHP, particularly in the area of the gap.
DISCUSSION
Errors in measurement with G W apparatus arise from uncertainty in basic electrical and thickness measurements and from deviations from one-dimensional heat flow. The errors in basic measurements,
for example, ,repeatability precision (for a given level of heat
flux), are a characteristic of the equipment used. The extraneous heat leakage, i.e., unbalance error and edge loss, may also depend on the nature of the material under test.
Table 8. Comparison between Errors Measured and Calculated with
Three-Dimensional Programs for 600 mm GHP
.
Description Error, %
Measured at 150 mm
Aapp
= 0.0398 V/mKMeasured at 25 mm Xapp = 0.0391 W/mK
Calculated for standard test conditions
from measurements, the lateral flow test 1.2
Th'TC=35OC, Ta=9.5
Calculated for normal flow, model 2 or
model 1 with ATg=O. Insignificant
Calculated for lateral flow test, model 2
The materials used in this sfudy were selected to minimize errors caused by material inhomogeneity and testing conditions. Polystyrene with a density of 15 to 16 kg/m3 was selected as a relatively stable material, unaffected by humidity changes during testing. It does, however, exhfbit a significant transmission of long wave radiation making the apparent thermal conductivity
dependent on thickness even when tested with the same mean tempera- ture and temperature difference. To reduce changes in the fraction of long wave radiation in the total heat flux, i.e., to eliminate the so called "thickness effect" a Kraft paper septum was used for each
25 mm thick layer (pelanne3). Thus, 25 mm thick layers were tested
without paper, 50 mm had one paper septum, and 75 mm had two septa. The thermal conductivity determined for the polystyrene
specimens stacked from 25 to 150 mm with and without septa are shown in Fig. 2. A gradual increase in apparent conductivity with the specimen thickness is evident.
Part of the error commonly attributed to the edge losses could well be an effect of increased heat exchange between metering and guard ring heaters, labelled in this paper as the unbalance errors.
0 . 0 3 V
#
I I I I>
0 5 0 100 150 ZOO
T H I C K N E S S , m m
Fig. 2. Apparent thermal conductivity of polystyrene stack with and
Temperature distribution on the plate, particularly in the guard ring area, can produce a variation along the gap. Thus a heat flow across the gap might occur even though the average output from the thermopile is zero. The guard ring heater has to compensate for the heat loss to ambient from the edge of the hot plate and from the edge of the specimen. These losses are proportional to the perimeter length so that when only a single guard ring heater winding is used there is proportionally less heater area to compensate for the heat loss at the corners than at the center of each side. Heat must, therefore, flow laterally and a reduced temperature may be expected in the corners.
The guard ring temperature will be more uniform if two guard ring heater windings are used, a narrow perimeter winding and an inner winding as discussed by Mar6cha14, ~ousselle~ and
ode^.
The perimeter winding can be used to supply the edge loss w:thout requir- ing lateral heat transfer in the face plates (Troussart ). One suitable technique for operating such an instrument consists of adjusting the heat flux on the inner guard heater to a level equal to or slightly lower than that on the main heater and using thedifferential thermocouples across the gap to control the heat output on the outer guard ring. Theoretically, the same heat flux should be used on both sides of the gap, but a slightly lower flux on the inner guard ring heater permits more convenient control of the unbalance temperature.
Increasing the number of differential thermocouple junctions permits a better assessment of the mean temperature difference, but the additional wire crossing the gap also increases the heat
transfer. The influence of construction details on the errors of the GHP method has been discussed by ~oussain~. With a limited number of thermopile junctions, the choice of their location becomes important. This has been discussed by De Ponte and Di ~ili~~o', and by De Ponte, &rotti and stradalO. The percentage of unbalance errors depends on
the level of heat flux. This fact indicates that there is no single value of accuracy for a particular GHP apparatus but that the
accuracy and precision depend on the temperature difference applied as well as on the thickness and resistivity of the test specimen. SUMMARY
The basic estimated instrument error shown in Table 1 agrees well with the repeatability precision determined on a 25 mm thick, "ideal" specimen. At the 95% probability level the repeatability precision is 0.2%. The lowest uncertainty of the GHP's examined is estimated at 1.1%. (Comparison with National Bureau of Standards 1000 mm line-heat-source GHP apparatus discussed in these proceedings showed agreement within 0.3% on low density glass fiber specimens of
Uncertainty of R-value determination depends on thickness and resistivity of the specimen,- as well as the temperature difference applied to hot and cold plates. Using the limits of total
uncertainty of 2 to 2.5% the specimen thickness is limited to less than 60 mm on 450 mm GHP and to less than 100 mm on 600 mm G W . Thicker specimens, even with careful conditioning and using edge insulation in excess of 2 m2~/w, may produce an uncertainty larger than 2.5%.
ACKNOWLEDGMENTS
The authors wish to thank J.G. Theriault for his contribution to the development of the testing methods, and N. Normandin and
R.G. Marchand for making the measurements.
They also wish to express their appreciation to D.G. Stephenson, Energy Coordinator, DBR~NRCC, J.G. Hust and M.C. Siu, National Bureau of Standards, and C .M. Pelanne, Johns-Manville RID, for detailed discussion on the problems of testing thermal insulating materials.
This paper is a contribution from the Division of Building Research, National Research Council of Canada, and is published with the approval of the Director of the Division.
REFERENCES
1. Woodside, W., Analysis of errors due to edge heat loss in guarded hot plates, American Society for Testing Materials Symposium on Thermal Conductivity Measurements, Spec. Tech. Publ. No. 217, 1957, pp. 49-62.
2. Woodside, W., and Wilson, A.G. Unbalance errors in guarded hot plate measurements, Thermal Conductivity Measurements, ASTM Spec. Tech. Publ. No. 217, 1957, pp. 32-46.
3. Pelanne, C.M., Discussion on experiments to separate the effect of thickness from systematic equipment errors in thermal transmission measurements, ASTM Spec. Tech. Publ. NO. 718, D.L. McElroy and R.P. Tye Eds., American Society for Testing and Materials, 1980, pp. 322-334.
4. Margchal, J.C., Mesure de la conductivit6 thermique par la mgthode du champ thermique unidirectionnel, Bulletin RILEM Mat6riaux et Constructions, Vol. 1, No. 5, 1968, pp. 443-456.
5 . Rousselle, J.C., A guarded hot plate apparatus for measuring
thermal conductivity from -80 to +lOO°C. Proceedings of the 7th Conference on Thermal Conductivity, Gaithersburg, Maryland (Nov. 13-16, 1967).
6. Bode, K., Wlrmeleitflhigkeitsmessungen mit dem Plattengerlt: Einfluss der Schutzringbereite auf die messunsicherheit, Int. Journal Heat and Mass Transfer, Vol. 23, 1980, pp. 961-970.
7. Troussart, L.R., Three-dimensional finite element analysis of the guarded hot plate apparatus and its computer implementation. Journal of Thermal Insulation, Vol. 4, 1981, p. 225-252. 8. Doussain, R., Influence du mode de construction des plaques
chauffantes ?i anneau de garde et de l'isolation lat6rale sur la mesure de la conductivit6 thermique des mat6riaux isolants, International Institute of Refrigeration, com. I1 & VI, Liege 1969, Annexe 1969-7, pp. 289-299.
9. De Ponte, F. and Di Filippo, P., Design criteria for guarded hot plate apparatus, Heat Transmission Measurements in Thermal Insulations, ASTM Spec. Tech. Publ. No. 544, 1974, pp. 97-117. 10. De Ponte, F., Marotti, M. and Strada, M., Correlation between
balance and metering area definition in a guarded hot plate apparatus, Commission B ~ , No. 116, 15th International Congress of Refrigeration, Venesia 23-29 Sept. 1979, pp. 1-9.
Canada. I t should not be reproduced i n whole o r in p a r t without p e r m i s s i o n of the original publisher. The Di- vision would b e glad t o b e of a s s i s t a n c e i n obtaining s u c h p e r m i s s i o n .
Publications of the Division m a y b e obtained by m a i l - ing the a p p r o p r i a t e r e m i t t a n c e (a Bank, E x p r e s s , o r P o s t Office Money O r d e r , o r a cheque, m a d e payable to the R e c e i v e r G e n e r a l of Canada, c r e d i t NRC) t o t h e National R e s e a r c h Council of Canada, Ottawa. KIA OR6.
S t a m p s a r e not acceptable.
A l i s t of a l l publications of the Division i s available and m a y be obtained f r o m the Publications Section, Division of Building R e s e a r c h , National R e s e a r c h Council of Canada. Ottawa. KIA OR6.