Cohesin-dependent globules and heterochromatin
shape 3D genome architecture in S. pombe
The MIT Faculty has made this article openly available.
Please share
how this access benefits you. Your story matters.
Citation
Mizuguchi, Takeshi, Geoffrey Fudenberg, Sameet Mehta,
Jon-Matthew Belton, Nitika Taneja, Hernan Diego Folco,
Peter FitzGerald, et al. “Cohesin-Dependent Globules and
Heterochromatin Shape 3D Genome Architecture in S. Pombe.”
Nature 516, no. 7531 (October 12, 2014): 432–435.
As Published
http://dx.doi.org/10.1038/nature13833
Publisher
Nature Publishing Group
Version
Author's final manuscript
Citable link
http://hdl.handle.net/1721.1/103055
Terms of Use
Article is made available in accordance with the publisher's
policy and may be subject to US copyright law. Please refer to the
publisher's site for terms of use.
Cohesin-dependent globules and heterochromatin shape 3D
genome architecture in S. pombe
Takeshi Mizuguchi#1, Geoffrey Fudenberg#2,3, Sameet Mehta1, Jon-Matthew Belton4, Nitika Taneja1, Hernan Diego Folco1, Peter FitzGerald5, Job Dekker4, Leonid Mirny2,3, Jemima Barrowman1, and Shiv I. S. Grewal1
1Laboratory of Biochemistry and Molecular Biology National Cancer Institute, National Institutes of Health Bethesda, MD, 20892, USA
2Graduate Program in Biophysics, Harvard University, Cambridge, MA, 02139, USA
3Institute for Medical Engineering and Sciences, Department of Physics, Massachusetts Institute of Technology, Cambridge, MA, 02139, USA
4Program in Systems Biology University of Massachusetts Medical School Worcester, MA, 01605, USA
5Genome Analysis Unit National Cancer Institute, National Institutes of Health, Bethesda, MD, 20892, USA
# These authors contributed equally to this work.
Abstract
Eukaryotic genomes are folded into three-dimensional structures, such as self-associating topological domains, the borders of which are enriched in cohesin and CCCTC-binding factor (CTCF) required for long-range interactions1-7. How local chromatin interactions govern higher-order folding of chromatin fibers and the function of cohesin in this process remain poorly understood. Here we perform genome-wide chromatin conformation capture (Hi-C) analysis8 to explore the high-resolution organization of the Schizosaccharomyces pombe genome, which despite its small size exhibits fundamental features found in other eukaryotes9. Our analyses of wild type and mutant strains reveal key elements of chromosome architecture and genome organization. On chromosome arms, small regions of chromatin locally interact to form “globules”. This feature requires a function of cohesin distinct from its role in sister chromatid cohesion. Cohesin is enriched at globule boundaries and its loss causes disruption of local globule structures and global chromosome territories. By contrast, heterochromatin, which loads cohesin at specific sites including pericentromeric and subtelomeric domains9-11, is dispensable for globule formation but nevertheless affects genome organization. We show that heterochromatin
Users may view, print, copy, and download text and data-mine the content in such documents, for the purposes of academic research, subject always to the full Conditions of use:http://www.nature.com/authors/editorial_policies/license.html#terms
Correspondence and requests for materials should be addressed to S.I.S.G. ([email protected]).
T.M. and S.I.S.G. designed the experiments. T.M. did the majority of experiments including Hi-C with guidance from J.-M.B and J.D.; G.F., S.M. and L.M. performed the Hi-C computational analyses; P.F. contributed to data analyses; N.T. and H.D.F. provided
HHS Public Access
Author manuscript
Nature. Author manuscript; available in PMC 2015 June 18.
Published in final edited form as:
Nature. 2014 December 18; 516(7531): 432–435. doi:10.1038/nature13833.
Author Manuscript
Author Manuscript
Author Manuscript
mediates chromatin fiber compaction at centromeres and promotes prominent interarm interactions within centromere-proximal regions, providing structural constraints crucial for proper genome organization. Loss of heterochromatin relaxes constraints on chromosomes, causing an increase in intra- and inter-chromosomal interactions. Together, our analyses uncover fundamental genome folding principles that drive higher-order chromosome organization crucial for coordinating nuclear functions.
The 13.8-megabase (Mb) S. pombe genome comprises three chromosomes partitioned into euchromatin and heterochromatin domains12. Clr4 (known as SUV39H in mammals) and HP1 proteins assemble heterochromatin domains at pericentromeric regions, subtelomeres, and the mating-type (mat) locus12. Our Hi-C analysis revealed several genome
organizational features (Fig. 1a).
Centromeres of all chromosomes and telomeres of chromosome 1 and 2 formed two sets of frequently interacting loci, consistent with previous work13,14. Chromosome 3 ends
proximal to ribosomal DNA repeats, which are compartmentalized in the nucleolus, showed no specific interactions with telomeres of chromosomes 1 and 2 (Fig. 1a). Centromeres and telomeres were refractory to interaction with chromosome arms (Fig. 1b), consistent with spatial sequestration and with similar observations in Saccharomyces cerevisiae15. We also found a greater frequency of inter-arm interactions than inter-chromosomal interactions, suggesting a degree of chromosome territoriality16 (Fig. 1c).
We noted a specific inter-chromosomal interaction between the right telomere of
chromosome 1 (tel1R) and mat on chromosome 2 (Fig. 1a, b). Contact frequency was less than that between centromeres or telomeres, but was greater than the average
inter-chromosomal interactions (~9-fold enriched, Fig. 1b). Microscopy confirmed mat/telomere colocalization in a small proportion of cells (Fig. 1d). The dynamic inter-chromosomal
mat/tel interaction at the nuclear periphery13,17 might explain the altered intra-chromosomal pattern interactions at the mat locus (Extended Data Fig. 1).
We observed a notably high frequency of interactions between centromere-proximal regions, indicated by a cross-like pattern of interarm interactions (Fig. 1a and Extended Data Fig. 1). Previously, only direct interactions were observed between centromeres14, and a polymer modeling study did not predict this cross-like pattern for the three S. pombe chromosomes18. We observed similar behavior for different chromosome arm pairs.
The polymer nature of chromatin also has an impact on genome packaging and can be studied using scaling analysis, which captures the dependency of the contact probability on genomic distance, and reflects the underlying chromatin folding status. A slow decay in contact probability at distances <100 kilobases (kb) was followed by a faster decay that falls between that of an unconstrained polymer and the fractal globule, suggesting some degree of local crumpling of the polymer (Fig. 1e and Extended Data Fig. 2)8. The deviation at short distances suggested additional local features of chromosome organization.
Further analyses revealed complex structures along the diagonal of the contact maps, such as at subtelomere 2R (Extended Data Fig. 1). Notably, we observed locally self-interacting
Author Manuscript
Author Manuscript
Author Manuscript
domains ~50-100kb in size, consistent with slow decay of contact probability below 100kb (Fig. 1f). These globules were detected in all chromosomal arms. Their boundaries reflected transitions between preferential upstream and downstream interactions, and often
corresponded to regions enriched for convergent genes (Fig. 1f, g). We find that globules are a prominent feature of local chromatin organization.
Cohesin affects chromatin architecture in budding yeast19,20 and in other eukaryotes5-7,21,22, but its exact role is unclear. Cohesin enrichment at the 3’end of convergent genes (see below)23, which correlate with globule boundaries, led us to investigate its role in globule formation. Hi-C analysis of rad21-K1, which contains a partial loss of function mutation in a cohesin subunit24, revealed a loss of globules and greater intermingling of chromosomes
(Fig. 2a). Centromeres and telomeres were less refractory to interaction with chromosomal arms (Fig. 2b). Moreover, we observed greater intra-chromosomal inter-arm (1.6-fold increase) and inter-chromosomal contact frequencies (2.5-fold increase) compared to wild type (Fig. 2c). Contact probability decay as a function of genomic distance was quite different for rad21-K1. The inflection at 100kb was absent and contact probability decayed more slowly afterwards (Extended Data Fig. 3), indicating loss of locally compacted globules. Globule boundaries corresponded to sites of cohesin enrichment in wild type, but did not correspond to these positions in rad21-K1 (Fig. 2d), suggesting a functional link between cohesin binding and organization of the chromatin fiber.
We next examined the relationship between globules and cohesin profiles binned to 10kb resolution as for Hi-C analysis. First, we measured average insulation around cohesin peaks by calculating the relative contact probability at a given genomic distance (Extended Data Fig. 4a, b). Contact frequency between regions separated by cohesin peaks was depleted in wild type, and this depletion was lost in rad21-K1, suggesting a cohesin-dependent interaction barrier with an effective range of ~50kb-100kb (Fig. 2e). Second, insulation analyses at each cohesin peak showed that cohesin-mediated insulation is a general feature of wild type but not rad21-K1 (Extended Data Fig 4c). Third, we determined the mean number of cohesin peaks as a function of distance to the nearest boundary between preferential upstream/downstream interactions. Cohesin peaks were enriched at boundaries specifically in wild type (Extended Data Fig. 4d). Thus, cohesin maintains globule boundary positions throughout the genome. Finally, a genome-wide correlation between the profile of cohesin enrichment and the depletion of interactions between globules observed in wild type for up to 100kb was absent in rad21-K1, suggesting that both the position and amount of cohesin contribute to boundary function (Extended Data Fig. 4e). Additional factor(s) may also determine globule boundaries.
We then considered the functional importance of cohesin-dependent globules. We found local duplications at loci with high sequence similarity, such as retrotransposons, long terminal repeats and pericentromeric repeats (Extended Data Fig. 5a). Thus, constraints imposed by cohesin may prevent ectopic recombination between repeats. Because defective cohesin also impairs transcription termination at select convergent genes25, we wondered whether cohesin-mediated genome organization acts broadly to restrict inappropriate RNAPII activity. Expression profiling indeed revealed widespread read-through transcripts in rad21-K1 (Extended Data Fig. 5b).
Author Manuscript
Author Manuscript
Author Manuscript
Asynchronous S. pombe cultures contain most cells in G2, in which cohesin is required for sister chromatid cohesion. To determine whether globules are also present in G1, we performed Hi-C and cohesin mapping using the cell cycle mutant cdc10-v50 arrested in G1 (Fig. 3a). Consistent with previous work26, we detected cohesin in G1 cells (Extended Data Fig. 6a), with prominent enrichment at convergent genes (Fig. 3b, c). The Hi-C contact map was similar to asynchronous cells (Extended Data Fig. 6b, c). Importantly, we detected globules in G1 cells, consistent with slow decay of contact probability at short distances (Fig. 3d and Extended Data Fig. 6d). Moreover, cohesin is required for maintenance of globules and inflections in scaling in G1-arrested cells (Extended Data Fig. 6e, f). These results suggest that key features of genome architecture are preserved in G1.
We further analysed G1 globule boundaries. Average insulation around cohesin peaks at globule boundaries indicated that they function as interaction barriers only slightly less efficiently than in asynchronous cells (Fig. 3e). Interaction barrier function was eliminated in G1-arrested rad21-K1 (Extended Data Fig. 6g). Cohesin enrichment inversely correlated with relative contact probability genome-wide, and globule boundary positions overlapped with wild type (Extended Data Fig. 7a-c). Concentrated cohesin might create barriers for local chromatin compaction factors, or the cohesin ring27 might constrict borders to create globules (Fig. 3f). Importantly, we find globules are a feature of both G1 and G2 genome architecture.
Heterochromatin facilitates cohesin binding at specific loci10,11,23,25 and may affect genome organization28. Hi-C analysis of a strain lacking the sole H3K9 methyltransferase Clr4, which is required for heterochromatin assembly12, revealed widespread changes (Fig. 4a). Heterochromatic regions (centromeres, telomeres and mat) were less refractory to genome-wide interactions (Fig. 4b). We observed strong interactions between mat and all telomeres in clr4Δ (Fig. 4b), confirmed by microscopy (54% overlap/proximity). The increased intra-chromosomal inter-arm interactions and inter-intra-chromosomal interactions in clr4Δ (Fig. 4c) are consistent with reduced chromosome territoriality.
Defective cohesin loading could cause global changes in clr4Δ. We observed a major reduction in cohesin at pericentromeric and subtelomeric domains (Extended Data Fig. 8a, b), but not at chromosomal arms where cohesin peaks correlated with convergent gene enrichment (Extended Data Fig. 8c). Consistent with this, globules were not affected in
clr4Δ, and cohesin enrichment was coincident with globule boundaries (Fig. 4d, e and
Extended Data Fig. 7a). Cohesin enrichment and relative contact probability were inversely correlated in clr4Δ, and globule boundaries overlapped with wild type (Extended Data Fig. 7b, c). Thus, the loss of heterochromatin does not affect globules along chromosomal arms. Notably, the cross-like pattern of centromere-proximal interactions was less evident in clr4Δ (Fig. 4a, b, f). These contacts were diminished, as were telomere-telomere contacts
(Extended Data Fig. 9). We used a modified scaling method to further examine contact probabilities between centromere-proximal arm regions of the same and different
chromosomes. We determined contact probability scaling between arm pairs as a function of genomic separation, defined for two loci as the sum of their respective distances from the centromere (Extended Data Fig. 10a). In wild type, inter-arm intra-chromosomal scaling,
Author Manuscript
Author Manuscript
Author Manuscript
between two arms of the same chromosome, was very similar to the intra-arm scaling (Extended Data Fig. 10b). Inter-arm inter-chromosomal scaling, between arms of different chromosomes, was also similar, although shifted slightly lower, indicating a consistently lower contact frequency than for intrachromosomal inter-arm interactions (Extended Data Fig. 10b). In clr4Δ, inter-arm scalings were shifted lower for arms of the same and different chromosomes, indicating lower contact frequency and greater distance between arms extending from centromeres (Extended Data Fig. 10c). This decrease is not due solely to the loss of pericentromeric cohesin, as inter-arm contact between chromosomes in rad21-K1 was similar to wild type (Extended Data Fig. 10c), suggesting that heterochromatin itself organizes pericentromeric regions.
The changes observed in clr4Δ are consistent with an increase in the contour length of pericentromeric regions, resulting from loss of compacted heterochromatin. To explore this, we studied the effect of clr4Δ on chromatin at a pericentromeric domain. Consistent with scaling analysis of clr4Δ, distance distributions increased between the centromere core and a
lacO array inserted outside the heterochromatin domain (Fig. 4g). These results indicate that
chromatin fiber compaction by heterochromatin imposes additional structural constraints. Our results suggested co-linear extension of centromere proximal regions, with less constrained distal regions. To determine whether loss of heterochromatin relaxes these constraints we performed scaling analysis of individual chromosome segments at increasing distance from the centromere. In wild type, contact probability decayed more rapidly for chromosome segments near centromeres than for those farther away, consistent with tight clustering of centromeres and a volume exclusion effect (Fig. 4h). By contrast, contact probability decay was similar for all chromosome segments in clr4Δ, regardless of distance from the centromere (Fig. 4h). These results indicate that chromatin compaction at
pericentromeric regions promotes spatial restriction of the genome.
Our results reveal two new aspects of chromatin organization: 50-100kb globules and strong heterochromatin-mediated interactions between centromere-proximal regions (Extended Data Fig. 10d). Globules require cohesin and are a basic element of chromosome arm architecture, distinct from cohesin-dependent long-range loop interactions between gene regulatory elements in higher eukaryotes5,21,22. Globules may be integral components of larger domains in other species, and could explain changes within topological domains after cohesin depletion6,7. Globules comprising crumpled chromatin may facilitate functional genome annotation and promote transcriptional fidelity. Heterochromatin imposes an additional constraint, perhaps partly mediated by cohesin at centromeres and telomeres, and compacts large domains at opposing ends of the nucleus that may help reinforce Rabl organization. Heterochromatin-mediated condensation and globule assembly probably fulfill complementary roles to constrain chromosomal arms and promote territoriality. These results uncover distinct aspects of genome architecture, and lay the groundwork for future investigation of its impact on various chromosomal processes.
Author Manuscript
Author Manuscript
Author Manuscript
METHODS
Hi-C
For Hi-C experiments, wild type and clr4Δ strains were cultured in rich medium at 33°C. The cdc10-v50, rad21-K1 and cdc10-v50 rad21-K1 mutant cells were initially cultured at 26°C and then shifted to 35°C for 4 hours (cdc10-v50 and cdc10-v50 rad21-K1) or to 33°C for only 2 hours (rad21-K1) to ensure that the cell cycle distribution of mutant cultures was similar to wild type. A detailed Hi-C protocol was described previously29. In brief, cells (A600nm, ~0.5) were fixed in 3% formaldehyde (Sigma) for 20 min at 26°C, and quenched
with glycine for 5 min at 26°C. Cells were poured into liquid nitrogen using 1× NEBuffer2, disrupted by nitrogen grinding. Cell lysate was treated with 0.1% SDS for 10 min at 65°C, and then quenched with 1% TritonX-100. Cell lysate was digested overnight with HindIII at 37°C. The 5’ overhang from HindIII digestion was filled in using the Klenow fragment in the presence of biotin-14-dCTP, dATP, dGTP and dTTP at 37°C for 45 min. The reaction was terminated with 1.5% SDS. The DNA fragments were ligated by T4 DNA ligase in diluted conditions that favor the ligation between cross-linked DNA fragments at 16°C for 8 hrs (Hi-C DNA). The Hi-C DNA was reverse cross-linked at 65°C overnight in the presence of proteinase K and purified by phenol/chloroform extraction. Purified Hi-C DNA was treated with 1 mg/ml RNase A for 30 min at 37°C. DNA fragments were removed by T4 DNA polymerase and reactions were purified by Biotinylated but not ligated phenol/ chloroform extraction. Hi-C DNA was then sheared using the Covaris S2 instrument (Covaris) in the size range of <500bp. The sheared Hi-C DNA was subjected to end-repair and 3’ end adenylation. Hi-C DNA between 150-300bp was selected with AMPure XP (BeckmanCoulter) as described29. The biotin-labeled Hi-C DNA was selectively captured by Dynabeads Myone Streptavidin C1 (Invitrogen) and used for Illumina PE adapter ligation. Streptavidin beads containing bound Hi-C DNA were used for the template for library amplification by PE-PCR primers (Illumina). Hi-C libraries were sequenced using the Illumina HiSeq platform. Analysis of biological replicates for wild type and mutants in our laboratory give similar contact probability results. The correlation values between two wild type samples yielded Pearson's coefficient r=0.981, p-value <2e-16.
Hi-C data analyses overview
Hi-C data were mapped, and reads were filtered as described previously30. Corrected contact probability matrices at 10kb resolution were obtained using iterative correction 30. Both steps were performed using the hiclib library for python, publicly available at https:// bitbucket.org/mirnylab/hiclib.
Mapping and fragment-level filtering
Paired-end sequencing reads were mapped independently using Bowtie 2.1.0 to the S. pombe reference genome (ASM294v2) for each Hi-C library. Mapping with iteratively increasing truncation length was used to maximize yield of valid Hi-C interactions, using the flags ‘--score-min L,-0.6,-0.2’, as described previously30. Only read pairs where both reads uniquely aligned to the genome were considered for subsequent steps. Read pairs corresponding to repeat instances of the same DNA molecule were removed. Next, on the basis of their HindIII restriction fragment assignments and orientations, read pairs were classified as valid
Author Manuscript
Author Manuscript
Author Manuscript
Hi-C products, non-ligation, or self-ligation products30. The following fragment-level filters were then applied, as described30, which remove read pairs: with one end adjacent to the restriction site (possible un-ligated molecules), from restriction fragments with very high or low counts, from very large or small restriction fragments, and separated by very few restriction fragments (as these may be strongly influenced by inefficiencies in restriction). Filters used hiclib default values, except for the last filter, which used a more stringent 4 instead of 2 fragments. For downstream analyses, only valid Hi-C read-pairs were considered. Furthermore, read pairs from biological replicates were pooled after applying fragment-level filters. The number of valid read pairs used were as follows: 61,873,904 for wild type; 12,521,720 for rad21-K1; 16,821,386 cdc10-v50 (G1 arrested cells); and 18,549,406 for clr4Δ.
Corrected Hi-C contact maps
To create contact maps, the S. pombe genome was divided into non-overlapping 10kb bins. We then assigned valid Hi-C products to the bins based on the midpoint of the associated restriction fragment, as previously8,30. As previously described30, we used bin-level filters to focus our analyses on regions of the genome that could be most reliably assessed with Hi-C, removing: the lowest 1% of bins by coverage (in addition to bins with zero counts), the diagonal and neighboring diagonal (that is, bin pairs separated by <20kb), stand-alone bins (that is, bins in which neighboring bins did not pass filters). We then removed potential biases in raw Hi-C contact maps, which may include the uneven distribution of restriction enzyme sites, differences in GC content, and differing mappability of different bins. This was achieved by normalizing coverage using an iterative procedure30. Regions of the heatmap in which a single bin had been filtered out were then interpolated using neighboring bins: within a chromosome, position (i,j) was interpolated with the average value at
positions (i+1,j+1) and (i-1,j-1) to preserve the decrease of contact probability Pc(s) with distance s; at the edges of chromosomes, if the offset in i or j changed chromosomal assignment, the average of (i+1,j) and (i-1,j) or (i,j+1) and (i,j-1) was used instead; the latter was also used between chromosomes, except at the intersection of two interpolated bins, where the average of (i+1,j+1), (i-1,j-1), (i+1,j-1) and (i-1,j+1) was used. The resulting matrices were then normalized so that each row and column sum to 1. All reported Hi-C results use these normalized corrected matrices.
4C-like profiles
To obtain 4C-like inter-chromosomal interaction profiles for centromeres and telomeres (for example, Fig. 1b) indices of telomeric and centromeric bins were extended to include the nearest 5 non-filtered out bins on their respective chromosomes. The profiles for each of these sets of regions were then averaged together over all non-filtered and non-chromosomal and smoothed with a sliding window of 5 bins. For the mat locus, intra-chromosomal interactions were plotted as well, making it an exact analog of a 4C profile obtained from corrected Hi-C data.
Author Manuscript
Author Manuscript
Author Manuscript
Pc(s) calculation
Polymers characteristically display a decrease in contact probability, Pc(s), as a function of genomic distance, s. The rate of decay, or scaling, of Pc(s) is often interpreted as
informative of an underlying polymer state. In particular, Pc(s) ~ s−1 has been interpreted as indicative of a non-equilibrated crumpled, or fractal, globule state, which stands in contrast with Pc(s) ~ s−3/2 for a polymer melt31. Here, we observe that mutants often display markedly different Pc(s) values than S. pombe, which decreases at a rate in-between s−1 and
s−3/2 after 100kb. Intra-arm Pc(s) (e.g. Fig. 1e) was calculated from binned corrected contact maps as described previously30, in which intra-arm regions were defined as all pairs of bins on the same arm of the same chromosome. Centromere coordinates from the reference S.
pombe genome (ASM294v2) were used to define chromosomal arms. First, we consider 40
logarithmically spaced bins from 20kb to the maximum arm length; bin positions were rounded down to the nearest integer and repeated bins locations were discarded. For each logarithmic bin, we then calculate the mean value of Hi-C contact map in this range of genomic distances, excluding regions of the contact map that were filtered out. To determine intra-arm Pc(s) as function of the distance of a region to the centromere (Fig. 4h), we assigned regions to 20 logarithmically spaced bins as a function of distance to the
centromere. The intra-arm analysis was then performed separately for each of these sets of regions. Inter-chromosomal Pc(s) as a function of combined distance to the centromere was calculated similarly to intra-arm Pc(s), with two important differences. First, instead of s representing genomic separation between two loci, s = d1 + d2, in which d1 and d2 are the respective distances to the centromere of the first and second arm for each
inter-chromosomal arm pair. Second, this Pc(s) calculation was restricted to loci at similar distances from the centromere, | d1 – d2 | < 50kb.
Histograms of contact probability
Histograms of contact probability for different classes of regions (for example, Fig. 1c) were calculated from corrected contact maps, excluding filtered-out bin pairs. Inter-chromosomal regions were defined as all pairs of bins on different chromosomes. Inter-arm regions were defined as all pairs of bins on different arms of the same chromosome. As for calculating
Pc(s), intra-arm regions were defined as all pairs of bins on the same arm of the same
chromosome.
Hi-C directional preferences and globule boundaries
Hi-C directional preference scores were calculated from corrected contact maps as the log2 ratio of upstream to downstream contact probabilities for each region at distances below
100kb: , in which C is the corrected contact map. Globule boundaries occur where the directional preferences strongly change from regions of upstream preferences to regions of downstream preferences. Boundary strength was
calculated as the sum of upstream preferences in the region before, minus the sum of downstream preferences in the region after, a boundary. For comparisons of boundary position between data sets, and comparisons with positions of peaks of local cohesin enrichment, the 100 strongest boundaries in each data set were used.
Author Manuscript
Author Manuscript
Author Manuscript
Gene convergence profile
We constructed a gene convergence profile L10kb(i) at 10kb resolution in three steps: 1) the gene orientation profile G1kb(i) was calculated at 1kb resolution, in which G1kb(i) = 1, -1 or
0 for downstream, upstream, or no orientation respectively, and genes were assigned to bins by their midpoint. The value in each 1kb bin was set to 1 if the number of downstream genes exceeded the number of upstream, -1 if the number of upstream genes exceeded the number of downstream and 0 otherwise. 2) The gene orientation profile G1kb(i) was then used to calculate the convergence profile L1kb(i) at the same 1kb resolution. For each position i the convergence is calculated as the weighted sum of positive gene orientation bins 50Kb upstream and negative bins 50Kb downstream: , in which . The triangular shape of kernel W(j) that changes sign at zero allows smooth weighting of the directionality of genes as a function of distance. The convergence profile L1kb has positive values for regions of convergent gene orientation, that is, more upstream genes point upstream and more downstream gene point downstream. Conversely, negative values of L1kb indicate regions of divergent gene orientation. 3) The 10kb profile L10kb(i) is calculated by averaging the 1kb scores in each non-overlapping 10kb bin. This allows comparison with Hi-C contact maps binned at 10kb (Fig. 1f). Finally, peaks of convergent gene orientation at 10kb were defined as bins in the top 75th percentile of
L10kb separated by at least three bins, as for peaks of local cohesin enrichment, and represent when gene orientation shifts from mostly downstream to mostly upstream at the 100kb scale.
Binned cohesin analysis and peak detection
To compare Hi-C contact maps binned at 10kb with cohesin (Psc3) binding, we constructed a cohesin profile and obtained regions of local cohesin enrichment at this scale for the wild type and for each mutant. First, log ratio ChIP-Chip values were averaged over 10kb non-overlapping bins to obtain the 10kb profile. Next, peaks of local cohesin enrichment were determined as local maxima in the 10kb binned profile. Peaks were additionally required to have a minimum spacing of 3 bins and to be in the top 75th percentile.
Relative contact probability/insulation calculation
The degree to which a locus can decrease contact frequency between, or insulate, regions separated by that locus can be directly quantified from corrected Hi-C contact maps. To quantify the relative frequency of contacts occurring over a bin j at a distance s, we
calculate: , in which .
Rj(s) provides a natural way to determine whether certain regions are associated with insulation in a Hi-C contact map; negative values of Rj(s) indicate fewer contacts occurring over given bin, i.e. insulation, at a given distance s.
Insulation vs. peaks
To plot the local relative contact probability around all convergent gene peaks (Fig. 1g) or Psc3 peaks (Extended Data Fig. 4c), Rj(s) was averaged over s = 20-50kb, and
Author Manuscript
Author Manuscript
Author Manuscript
was plotted for +/− 5 bins (50kb) from each peak location j. To plot the average local relative contact probability profile surrounding Psc3 peaks as a function of genomic distance, was averaged over all peak locations, j, and Rs was plotted for +/− 5 bins (50kb) offset (e.g. Fig. 2e).
Cohesin peaks and distance to the nearest boundary
To calculate the mean number of cohesin/Psc3 peaks as a function of distance to the nearest boundary at 10kb (Extended Data Fig. 4d), we used wild type Psc3 peaks as determined above from the 10kb binned profile, and the top 100 strongest boundaries for each dataset. Error bars showing 5th and 95th percentiles were obtained by comparison with Psc3 peaks determined from 1000 permuted Psc3 profiles. The spearman correlation between cohesin and relative contact frequency at 10kb as a function of distance was calculated genome-wide as the correlation between R(s) and the binned Psc3 profile at each distance s (Extended Data Fig 4e, 7b). Negative values of this correlation indicate that with increased cohesin binding, relatively fewer contacts are made over a locus at a given distance.
Box plots of inter-chromosomal contact probability
Box plots of inter-chromosomal interactions for telomere-telomere interactions show the 10 most telomere-proximal bin-pairs for non-filtered regions of the heatmap. For centromere-centromere interactions the values for the 40 most centromere-centromere-proximal bin-pairs for non-filtered regions of the heatmap are used, as centromere-centromere interactions occur where four distinct arm pairs meet. As contact probabilities span a large range, log10 (contact probability) is shown (Extended Data Fig. 9).
Average cohesin profile at convergent genes
For each sample the Log ratio data was averaged over a 50 bp sliding window. All pairs of convergent genes were aligned at the 3’ end of the second gene in the pair and the mean (geometric mean) of all genes for positions ± 5,000 bases from the align-point was plotted. Gene boundaries (start and end positions) were as previously reported32. To calculate z-score profile for cohesin binding at convergent genes, initial cohesin binding data was mapped to genomic coordinates and represented as per-probe log-ratios. For comparison between different experiments the log-ratio value of each probe was converted to a z-score. Using the coordinates of the convergent genes we took a window of ±5kb around one 3’ end of the convergent gene-pair. This window was then divided into 300 bp bins. Thus for each 10 kb window we have 30 bins, and each window is now centered around the 3’ end of the right-hand gene of each convergent gene pair. For each base lying within the 300bp bin the z-scores are averaged and assigned to the midpoint of the 300bp bin. Finally the score of each bin was summed for 1463 genes across the 10 kb windows and plotted as the mean score per gene (Fig. 3c).
Immunofluorescence and FISH
Immunofluorescence (IF)/fluorescent in situ hybridization (FISH) was carried out as previously described33. Rabbit anti-GFP (ab290, Abcam) and anti-TAT1 antibodies (a gift from Keith Gull) were used for detecting the Psc3-GFP and tubulin, respectively. Rabbit
Author Manuscript
Author Manuscript
Author Manuscript
anti-GFP (ab290, Abcam) was used to detect Taz1-GFP. Cells were subsequently incubated with Alexa Fluor 488 anti-rabbit IgG (Molecular Probes, Invitrogen). The FISH probe was designed by HindIII digestion of plasmids containing various mat1, mat2 and mat3 loci. The purified products were DIG-labeled using Nick Translation kit (Roche Applied Science). Cells were hybridized overnight with DIG-labeled probe and signals were detected using Fab fragments from polyclonal anti-digoxigenin antibodies conjugated to rhodamine (Roche Applied Science). Samples were analyzed using a Delta Vision Elite fluorescence
microscope with oil immersion objective lens of 100x magnification, NA 1.4. Images were acquired at 0.2 μm intervals along the z-axis and were subjected to volume deconvolution using SoftWoRx software.
SPB or Cnp3–lacO distances live-imaging
Distances between the spindle pole body (Sad1-mCherry) or kinetochore protein CENP-C (Cnp3-Tomato) (a gift from Y. Watanabe) and a lacO array at the lys1 locus (~24 kb from central core 1)34 were measured on G2 cells – displaying a single lacI-GFP dot– as follows. Cells were grown overnight until logarithmic phase in minimal medium EMM plus
supplements at 30°C and then mounted in 2% agarose pad. Cells were imaged on a Delta Vision Elite microscope (GE Healthcare) with a 100x 1.4NA Plan Super Apochromat oil lens (Olympus). Thirty 0.2-μm z-sections were acquired and subsequently deconvolved using SoftWoRX 6.0 (GE Healthcare). Further image processing, including maximum intensity projections and measuring distances between mCherry/Tomato and GFP (center-to-center) was performed using ImageJ (National Institutes of Health).
Culture conditions for detecting genomic rearrangements
To detect rearrangements in rad21-K1, wild type and mutant cells were cultured in YEA at 26°C before shifting to 33°C. DNA prepared from cells grown overnight was used to perform comparative genomic hybridization (CGH) analyses as described below.
Comparative genomic hybridization
CGH analysis was performed using our custom Agilent microarray (4×44K format)12. Genomic DNA from wild type or mutants was digested with AluI and RsaI. After complete digestion, mutant DNA was labeled with Cy-5 dCTP (Amersham Biosciences) and wild type DNA was labeled with Cy-3 dCTP (Amersham Biosciences) using the BioPrime® Array CGH Genomic Labeling kit (Invitrogen). Equal amounts of labeled DNA (1.5 ug) were competitively hybridized onto the microarray. Prehybridization, probe hybridization, washing, and drying steps for arrays were performed as for ChIP-chip experiments12. Arrays were scanned using an Agilent scanner (Agilent) and analyzed using Agilent Feature Extraction (Agilent). Signal intensity ratios between Cy5 (mutant) and Cy3 (Wild type) were calculated from rProcessedSignal and gProcessedSignal values according to Agilent Feature Extraction. The log2 transformed Cy5/Cy3 ratio is plotted along the chromosome.
Author Manuscript
Author Manuscript
Author Manuscript
ChIP and expression profiling
Chromatin immunoprecipitation (ChIP) was performed as previously described using anti-GFP (ab290 Abcam)12. Expression profiling was carried out according to a protocol described previously35.
Extended Data
Extended Data Figure 1. S. pombe chromosomes are partitioned into complex domains
log2(observed/expected) contact probability maps for wild type S. pombe chromosomes. The color code indicates more (brown) or less (blue) interaction than expected depending on genomic distance (ranging from -2 to +2). These maps show an increasing extent of
centromeric avoidance for regions along the arms of chromosomes (Black outlines). Boxes indicate strong cross-like patterns of centromere proximal arm-arm interactions. The left arm of chromosome 1 is segregated into compartments (green arrow). The mating type locus on chromosome 2 (black arrow) separates two adjacent domains. Subtelomere 2R is
partitioned into strongly interacting domains (red arrow).
Author Manuscript
Author Manuscript
Author Manuscript
Extended Data Figure 2. Contact probability as a function of genomic distance for different chromosomal arms
The decay of intra-arm contact probability as a function of genomic distance, plotted for each chromosome arm. All chromosome arms behave similarly in terms of their scaling.
Pc(s) decreases more slowly at short distances (grey shaded area). The black and grey
dashed lines represent the slope for fractal globules (-1) and polymers in a melt (-3/2), respectively.
Extended Data Figure 3. Contact probability as a function of genomic distance in wild type and
rad21-K1
Author Manuscript
Author Manuscript
Author Manuscript
Global decay of intra-arm contact probability as a function of genomic distance plotted for
rad21-K1 (blue) and wild type (grey line). Average inter-chromosomal interactions (flat
lines) are markedly increased (~twofold) in rad21-K1 compared to wild type. Short-range contact probability decays rapidly in rad21-K1, and no longer decreases more rapidly after 100kb, probably reflecting the loss of globules in rad21-K1. The black and grey dashed lines represent the slope for fractal globules (-1) and polymers in a melt (-3/2), respectively.
Extended Data Figure 4. Insulation at globule boundaries
The degree to which a locus displays decreased contact frequency between, or is insulated from, regions separated by that locus can be directly quantified from the corrected Hi-C contact map. Here we use Rj(s), the relative frequency of contacts occurring over a bin j at a
Author Manuscript
Author Manuscript
Author Manuscript
distance s. Negative values of relative contact frequency, Rj(s), are indicative of insulation at a given locus. Rj(s) at a given distance s is calculated from a region within a rectangular band of a Hi-C contact map rotated by 45 degrees. a, Diagram illustrating the concept of the insulation plot. At the location of the cohesin binding peak, interactions between two adjacent globules are less frequent (blue stripe). Within the globule domain, contact probability is high (red stripe). b, Relative contact probability around a cohesin peak as a function of insulation distance averaged over all cohesin peaks. Average insulation is examined by calculating the relative contact probability around cohesin peaks. Relative contact probability around the cohesin peak is depleted up to ~50-100kb, indicative of insulation at peaks of local cohesin enrichment at these scales. c, Relative contact probability averaged from 20-50kb around positions of each cohesin peak (positions obtained in wild type were assayed in rad21-K1). d, Mean number of cohesin peaks as a function of distance from boundaries. Psc3 peaks are highly enriched at the boundary in wild type. e, The negative correlation between cohesin and relative contact frequency Rj(s) in wild type indicates that not only is insulation observed at peaks of cohesin enrichment, but that the inverse relationship between the local enrichment of cohesin (Psc3) and the relative contact frequency holds genome-wide for data binned to 10kb. This indicates that it is not just the presence or absence of a cohesin peak, but the local amount of cohesin protein in the chromatin fiber that may be important for boundary formation, as well as the strength of a given boundary. The negative correlation holds up to ~100kb in wild type. In rad21-K1, however, there is no appreciable correlation with Psc3 at any distance. This indicates that there is no clear relationship between the distribution of cohesin and local chromatin organization in this mutant.
Author Manuscript
Author Manuscript
Author Manuscript
Extended Data Figure 5. Genomic rearrangements and transcriptional dysregulation in
rad21-K1
a, Microarray CGH profile of rad21-K1. Genomic DNA isolated from rad21-K1 and wild
type was labeled with cy5-dCTP and cy3-dCTP, respectively. The log2(cy5/cy3 signal ratio) was plotted to detect copy number differences between the two strains. Several copy number gains were identified in rad21-K1. All changes were flanked by highly homologous
sequences. SPAC212.08c and SPAC212.12 share a 372bp DNA stretch that shows 97% sequence similarity. SPAC27D7.09c and SPAC27D7.11c share a 560bp DNA stretch that shows 88% sequence similarity. Pericentromeric heterochromatin contains a specific class of repeat elements, referred to as dg/dh repeats. b, Relative expression values (mutants/wild type) were plotted to detect read-through transcripts in the indicated strains. All pairs of convergent genes were aligned at the 3’ end of the second gene in the pair. Note that
rad21-K1 cells show increased levels of read-through transcripts that were further enhanced in a pht1Δ rad21-K1 double mutant lacking the histone variant H2A.Z known to prevent their
accumulation35.
Author Manuscript
Author Manuscript
Author Manuscript
Extended Data Figure 6. Hi-C analysis of G1 arrested cells
a, Cohesin (Psc3) localization was examined by immunofluorescence in asynchronous wild
type cells. Cell cycle stage was determined by tubulin staining (TAT1). Psc3 was detected in the nucleus in both G2 and G1/S phase cells (top). Psc3-GFP localization was examined in G1 arrested cells (cdc10-v50). Predominant nuclear staining and Psc3-GFP dots were detected in both asynchronous cells and G1 arrested cells (bottom). Scale bar, 5μm. b, All-by-all interaction heatmap for G1 cells. The inter-chromosomal cross-like pattern is more prominent in G1 cells than in asynchronous cells. c, 4C-like inter-chromosomal profiles for centromeres and telomeres. d, Global decay of intra-arm contact probability as a function of genomic distance in G1 cells (green) compared with wild type (grey); flat lines indicate average inter-chromosomal contact probability. Slower decay of contact probability over short distances, followed by a more rapid decrease after 100kb, was observed in G1 arrested cells. The black and grey dashed lines represent the slope for fractal globules (-1) and polymers in a melt (-3/2), respectively. e, FACS analysis of cell populations used for Hi-C (left). Global decay of intra-arm contact probability as a function of genomic distance in G1-arrested rad21-K1 (orange) compared to G1 cells (green) is shown at right. f, Hi-C heatmaps of a segment of chromosome 2 for indicated samples overlaid with lines corresponding to cohesin peaks from the 10kb binned cohesin (Psc3) profile. The Hi-C directional preference profile is shown below. Note the globules are not visible in G1 arrested rad21-K1
(cdc10-v50 rad21-K1). g, Insulation plot around cohesin peak sites (detected in G1-arrested cells)
for G1 and G1-arrested rad21-K1.
Author Manuscript
Author Manuscript
Author Manuscript
Extended Data Figure 7. Globule boundaries in wild type, rad21-K1, G1 arrested and clr4Δ a, Insulation effect for all cohesin (Psc3) peaks. Relative contact probability was averaged
over 20-50kb at each Psc3 peak region (-50kb to +50kb region) and sorted by Psc3 peak height. Insulation effect at Psc3 peaks in wild type, G1, and clr4Δ holds genome-wide, and not only at a small subset of peaks. b, The correlation between Psc3 and relative contact probability Rj(s) profile at a given distance s. The negative correlations hold up to 100kb in wild type, G1 arrested cells and clr4Δ. Psc3 enrichment and the relative contact probability profile in rad21-K1 do not show an appreciable correlation at any distance. c, The fraction of overlapping boundaries (+/−1 bin) for each Hi-C dataset is shown. Boundaries in clr4Δ and G1 arrested cells show high overlap with wild type boundaries. The top 100 strongest boundaries from each dataset were examined for comparison.
Author Manuscript
Author Manuscript
Author Manuscript
Extended Data Figure 8. Cohesin localization in wild type and clr4Δ strains as determined by ChIP-chip
a, Cohesin subunit Psc3 tagged with GFP (Psc3-GFP) is distributed broadly throughout the
genome. Note that Psc3 localization in clr4Δ was specifically affected in heterochromatic regions, but not in chromosome arm regions. b, Psc3-GFP localization across
pericentromere, subtelomere and mating type heterochromatic regions. Heterochromatic regions are highlighted. c, Psc3-GFP localization on chromosome arm regions (left). Green bars represent open reading frames according to the 2007 S. pombe genome assembly. Cohesin enrichment sites are highlighted. Genome-wide profile of Psc3-GFP ChIP
enrichment at convergent genes in wild type and clr4Δ (right). All pairs of convergent genes were aligned at the 3’ end of the second gene (green box).
Extended Data Figure 9. Box plots showing contact probabilities for centromere-centromere/ telomere-telomere inter-chromosomal interactions in wild type, clr4Δ and rad21-K1
Box plots, overlaid with values for individual bin-pairs, showing contact probabilities for centromere-centromere/telomere-telomere inter-chromosomal interactions in wild type,
clr4Δ and rad21-K1. Whiskers span from minimum to maximum of each set of points,
Author Manuscript
Author Manuscript
Author Manuscript
boxes show 25th, median, and 75th percentiles. Centromere–centromere/telomere–telomere inter-chromosomal interactions are less frequent in clr4Δ as compared to wild type.
Extended Data Figure 10. Effects of heterochromatin and cohesin on centromere proximal arm interactions, and a model showing their distinct effects on S. pombe genome organization a, Centromere proximal regions considered for intra-chromosomal and inter-chromosomal
arm interaction Pc(s) are shown on a heatmap (left). Diagram showing intra- and inter-arm interactions within a chromosome, and inter-arm interactions between chromosomes in centromere proximal regions (right). Standard genomic distances were used to consider intra-arm contact probabilities. To consider inter-arm contacts within or between chromosomes, genomic distance was defined as the combined distance of two loci to the centromere, for regions at similar (<50kb) distance from their respective centromeres. b,
Pc(s) plotted for inter-arm interactions within a chromosome and between different
chromosomes in wild type cells. Inter-chromosomal inter-arm (red) Pc(s) falls below
intra-Author Manuscript
Author Manuscript
Author Manuscript
chromosomal inter-arm (blue) and intra-arm (black), but have a similar rate of decay with distance. Note that inter-arm Pc(s) starts at a larger genomic distance, since centromere proximal bins were removed at the stage of bin-level filtering due to their low coverage. c, Pairwise comparisons of inter-arm Pc(s) of rad21-K1 and clr4Δ with wild type. In clr4Δ, both inter-arm Pc(s) are shifted lower, most notably for inter-chromosomal inter-arm contact probability. In rad21-K1, inter-arm scaling near centromere is similar to wild type. d, Model showing distinct roles of heterochromatin and cohesin-dependent globules in overall chromosome organization. In wild type cells, non-random organization consistent with a degree of chromosome territoriality was evident. These levels of organization may underlie genomic integrity, both independently and collectively, for example, by effectively
preventing interaction between repetitive elements. The peripheral positioning of centromere and telomere clusters promotes a Rabl configuration. Heterochromatin reinforces this configuration by compacting centromere and telomere proximal regions, promoting strong interactions and aligning arms to facilitate proper genome architecture. A newly identified layer of “globules” bounded by high amounts of arm cohesin organizes chromosome arms. The formation of globules depends on arm cohesin. Unlike in wild type, globules on arms are disrupted in rad21-K1, whereas constraints at pericentromeric regions are maintained. In
clr4Δ, pericentromeric regions are decompacted, but globules are not disrupted along arms.
Acknowledgements
We thank Y. Watanabe and M. Yanagida for strains, M. Zofall for helpful contributions, and A. Kelly for comments. This study used the Helix Systems and the Biowulf Linux cluster at the National Institutes of Health. This work was supported by the Intramural Research Program of the National Institutes of Health, National Cancer Institute and by a grant from NHGRI (HG003143) to J.D. The work of G.F. and L.M is supported by NCI Physical Sciences-Oncology Center at MIT (U54CA143874).
References
1. Dixon JR, et al. Topological domains in mammalian genomes identified by analysis of chromatin interactions. Nature. 2012; 485:376–380. [PubMed: 22495300]
2. Nora EP, et al. Spatial partitioning of the regulatory landscape of the X-inactivation centre. Nature. 2012; 485:381–385. [PubMed: 22495304]
3. Sexton T, et al. Three-dimensional folding and functional organization principles of the Drosophila genome. Cell. 2012; 148:458–472. [PubMed: 22265598]
4. Hou C, Li L, Qin ZS, Corces VG. Gene density, transcription, and insulators contribute to the partition of the Drosophila genome into physical domains. Mol. Cell. 2012; 48:471–484. [PubMed: 23041285]
5. Phillips-Cremins JE, et al. Architectural protein subclasses shape 3D organization of genomes during lineage commitment. Cell. 2013; 153:1281–1295. [PubMed: 23706625]
6. Sofueva S, et al. Cohesin-mediated interactions organize chromosomal domain architecture. EMBO J. 2013; 32:3119–3129. [PubMed: 24185899]
7. Zuin J, et al. Cohesin and CTCF differentially affect chromatin architecture and gene expression in human cells. Proc. Natl. Acad. Sci. USA. 2014; 111:996–1001. [PubMed: 24335803]
8. Lieberman-Aiden E, et al. Comprehensive mapping of long-range interactions reveals folding principles of the human genome. Science. 2009; 326:289–293. [PubMed: 19815776]
9. Grewal SI, Jia S. Heterochromatin revisited. Nat. Rev. Genet. 2007; 8:35–46. [PubMed: 17173056] 10. Bernard P, et al. Requirement of heterochromatin for cohesion at centromeres. Science. 2001;
294:2539–2542. [PubMed: 11598266]
Author Manuscript
Author Manuscript
Author Manuscript
11. Nonaka N, et al. Recruitment of cohesin to heterochromatic regions by Swi6/HP1 in fission yeast. Nat. Cell Biol. 2002; 4:89–93. [PubMed: 11780129]
12. Cam HP, et al. Comprehensive analysis of heterochromatin- and RNAi-mediated epigenetic control of the fission yeast genome. Nat. Genet. 2005; 37:809–819. [PubMed: 15976807] 13. Funabiki H, Hagan I, Uzawa S, Yanagida M. Cell cycle-dependent specific positioning and
clustering of centromeres and telomeres in fission yeast. J. Cell Biol. 1993; 121:961–976. [PubMed: 8388878]
14. Tanizawa H, et al. Mapping of long-range associations throughout the fission yeast genome reveals global genome organization linked to transcriptional regulation. Nucl. Acid. Res. 2010; 38:8164– 8177.
15. Duan Z, et al. A three-dimensional model of the yeast genome. Nature. 2010; 465:363–367. [PubMed: 20436457]
16. Molnar M, Kleckner N. Examination of interchromosomal interactions in vegetatively growing diploid Schizosaccharomyces pombe cells by Cre/loxP site-specific recombination. Genetics. 2008; 178:99–112. [PubMed: 18202361]
17. Alfredsson-Timmins J, Henningson F, Bjerling P. The Clr4 methyltransferase determines the subnuclear localization of the mating-type region in fission yeast. J. Cell Sci. 2007; 120:1935– 1943. [PubMed: 17504808]
18. Tjong H, Gong K, Chen L, Alber F. Physical tethering and volume exclusion determine higher-order genome organization in budding yeast. Genome. Res. 2012; 22:1295–1305. [PubMed: 22619363]
19. Gard S, et al. Cohesinopathy mutations disrupt the subnuclear organization of chromatin. J. Cell Biol. 2009; 187:455–462. [PubMed: 19948494]
20. Guacci V, Koshland D, Strunnikov A. A direct link between sister chromatid cohesion and chromosome condensation revealed through the analysis of MCD1 in S. cerevisiae. Cell. 1997; 91:47–57. [PubMed: 9335334]
21. Dorsett D, Merkenschlager M. Cohesin at active genes: a unifying theme for cohesin and gene expression from model organisms to humans. Curr. Opin. Cell Biol. 2013; 25:327–333. [PubMed: 23465542]
22. Seitan V, et al. Cohesin-based chromatin interactions enable regulated gene expression within pre-existing architectural compartments. Genome Res. 2013; 23:2066–2077. [PubMed: 24002784] 23. Schmidt CK, Brookes N, Uhlmann F. Conserved features of cohesin binding along fission yeast
chromosomes. Genome Biol. 2009; 10:R52. [PubMed: 19454013]
24. Tomonaga T, et al. Characterization of fission yeast cohesin: essential anaphase proteolysis of Rad21 phosphorylated in the S phase. Genes Dev. 2000; 14:2757–2770. [PubMed: 11069892] 25. Gullerova M, Proudfoot NJ. Cohesin complex promotes transcriptional termination between
convergent genes in S. pombe. Cell. 2008; 132:983–995. [PubMed: 18358811]
26. Bernard P, et al. Cell-cycle regulation of cohesin stability along fission yeast chromosomes. EMBO J. 2008; 27:111–121. [PubMed: 18079700]
27. Haering CH, Farcas AM, Arumugam P, Metson J, Nasmyth K. The cohesin ring concatenates sister DNA molecules. Nature. 2008; 454:297–301. [PubMed: 18596691]
28. Renauld H, Gasser SM. Heterochromatin: a meiotic matchmaker? Trend. Cell Biol. 1997; 7:201– 205.
29. Belton JM, et al. Hi-C: a comprehensive technique to capture the conformation of genomes. Methods. 2012; 58:268–276. [PubMed: 22652625]
30. Imakaev M, et al. Iterative correction of Hi-C data reveals hallmarks of chromosome organization. Nat. Methods. 2012; 9:999–1003. [PubMed: 22941365]
31. Fudenberg G, Mirny LA. Higher-order chromatin structure: bridging physics and biology. Curr. Opin. Genet. Dev. 2012; 22:115–124. [PubMed: 22360992]
32. Lantermann AB, et al. Schizosaccharomyces pombe genome-wide nucleosome mapping reveals positioning mechanisms distinct from those of Saccharomyces cerevisiae. Nat. Struct. Mol. Biol. 2010; 17:251–257. [PubMed: 20118936]
Author Manuscript
Author Manuscript
Author Manuscript
33. Cam HP, Noma K, Ebina H, Levin HL, Grewal SI. Host genome surveillance for retrotransposons by transposon-derived proteins. Nature. 2008; 451:431–436. [PubMed: 18094683]
34. Nabeshima K, et al. Dynamics of centromeres during metaphase-anaphase transition in fission yeast: Dis1 is implicated in force balance in metaphase bipolar spindle. Mol. Biol. Cell. 1998; 9:3211–3225. [PubMed: 9802907]
35. Zofall M, et al. Histone H2A.Z cooperates with RNAi and heterochromatin factors to suppress antisense RNAs. Nature. 2009; 461:419–422. [PubMed: 19693008]
Author Manuscript
Author Manuscript
Author Manuscript
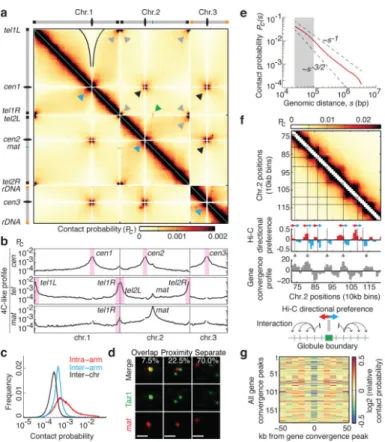
Figure 1. High-resolution contact probability map reveals the higher-order organization of the S.
pombe genome
a, Genome wide Hi-C heatmap at 10kb resolution. Grey and black arrowheads: telomere and
centromere clustering, respectively; blue arrowheads: centromere proximal armarm interactions; green arrow: mat/tel1R interaction. Black outlines indicate centromere
avoidance of chromosome (chr.) arms. Pc, contact probability. b, 4C-like inter-chromosomal interaction profiles showing the average contact probabilities of centromeres and telomeres. Inter- and chromosomal interaction profiles are shown for mat. c, Distribution of intra-arm, inter-intra-arm, and inter-chromosomal contact frequencies. Inter-arm interactions were 1.7-fold higher than inter-chromosomal interactions for regions >200kb from centromeres and telomeres. d, Visualization of telomeric Taz1 and mat by immunofluorescence and FISH (n=400 nuclei). Scale bar, 1 μm. e, Decay of intra-arm contact probability as a function of genomic distance, s (Pc(s)). Pc(s) decreases more slowly at short distances (grey shaded area). Dashed lines represent the slopes for polymers in a melt (-3/2) and fractal globules (-1). f, Hi-C heatmap for a sub-chromosomal region showing globules. The Hi-C directional preference profile is shown, with upstream (red) and downstream (blue) preferences. The gene convergence profile is shown underneath. Grey arrowheads: peaks of convergent gene enrichment. Black lines: globule boundaries. g, Relative contact probability averaged over 20-50kb for all gene convergence peaks. Decreased relative contact probability at peaks indicates that regions on either side of the peak are insulated from each other.
Author Manuscript
Author Manuscript
Author Manuscript
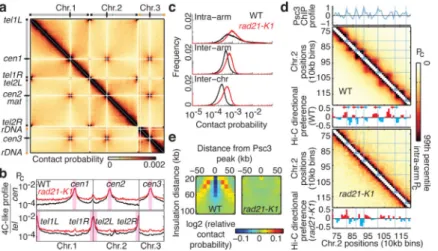
Figure 2. Cohesin is required for globule formation
a, Hi-C heatmap at 10kb resolution for rad21-K1. b, 4C-like profiles showing the average
contact probabilities of centromeres and telomeres WT, wild type. c, Distribution of intra-arm, inter-arm and inter-chromosomal contact frequencies. d, Hi-C heatmaps of a segment of chromosome 2 overlaid with blue lines corresponding to cohesin (Psc3) peaks from the 10kb binned profile (top); Hi-C directional preference profile (below). To compare results from different experiments, color scales were chosen such that the maximum value corresponds to the ninety-ninth percentile of intra-arm contact frequencies. The boundaries detected in rad21-K1 may result from random fluctuations in directionality due to
experimental limitations, or remaining cooperative factors required for boundary establishment. e, Relative contact probability around a cohesin peak as a function of insulation distance averaged over all cohesin peaks (insulation plot). Depletion of contact probability (blue stripe) is not observed in rad21-K1.
Author Manuscript
Author Manuscript
Author Manuscript
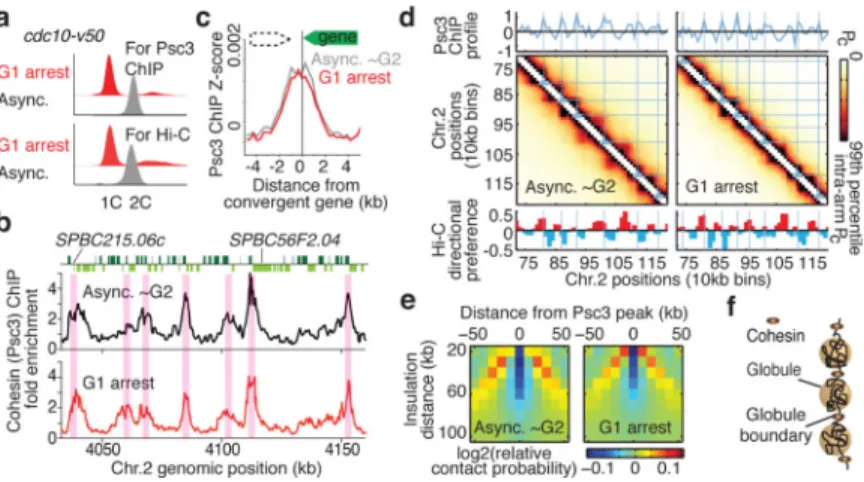
Figure 3. Globules are a feature of chromosome architecture in G1 cells
a, FACS of cells used for cohesin ChIP and Hi-C. b, Cohesin (Psc3) ChIP enrichment at
convergent genes within a region of chromosome 2. c, Psc3 enrichment at convergent genes in wild-type and G1 cells. All pairs of convergent genes were aligned at the 3’ end of the second gene (green box). d, Hi-C heatmaps of a segment of chromosome 2 overlaid with lines corresponding to cohesin peaks from the 10-kb binned profile. Plotted below is the directional preference profile. e, Insulation plot around cohesin peak in G1-arrested cells. f, Hypothetical model showing cohesin bound between locally compacted globule regions. Cohesin confines interactions within individual globule domains and prevents interactions across the boundaries.
Author Manuscript
Author Manuscript
Author Manuscript
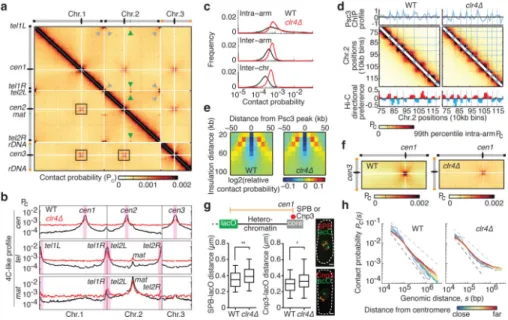
Figure 4. Loss of heterochromatin affects genome organization
a, Hi-C heatmap for clr4Δ. b, 4C-like interaction profiles showing the average contact
probabilities of centromeres and telomeres. Inter- and intra-chromosomal interaction profiles are shown for mat. c, Distribution of indicated contact probabilities. d, Hi-C heatmaps of a segment of chromosome 2 overlaid with lines corresponding to cohesin peaks. Directional preference profiles are plotted below. e, Insulation plot around cohesin peak in clr4Δ. f, The cross-like pattern of interactions between centromere-proximal regions of different
chromosomes. g, Box and whisker plot showing the distribution of spatial distances between
lacO inserted outside a pericentromeric heterochromatin domain and the centromere core
marked by either SPB (left) or Cnp3 (right). *P ≤ 0.05, **P ≤ 0.01 (n=90, two-sided Mann-Whitney U test). Scale bars, 1 μm. h, Intra-arm Pc(s) for regions colored according to their distance from the centromere. In wild type, Pc(s) for regions near the centromere decreases more rapidly than for more distal regions. In clr4Δ, decay of Pc(s) for regions near the centromere is similar to that of more distal regions, indicating that the organization and conformations of pericentromeric chromatin are more similar to the organization of other chromosomal regions.