by
Joseph Spanjaard Elias B.A. Chemistry Reed College, 2009
Submitted to the Department of Chemistry
in Partial Fulfillment of the Requirements for the Degree of DOCTOR OF PHILOSOPHY
IN INORGANIC CHEMISTRY ASHSETTS INSTITUTE
OFTECHNOLOGY at the
JUN 2 32016
Massachusetts Institute of TechnologyLIBRARIES
June 2016 ARCMVM
2016 Massachusetts Institute of Technology. All rights reserved
Signature of Author:
Signature
redacted-Department of Chemistry April 8, 2016
CertifiedSignature
redacted
C>
Yang Shao-HornW.M. Keck Professor of Energy Thesis Supervisor
Accepted by:
Signature redacted
Robert W. Field Haslam and Dewey Professor of Chemistry Chairman, Department Committee on Graduate Theses
Signature redacted
Mircea Dinca Associate Professor of Chemistry Committee Chairman
Signature redacted
Yang Shao-Horn W.M. Keck Professor of Energy Thesis Supervisor
Signature redacted
Timothy M. Swager John D. MacArthur Professor of Chemistry
by
Joseph Spanjaard Elias
Submitted to the Department of Chemistry on April 8, 2016 in Partial Fulfillment of the Requirements for the Degree of Doctor of Philosophy in Inorganic Chemistry Abstract
The low-temperature and cost-effective oxidation of carbon monoxide to carbon dioxide remains a fundamental challenge in heterogeneous catalysis that would enable a diverse range of technologies for electrochemical storage and respiratory health. The development of new catalysts is often driven by high-throughput screening and many of the resulting compounds are mixed-phase, which obscures a rigorous identification of active sites and mechanisms at play for catalysis. In this thesis, the preparation of substituted ceria nanoparticles is described to bring about a fundamental understanding of the structure of the
active sites, mechanism and design descriptors for CO oxidation on ceria-based catalysts. Monodisperse, single-phase nanoparticles of late first-row transition-metal-substituted ceria (MyCei.yO 2-x, M = Mn, Fe, Co, Ni and Cu) are prepared from the controlled pyrolysis of
heterobimetallic precursors in amine surfactant solutions. By means of kinetic analyses, X-ray absorption spectroscopy (XAS) and transmission electron microscopy (TEM), the active site for CO oxidation catalysis is identified as atomically-dispersed, square-planar M3+ and M2+ moieties substituted into the surface of the ceria lattice. The introduction of CuO does not contribute to the catalytic activity of CuyCel.yO2,x, lending support to the hypothesis that
the substituted ceria itself is responsible for the catalytic rate enhancement in mixed-phased catalysts like CuO/CeO2.
Under oxygen-rich conditions, the kinetic parameters for CO oxidation are consistent with lattice oxygen from the dispersed copper sites contributing directly to the oxidation of CO in the rate-determining step. In-situ X-ray photoelectron spectroscopy (XPS) and FTIR studies indicate that adsorbed CO can be directly oxidized to CO2 in the absence of gaseous
02, while in-situ XAS confirms that electron transfer is localized to the copper sites. XAS studies demonstrate that the reversible reducibility of dispersed copper ions is a contributing factor for the special catalytic activity of CuO/CeO2 catalysts.
The oxygen-ion vacancy formation energy is introduced as an activity descriptor to rationalize trends in the catalytic activities measured for MyCei.yO2-xnanoparticles that span
over three orders of magnitude. As such, the DFT-calculated vacancy formation energy serves to guide in the rational design of catalysts through computational, rather than experimental, screening of candidate compounds for CO oxidation catalysis.
Thesis Supervisor: Yang Shao-Horn Title: W.M. Keck Professor of Energy
Title Page Thesis Committee Abstract Dedication Table of Contents List of Figures List of Tables List of Abbreviations
Chapter 1 - Introduction and Motivation
1.1 The Global Relevance of Heterogeneous Catalysis
1.2 Rate Laws and Free Energy Diagrams
1.3 Linear Free-Energy Scaling Relationships
1.4 Mechanisms for CO Oxidation Catalysis
1.4.1 The Langmuir-Hinshelwood Mechanism for CO Oxidation Catalysis 1.4.2 The Mars-van Krevelen Mechanism for CO Oxidation Catalysis
1.5 Low-Temperature CO Oxidation Catalysts 1.5.1 Au/TiO2 and Other Gold-Based Catalysts 1.5.2 Nanoparticulate C0304
1.5.3 Unsupported and Supported CuO Catalysts
1.5.4 Three Open Questions
1.6 Scope of the Thesis 1.7 References
Chapter 2 - The Incorporation of Metal Ions into the Lattice of CeO2
2.1 Introduction
2.2 Synthesis of Mo.1Ceo.902-x (M = Mn, Fe, Co, Ni, Cu)
2.3 Identification of the local structure of transition-metal ions in Mo.1Ceo.902x
2.4 CO oxidation catalysis on CeO2 and Cuo.1Ceo.902-x 2.5 Conclusions
2.6 Experimental Methods 2.7 References
Chapter 3 - Identification of the Active Phase in CuyCe1.y02-x
3.1 Introduction
3.2 CO Oxidation Catalysis on CuO/CuCe-yO2-x catalysts
3.3 Determination of the Surface Segregation and Speciation of Copper in CuyCe.y02,x
3.4 Conclusions
3.5 Experimental Methods
3.6 References
Chapter 4 - The Mechanism for CO Oxidation on CuyCel-y02x
4.1 Introduction:
4.2 Partial Pressure Dependence of CO Oxidation Catalysis 4.3 Evolution of Surface Adsorbates
4.4 Structural Evolution of Cu in CuyCei-yO2-x
4.5 Revisiting the Mechanism for CO Oxidation on CuyCel.,02, 4.6 Conclusions 4.7 Experimental Methods 4.8 References 1 3 5 7 9 11 17 19 23 24 26 29 33 34 36 38 38 41 42 49 51 52 59 60 60 65 74 76 77 95 101 102 102 106 111 112 126 129 130 130 133 140 143 147 147 152
Chapter 5 - A Design Descriptor for CO Oxidation on Substituted Ceria 155
5.1 Introduction 156
5.2 General Trends in CO Oxidation Activity for Mo.iCeo.902-, 156
5.3 Evac as a Descriptor for CO Oxidation on Mo.1Ceo.902.x 160
5.4 Going Beyond Cuo.iCeo.902 x and Evac 162
5.5 Conclusions 165
5.6 Experimental Methods 166
5.7 References 168
Appendix A - Derivation of Rate Expressions 171
A. 1 Mars-van Krevelen 172
A.2 Langmuir-Hinshelwood 174
Biographical Note 179
Curriculum Vitae 181
Figure 1.1 Reaction coordinate diagram for an arbitrary reaction with (gray trace) and without
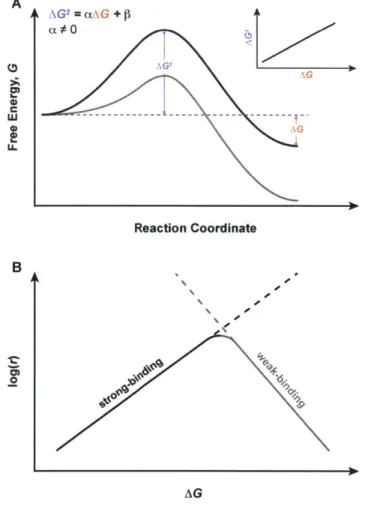
(black trace) the aid of a heterogeneous catalyst surface. 27 Figure 1.2 Linear free-energy scaling relationships and their implications for catalysis. (A)
Reaction coordinate diagram demonstrating the case when there is a linear relationship between AGI and AG and (B) a schematic Sabatier plot using linear free-energy relationships. 30
Figure 1.3 The specific catalytic activity for (A) oxygen reduction and (B) CO oxidation as a
function of the DFT-calculated d-band center for platinum alloys. Measurements for ORR were recorded in 0.1 M HClO4 and those for CO oxidation were acquired in a reactor with
0.02 atm CO and 0.01 atm 02 at a flow rate of 0.67 mL min-1 mg~1 at 200 *C. Adapted with
permission from references 22 and 28. 32
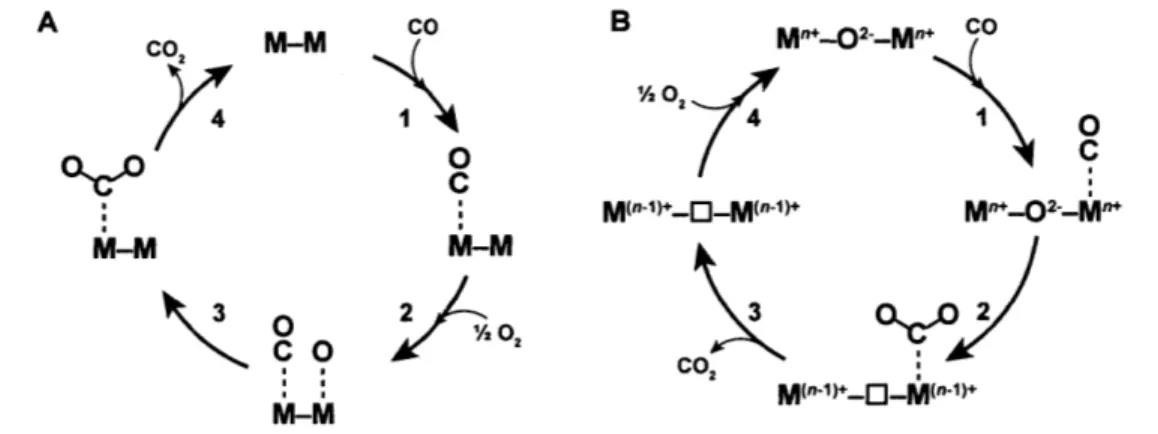
Figure 1.4 Mechanisms for CO oxidation; (A) the Langmuir-Hinshelwood and (B) the Mars-van
Krevelen mechanisms. 35
Figure 1.5 Mass-normalized rates of CO oxidation on CuO/CeO2, Au/TiO2 and nanoparticulate
C0304. Rates were measured under carbon monoxide lean conditions in differential flow
conditions. Data taken from references 99 (CuO/CeO2), 68 (Au/TiO2) and 54 (Co304). 38
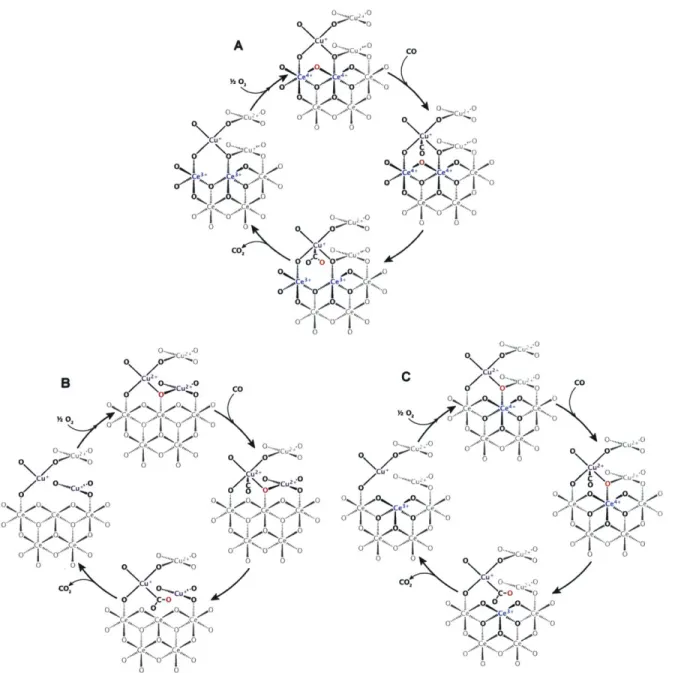
Figure 1.6 Proposed mechanisms for CO oxidation over CuO/CeO2 catalysts; (A) the
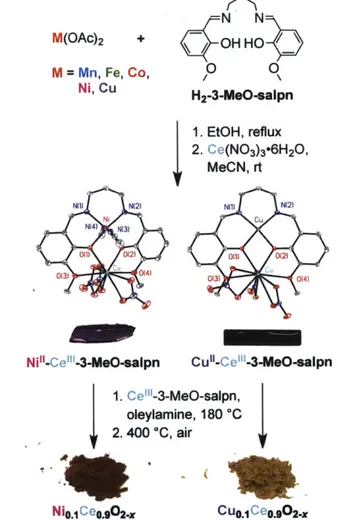
Flytzani-Stephanopoulos, (B) Harrison and (C) Martinez-Arias models. 45 Figure 2.1 The synthesis of Mo.1Ceo.902-x from heterobimetallic 3-MeO-salpn complexes.
Representative crystal structures for Ni"-Ce"'-3-MeO-salpn and Cu"-CeI"-3-MeO-salpn are included, with thermal ellipsoids plotted at 50% probability and hydrogen atoms omitted
for clarity. 61
Figure 2.2 The crystal structures of Co1"-Ce"'-3-MeO-salpn, Ni"-Ce"'I-3-MeO-salpn and Cu"-Ce"I-3-MeO-salpn. Thermal ellipsoids are plotted at 50% probability and hydrogen atoms
are omitted for clarity. 62
Figure 2.3 PXRD patterns for as-synthesized nanocrystalline Mo.1Ceo.902.x and CeO2 compounds
taken at room temperature (copper Ka source). 63
Figure 2.4 TEM, histogram of particle sizes, HRTEM and FFT images of as-synthesized
Mo 1Ceo.902.x. 64
Figure 2.5 The crystal habit of Mo.1Ceo.902x catalysts; (A) a model truncated octahedron, (B)
crystallographic assignments at the [01T ] zone axis and (C) a representative HRTEM of Feo.1Ceo.902-x at the [01T ] zone axis. Crystallographic assignments of the FFT of the image in
(C) are given in the inset. 64
Figure 2.6 Cerium L11-edge and transition-metal K-edge and XAS spectra for annealed CeO2,
Cuo.1Ceo.902-x and Feo.1Ceo.902-x samples; (A) Cerium L1 1-edge XANES spectra and (B) the
magnitude of the k2-weighted Fourier transform of the EXAFS of Cuo.1Ceo.902-x (purple),
Feo.1Ceo.902-x (green) and ceria references; (C) Iron K-edge XANES spectra and (D) the
magnitude of the k2-weighted Fourier transform of the EXAFS of Feo.1Ceo.902.x (green) and
relevant iron oxides; (E) Copper K-edge XANES spectra and (F) the magnitude of the k2
-weighted Fourier transform of the EXAFS of Cuo.1Ceo.902x (purple) and relevant copper
oxides. Ce 111-edge spectra were collected in transmission mode, while Cu and Fe K-edge
spectra were collected in total fluorescence yield mode. Lighter traces in (B), (D) and (F) are
Figure 2.7 XAS spectra for Mno.1Ceo.902,. (A) Ce L1 1-edge XANES and (B) the k2-weighted
Fourier transform of the EXAFS spectra for Mno.,Ceo.902x and nanometer-sized CeO2; (C)
Mn K-edge XANES and (D) the k2-weighted Fourier transform of the EXAFS spectra for Mno.1Ceo.902-x and relevant binary oxides and oxy-hydroxides of Mn. Lighter trace in (B) is
the result of EXAFS fitting. 68
Figure 2.8 XAS spectra for Coo.1Ceo.902-. (A) Ce Lm1-edge XANES and (B) the k-weighted
Fourier transform of the EXAFS spectra for Coo.1Ceo.902x and nanometer-sized CeO2; (C) Co
K-edge XANES and (D) the k2-weighted Fourier transform of the EXAFS spectra for
Coo.1Ceo.902 and relevant binary oxides and hydroxides of Co. The lighter traces in (B) and
(D) are results from EXAFS fitting. 69
Figure 2.9 XAS spectra for Nio.1Ceo.902x. (A) Ce Lm-edge XANES and (B) the k2-weighted
Fourier transform of the EXAFS spectra for Nio.1Ceo.902-x and nanometer-sized CeO2; (C) Ni
K-edge XANES and (D) the k2-weighted Fourier transform of the EXAFS spectra for Nio.1Ceo.902-x and relevant binary oxides of Ni. The lighter traces in (B) and (D) are results
from EXAFS fitting. 70
Figure 2.10 Oxygen K-edge and Copper LII,1 1redge XAS spectra, collected in partial fluorescence
yield mode, for annealed Cuo.1Ceo.902,; (A) Oxygen K-edge XAS spectra and (B) Copper
L1,11redge XAS spectra of Cuo.1Ceo.902-x (purple) and reference oxides. Dashed grey lines
represent charge-transfer multiplet satellites for Cu3
+. 71
Figure 2.11 Phase diagram and local molecular structure computed for Cu(4x)+2Ce34072 models;
(A) computed AGF as a function of oxygen chemical potential for three oxidation states of
copper in Cu(4-x 2Ce3 4072-x; the local coordination of (B) Ce 4 in CeO2 and of (C) Cu3+ in
Cu3+2Ce3 4071 as viewed down the [111] zone axis. The pressure dependence was calculated
at 700 K, with 0.21 atm 02 indicated by the dashed grey lines and the model Cu4
+2Ce3407 2
was taken as the reference for computing AGF. 73
Figure 2.12 CO oxidation catalysis on annealed 3 nm Cuo.1Ceo.902x, 3 nm CeO2 and commercial
5 um CeO2 (Sigma-Aldrich); (A) "Light off' curves and (B) Area-normalized Arrhenius
plots, measured in 1% CO, 2.5% 02 balanced in He at a flow rate of 1300 mL min~1 g',, for
20 mg catalyst loadings. 75
Figure 3.1 Phase identification of CuO/CuCe-y0
2, compounds by (A) PXRD acquired with Cu
Ka radiation and (B) HRTEM. Asterisks indicate CuO phases in A. Shown in B are representative FFT images of the two phases in CuO/Cuoo5Ceo.9502x outlined in the
bright-field image; outlined in blue are nanoparticles of Cuo.o5Ceo.9502- (the middle nanoparticle was
chosen for the FFT) on the surface of a large crystal of CuO, outlined by the red box. 103
Figure 3.2 Raman spectra of CuyCely02-x and CuO/ CuyCely02. acquired at room temperature.
(A) Raw spectra and (B) measured frequency of the F2g mode as a function of copper
substitution in CuyCel-y02. (y). 104
Figure 3.3 Arrhenius plots for CO oxidation over CuO/ CuyCe-y02, (A) normalized by mass and
(B) normalized by surface copper site in CuyCeIO2,. Rates were measured in 1% CO, 2.5%
02 balanced in He at a flow rate of 1300 mL min-' g-1 and TOFs were estimated assuming
homogeneous copper substitution in CuyCely02-. 105
Figure 3.4 Arrhenius plots for CO oxidation over CuO/CuCe1,O2-x normalized by surface
copper site in CuyCe1,O2x assuming surface segregation of copper. Rates were measured in
1% CO, 2.5% 02 balanced in He at a flow rate of 1300 mL min' g-1. 105
Figure 3.5 STEM-EELS analysis of a cluster of three Cuo.o8Ceo.92O2x nanoparticles. (A) Ce M4,5
corresponding to the signal in the ranges 882.4-884.4 eV and 900.4-902.4 eV (green windows in (A)) and (E) sum of (C) and (D); scale bars: 5 nm. 106 Figure 3.6 Computational modeling of CuyCe1-02-.x catalysts by DFT + U and artificial neural
network potential Monte-Carlo simulations. (A) Relative Gibbs free energy of formation for three { 111 } -terminated Cu2Ce34072-x models at various oxidation states, (B) radial probability
of Cu substitution and (C) pair distribution function for Cu-Cu distances in 3.6 nm Cu54Ce4O5O834 nanoparticles. Relative values for AGf were calculated at 700 K using the
oxygen chemical potential associated with 0.21 atm 02; Monte Carlo calculations were carried out simulating annealing from 5000 to 300 K. 107 Figure 3.7 DFT + U-calculated phase diagrams for (A) ss-, (B) nnn- and (C) nn-Cu2Ce3 4072-x slab
models computed at 700 K. The dashed grey lines correspond to 0.21 atm 02 (i.e. air). The lowest-energy slabs for each of the three models (D), corresponding to the stoichiometry Cu3
+2Ce340 71, are also shown for comparison. 108
Figure 3.8 Cu K-edge XAS measurements of Cuo.o8Ceo.9202x performed under reaction
conditions; (A) near-edge spectra and (B) the Fourier transform of the EXAFS in air at 25 *C (blue traces), in 1% CO + 2.5% 02 at 25 *C (green traces) and in 1% CO + 2.5% 02 at 300 'C
(orange traces). Measurements were performed in fluorescent yield mode. When calibrated to the copper oxide references in (A), the mean oxidation states were determined to be 2.86+
(air at 25 *C), 2.85+ (1% CO + 2.5% 02 at 25 *C) and 2.81+ (1% CO + 2.5% 02 at 300 *C). 109
Figure 3.9 STEM-EELS analysis of an individual Mno.1Ceo.902-x nanoparticle. (A) Dark field
image acquired simultaneously with the spectrum images (scale bar: 2 nm), (B) Ce M4,5-edge
spectra corresponding to the boxed regions in A. The dotted line in B refers to the peak at 882
eV ascribed to Ce3+. 110
Figure 3.10 Graphical solution of the surface area ratio as function of the surface distance from
the particle center. The solid black and red lines indicate the { 111 } and { 100} surface areas,
respectively. The dotted black line corresponds to 1/3 of the { 111 } surface area and the blue
circle points out the {111}:{100} ratio of 3:1. 123
Figure 3.11 Comparison of the cohesive energies predicted by the ANN potential and their DFT
reference values. The diagonal (blue line) corresponds to perfect correlation. The energies of structures from the training and test sets are shown as black and red points, respectively. 125
Figure 4.1 The partial pressure dependence of CO oxidation on Cuo.1Ceo.902-x; (A) recorded at 75
*C and (B) 300 'C under differential flow conditions. Reaction rates were measured with
flow rates of 1300 mL min~1 g-'ca, for 20 mg catalyst loadings, holding either the partial
pressure of CO (0.01 atm) or 02 (0.025 atm) constant while varying the partial pressure of the
other gas. 131
Figure 4.2 Schematic reaction mechanism for CO oxidation on CuCe1-y02.x catalysts. Light grey
wedges correspond to Ce - 0 bonds in the subsurface layer. 132 Figure 4.3 DRIFTS spectra (top) and difference spectra (A, bottom) for Cuo.1Ceo.902-x upon
thermal desorption of CO2. CO2 was first adsorbed at rt and then desorbed in He. Spectra
were recorded every 20 *C. 133
Figure 4.4 DRIFTS spectra (top) and difference spectra (A, bottom) for Cuo.1Ceo.902-x upon
heating under CO2 desorption conditions. (A) Cuo.1Ceo.902x heated under a flow of 1% CO2
and (B) CO2 was adsorbed and then the catalyst was heated in 2.5% 02. Spectra were
Figure 4.5 DRIFTS spectra (top) and difference spectra (A, bottom) for Cuo.1Ceo.902x upon CO desorption experiments in He. CO was adsorbed and then the catalyst was heated in He; shown in (A) is the carbonate region and in (B) the CO region. Spectra were recorded every
20 *C. 136
Figure 4.6 DRIFTS spectra (top) and difference spectra (A, bottom) for Cuo.1Ceo.902-x upon
heating in an oxygen-rich CO oxidation stream. The catalyst was heated under a flow of 1%
CO + 2.5% 02, recording spectra every 20 *C. 137
Figure 4.7 Raw NAP-XPS spectra for Cuo.1Ceo.902.x during and after annealing at 400 *C in 75
mTorr 02 and under different CO oxidation conditions. Shown are the 0 and C Is spectra acquired at 650 and 490 eV, respectively. Circles indicate data from cycle 1 while solid lines
indicate data from cycle 2. 138
Figure 4.8 Fitted NAP-XPS spectra at four partial-pressure conditions at the (A) 0 Is and (B) C
Is regions and (C) the surface-normalized intensities at the 0 Is region as a function of oxygen partial pressure at 300 'C. The incident energies used for NAP-XPS were 490 eV (C
Is) and 650 eV (0 1s), and only data from the first cycle are displayed in A and B. 139 Figure 4.9 Cu K-edge XANES spectra of Cuo.1Ceo902-x in 1% CO and 300 'C as a function of 02
partial pressure- cycling. The raw Cu K-edge spectra are given in (A), while (B) tracks the nominal oxidation state of the Cu absorber as a function of oxygen partial pressure. 141
Figure 4.10 Structural changes in Cuo.1Ceo.902-x under CO oxidation conditions at 300 'C as
measured by Cu K-edge EXAFS. (A) The k2-weighted magnitude of the Fourier transform of the EXAFS and (B) the extracted changes in the first coordination sphere of Cu in
Cuo.1Ceo.902-x in 1% CO as a function of oxygen partial pressure. 142
Figure 4.11 The DFT-computed reaction mechanism of CO oxidation on {111}-terminated
CuyCe1.yO2-x. For each step, the total energy is the sum of the slab (including bound
adsorbates) and any non-participating adsorbates. The calculated total reaction energy for the overall reaction 2CO + 02 --> 2CO2 is given by the dashed grey line. CO adsorbs to Cu3+ in
step 1 followed by the oxygen-atom transfer in step 2 to form a bent CO2 adduct. CO2 desorbs
in step 3 to leave an oxygen vacancy on the surface. 02 adsorbs to this vacancy forming an
022- intermediate (step 4), which then adsorbs the second equivalent of CO (step 5). A second oxygen-atom transfer to CO (step 6) gives another bent CO2 intermediate, which desorbs in
step 7 and closes the catalytic loop. 144
Figure 4.12 The density of states for oxidized (CU3+2Ce34071) and reduced (CU2+2Ce34071) as
calculated for { 111 }-terminated slab models for Cuo.,Ceo.902-. Highlighted in purple are the
occupied and unoccupied partial density of states of copper parentage. 145
Figure 4.13 The hydroxide insertion reaction of carbon monoxide by a Ni(II) PNP pincer
complex (A) and the crystal structure of the resulting rl' hydroxycarbonyl adduct (B). Hydrogen atoms (besides the hydroxycarbonyl) are omitted for clarity. Crystallographic data
are from reference 28. 145
Figure 4.14 Reaction coordinate diagram for CO adsorption to nn-Cu2Ce3 4071. Intermediate 1
simulates non-interacting gaseous CO. Intermediates 2 - 4 were calculated by constraining the CO adsorbate 2.4, 2.1 and 1.9 A from the copper center, while intermediate 5 represents fully adsorbed CO. Total energies (Cu2Ce34071 + CO) along the adsorption pathway were
calculated by constraining the z-height of the carbon of CO. 146
Figure 5.1 CO oxidation catalysis on Mo.1Ceo902x nanoparticles; (A) light-off curves and (B)
site-normalized Arrhenius plots for CO oxidation under CO lean conditions. Rates were measured at a flow rate of 1300 mL min-1
Figure 5.2 The partial pressure dependence of CO oxidation on Mo.1Ceo.902.x catalysts; (B)
Mno.1Ceo.902.x at 195 'C, (B) Feo.1Ceo 902x at 195 'C, (C) Coo.1Ceo9O 2.x at 120 'C and (D)
Nio.1Ceo.902-x at 120 'C. Reaction rates were measured with flow rates of 1300 mL min-'
g-1
ca,
for 20 mg catalyst loadings, holding either the partial pressure of CO (0.01 atm) or 02 (0.025 atm) constant while varying the partial pressure of the other gas. 158
Figure 5.3 Calculated phase diagrams for { 111 }-terminated nn-M2Ce34072-x model slabs for M =
(A) Mn, (B) Fe, (C) Co and (D) Ni. Gibbs free energies of formation, relative to
nn-M2Ce34O72 for each metal, were computed at 700 K with energies calculated at the DFT + U
level of theory. The dashed grey lines correspond to 0.21 atm 02. 160
Figure 5.4 The lowest energy structures calculated for { 111 }-terminated nn-M2Ce34072x slabs at
700 K and 0.21 atm 02, as determined by Figure 5.3. 161
Figure 5.5 Oxygen vacancy formation in { 111 }-terminated slabs of M2Ce34071. 161
Figure 5.6 Turnover frequencies for Mo.1Ceo.902. measured at 100 'C as a function of the
calculated oxygen ion vacancy formation energies of M2Ce3407 1. 162
Figure 5.7 Reversible CO oxidation at the C cluster of CODH II; (A) the proposed mechanism and (B) the structure of the key reactive intermediate (CredCO2) from crystallography.
Table 2.1 Crystallographic and refinement parameters for Co"1-Ce"-3-MeO-salpn,
Ni"-Ce"'-3-MeO-salpn and Cu"-Ce"'I-3-Ni"-Ce"'-3-MeO-salpn. 82
Table 2.2 Crystallographic and refinement parameters for MyCei-yO2-x powders, their BET
surface areas (SABET) and elemental compositions (y). Standard uncertainties in the last digits
are included in parentheses. 83
Table 2.3 Crystallographic and refinement parameters for post-mortem analysis of Cuo.1Ceo.902-x.
Standard uncertainties in the last digits are included in parentheses. 83
Table 2.4 Fourier transform and fitting parameters for EXAFS. 87
Table 2.5 Edge energies (Eo) and nominal oxidation states from transition-metal K-edge XANES
spectra of Mo.1Ceo.902x and binary oxides. Values for E0 were taken at half the edge jump and
estimated oxidation states for Mo.1Ceo.902 were calculated from calibration curves with the
binary oxides. 87
Table 2.6 Parameters from the refinement of cerium LmI-edge EXAFS of Mo.1Ceo.902-x powders.
Standard uncertainties in the last digits are included in parentheses. 88 Table 2.7 Parameters from the refinement of cerium L11-edge EXAFS of Mo.1Ceo.902x powders
fixing the path degeneracies. Standard uncertainties in the last digits are included in
parentheses. 88
Table 2.8 Parameters from the refinement of transition-metal K-edge EXAFS of Mo.1Ceo.902-x
powders from binary oxides. Standard uncertainties in the last digits are included in
parentheses. 89
Table 2.9 Oxygen non-stoichiometry and vacancy content as determined by TGA and XPS
analysis of Ce 3d spectra. 92
Table 2.10 DFT energies of formation of bulk Cuf 4~Ce31064-xfrom CuO and CeO2. 94
Table 3.1 Apparent activation energies (EA) for CO oxidation on CuO/CuyCei.O 2-x powders, their
BET surface areas, (As) and crystallographic parameters for the CuyCe1.02x phase. Standard
uncertainties in the last digits are included in parentheses. 114 Table 3.2 Crystallographic parameters for the CuO phase in CuO/CuYCei-yO2x powders. Standard
uncertainties in the last digits are included in parentheses. 114 Table 3.3 Parameters from the refinement of Cu K-edge EXAFS of Cuo.1Ceo.902-x powders under
catalytically-relevant conditions at room temperature and 300 'C. Standard uncertainties in
the last digits are included in parentheses. 117
Table 3.4 Parameters of the radial basis function (Behler symmetry function) G2
of reference 42
used for the description of the local atomic structure within a cutoff radius of Rc = 6.5 A. 124 Table 3.5 Parameters of the angular basis function (Behler symmetryfunction) G4 of reference 42
used for the description of the local atomic structure within a cutoff radius of R, = 6.5 A. Each set of parameters listed in the table corresponds to 6 equivalent functions for the 6 possible combinations of atomic species (Ce-Ce, Ce-O, Ce-Cu, 0-0, 0-Cu, Cu-Cu) among neighboring atom pairs in the local structural environment of an atom (Ce, 0, Cu). 125 Table 4.1 NAP-XPS fitting parameters for studies on Cuo.o8Ceo.092O2.x and CeO2-x in the C Is
Table 4.2 NAP-XPS fitting parameters for studies on Cuo.o8Ceo.09202.x and CeO2-x in the 0 Is
region. 149
Table 4.3 Parameters from the refinement of Cu K-edge EXAFS of Cuo.1Ceo.902x powders under
catalytically-relevant conditions at 300 'C. Standard uncertainties in the last digits are
included in parentheses. 151
Table 5.1 Calculated oxygen vacancy formation energies for substituted slabs of {111
}-terminated CeO2. 163
Table 5.2 BET surface areas (As), apparent activation energies (EA) and kinetic orders for CO
ANN artificial neural network
As surface area per mass
BEP Bronsted (or Bell)-Evans-Polanyi scaling
BET Brunauer-Emmett-Teller theory of the adsorption of gases CODH II carbon monoxide dehydrogenase II
d crystallite diameter DFT density functional theory
DOS density of states
DRIFTS diffuse reflectance infrared Fourier transform spectroscopy
AG Gibbs energy of reaction
AGI activation barrier for a transition state
Eo XAS edge energy
EA activation energy of a reaction
Evac oxygen ion vacancy formation energy
EDS energy-dispersive X-ray spectroscopy EELS electron energy loss spectroscopy
EXAFS extended X-ray absorption fine structure
F effective scattering amplitude in EXAFS FFT fast Fourier transform
GGA generalized gradient approximation HAADF high-angle annular dark-field imaging
HRTEM high resolution transmission electron microscopy
h reduced Plank's constant
ICP-AES inductively-coupled plasma atomic emission spectroscopy
K equilibrium constant
k photoelectron wavevector
kB Boltzmann constant kn rate constant of reaction n
X photoelectron mean free path length
me electron mass
Y chemical potential
n reaction order
N path degeneracy in EXAFS
PAW projector augmented wave pseudopotential PBE Perdew-Burke-Emzerhof exchange model
PD planar density of atoms along a given crystal plan PROX preferential CO oxidation catalysis
PXRD powder X-ray diffraction
(P effective scattering phase shift in EXAFS
r rate of reaction
R path length in EXAFS
salpn NN'-bis(salicylidene)-propylene-1,3-diamine STEM scanning transmission electron microscopy
TEM transmission electron microscopy TGA thermogravimetric analysis TOF turnover frequency
6 surface coverage
U Hubbard on-site Coulombic interaction XAFS X-ray absorption fine structure
XANES X-ray absorption near edge spectroscopy XAS X-ray absorption spectroscopy
XPS X-ray photoelectron spectroscopy XRD X-ray diffraction
YBCO yttrium barium cuprate (YBa2Cu307.)
1.1 The Global Relevance of Heterogeneous Catalysis
The transformation of chemical species through catalysis is at the heart of various aspects of modem life, from agriculture to the synthesis of pharmaceuticals and will certainly pave the way for future technologies such as alternative energy storage and conversion and carbon sequestration. The direct societal implications of catalysis are nowhere more obvious than the development of the Haber-Bosch process for the synthesis of ammonia in the early 2 0th
century. Stressed by a rapidly expanding population without access to adequate foodstuffs to meet dietary demands in Europe and North America, the western world of the 19th and early 20th centuries saw some of the worse famines in recorded history. In order to meet the demands of an increasingly urbanizing population, modem agriculture relied on the use of nitrogen-rich fertilizers acquired from non-sustainable sources such as guano and sodium nitrate mining to improve crop yield.' By the turn of the century, however, many in the scientific community, most notably the English chemist William Crookes, emphasized the importance of scientific discovery towards the artificial fixation of dinitrogen. Crookes concluded in 1898 that without nitrogen-fixation, the world would stand to have a global wheat deficiency by 1930. Thus the discovery and subsequent commercialization of an efficient means to fix nitrogen into ammonia at high temperatures and pressures using an iron catalyst by German chemists Fritz Haber and Carl Bosch has been credited as the most important scientific accomplishment of the 2 0th century. The Haber-Bosch process, as its has subsequently been come to be known, is largely responsible for the acceleration of the global population from 1.6 billion people in 1900 to the 7.4 billion people we have today and over half of the nitrogen atoms in our bodies have been processed through the Haber-Bosch process.2 In this case, chemical catalysis has transformed the world we live in by intervening
in the natural nitrogen cycle. Looking to the future, we find ourselves in an analogous situation with regards to our energy economy and it will likely be advances in catalytic sciences that will bring about the implementation of sustainable energy conversion and storage in modem society.
The catalytic oxidation of carbon monoxide (CO) to carbon dioxide (C02) has also made
a lasting impact on the modem world. For instance, the invention and mass commercialization of the internal combustion engine at the turn of the century lead to renewed scientific interest in CO oxidation catalysis. Car manufacturers needed a way to
efficiently convert the poisonous gas, among others, into more benign gaseous products. These scientific endeavors ultimately lead to the development of the modem three-way catalytic converter in use today.3 Renewed interest in developing low-cost, earth-abundant
catalysts for CO oxidation has stemmed from a need to remove CO from hydrogen sources (most notably synthesis gas, an industrial mixture of H2 and CO from the steam reforming of
methane) since CO adsorbs and poisons the surface of platinum anodes in proton exchange membrane fuel cells.4 5 Under such hydrogen-rich conditions where other products can be
formed, the oxidation of CO to CO2 is referred to as preferential CO oxidation, PROX for
short and constitutes a major field of scientific inquiry.' 7 Other real-world applications for
CO oxidation catalysis abound. There is continued interest in removing CO from gas streams in the petrochemical industry, for example. The development of respirator filter technologies for use in mining applications is another notable example.
Scientific research into CO oxidation catalysis is also inspired by the need to understand the fundamental reactivity of carbon monoxide, a key intermediate in C1 chemistry, with surfaces of metals and metal oxides.8 CO oxidation serves as an important model system,
from which new experimental and theoretical tools and techniques have been developed to better understand fundamental aspects of modem catalysis. Some of the most notable examples of this include the work of Gerhard Ertl, who's work applying techniques such as ultraviolet photoelectron spectroscopy (UPS), scanning tunneling microscopy (STM) and photoemission electron microscopy (PEEM) to topics in surface science was recognized with the 2007 Nobel Prize in Chemistry.
As opposed to homogeneous catalysis, the catalyst and the substrate are in separate phases in heterogeneous catalysis. In most cases, the substrate occupies a gaseous or liquid phase and is transformed at the surface of a solid catalyst. Heterogeneous catalysts have distinct advantages over homogeneous catalysts in terms of their applicability to relevant industrial practices. In contrast to the molecular species that make up all homogeneous catalysts, solid heterogeneous catalysts typically are quite robust under strenuous conditions and can maintain their activity over many catalytic turnovers. When solid catalysts are deactivated, thermal treatments can recondition the catalyst surface, which is not the case for molecular species. Additionally, the separation of the solid catalyst from the substrate and products is straightforward in heterogeneous catalysis. Heterogeneous catalysis does have
distinct disadvantages when compared to homogeneous catalysis when it comes to active site specificity. Unlike in molecular species where the reactive site is isolated and well characterized, the identity of the active sites on traditional heterogeneous catalysts can be difficult to rigorously characterize since they occupy only the very top atomic layer of the surface of an extended solid. Even the very notion of a static ensemble of active sites has come into question recently, with much work demonstrating that active sites in heterogeneous catalysis are very fluxional in their behavior and are highly dependent on the catalytic conditions. Recently, techniques such as coherent Bragg rod analysis (COBRA)9 and sum frequency generation spectroscopy, 0 1' which probe the first atomic layer of solids,
have been successfully applied to study the atomic structure of surface active sites. However, these advanced techniques generally require specialized instrumentation and ideal conditions not feasible for most studies. Another related disadvantage to heterogeneous catalysis is the paucity of methods available to the synthetic chemist to tune the atomic structure of these catalytically active sites. Inspired by the field of enzymatic catalysis, much work has been done in the field of homogeneous catalysis to tune not only the first coordination sphere, but also the secondary coordination sphere of molecular catalysts. As we will see later, the introduction of a second coordination sphere to the surfaces of heterogeneous catalysts is one way to potentially break restricting scaling relationships in catalysis.
1.2 Rate Laws and Free Energy Diagrams
Catalysts, whether homogeneous or heterogeneous, alter the rate of chemical transformations by changing the overall activation energy (EA) of the reaction without being consumed. For most applications, a faster catalytic rate and hence a lower EA, is desired. In the case of heterogeneous catalysis, the substrate interacts with the catalyst surface to form surface-bound intermediates with a lower overall EA (Figure 1.1). For each elementary reaction step, the reaction coordinate diagram goes through a local maximum, known as the transition state ($), which governs the speed of the step. The higher this activation barrier
(AGI), the slower the reaction step is.
The rate of any elementary reaction step, such as step B in Figure 1.1, is given by
*-0 ++ o A B CA --777-7' 7-7-7- 7/7//7 77 7/7= without catalyst Reactants \G with catalyst AG G --Products Y Reaction Coordinate
Figure 1.1 Reaction coordinate diagram for an arbitrary reaction with (gray trace) and without (black trace) the aid of a heterogeneous catalyst surface.
where the products are taken over species, either gaseous or surface sites, in the forward (->) and in the backwards (<-) directions, which each has a kinetic rate constant (k). The partial pressure of species i is given by P and the coverage of a particular site i is represented by
ai.
The kinetic orders n1 are taken directly from the stoichiometry of the elementary step and are rarely more than 2 since most elementary steps are monomolecular or bimolecular. To take an example from CO oxidation, the first elementary step for the Langmuir-Hinshellwood mechanism for metallic catalysts (Appendix A.2) is the adsorption of CO onto a vacant metal surface site (*),CO + * COads
Since the forward reaction is bimolecular and the backwards reaction is monomolecular, nco
= 1, n* = 1 and nco ads = 1. The rate expression for this elementary reaction step will therefore
depend on the partial pressure of CO, the coverage of vacant metallic sites and the coverage of CO-adsorbed metallic sites according to
The kinetic rate constant (k) for each elementary step is in turn governed by the Arrhenius equation, which relates k to the logarithm of the Gibbs free energy of activation (AGt) through a pre-exponential factor A
-AGI
k=Ae7B T (1.2)
where T is temperature and kB is the Boltzmann constant. For the overall reaction, Equation 1.2 follows when AGI is replaced with EA. The pre-exponential factor A, also referred to as
the attemptfrequency, is another important quantity in chemical catalysis and it relates to the
frequency at which adsorbed molecules collide with each other at the catalyst surface. According to transition-state theory, in the absence of changes in entropy when forming the transition state, A is on the order of kBT/h = 1013 s, where h is the Planck constant.
The overall, macroscopically observable rate expression for any given reaction mechanism can be considered as the solution to the individual reaction rate expressions (Equation 1.1) for each elementary step, taking into consideration site balance and boundary conditions. Such microkinetic modeling is indispensible as a tool to help support a reaction mechanism, as the overall rate expression has the general form of Equation 1.1. A careful measurement of the kinetic orders (ni) can give experimental evidence for any given reaction mechanism through this microkinetic treatment. Additionally, detailed microkinetic modeling can also aid in the optimization of real catalysts. Often, it is convenient to introduce a
rate-determining step (rds) when considering a reaction mechanism. As the name implies, the
rate-determining step is the elementary reaction step in a mechanism that governs the overall rate of the reaction. The rds need not be the elementary step with the highest AGI, which is a common misconception. By definition, the rate-determining step includes the least energetically favorable transition-state along the reaction coordinate diagram. The rates of all steps prior to and following the rate-determining step depend on the reaction coordinate diagram going through this high-energy state. In Figure 1.1, step 3 would be considered to be the rate-determining step as its transition-state is the global maximum. When there is an obvious rate-determining step, it is often convenient to make the assumption that the overall rate of reaction is given by the rate expression for the rds and that all other elementary steps
mathematics of microkinetic modeling is made considerably easier and most rate expressions can be solved algebraically. As we shall see, the introduction of a rate-determining step also serves as a powerful pedagogical tool to understand catalysis.
1.3 Linear Free-Energy Scaling Relationships
A rigorous, a priori prediction of the overall catalytic activity for a given solid surface depends on calculating accurate transition-state energies and applying microkinetic modeling to a mechanism. While the attempt frequency A can be easily predicted from theory, values for AGI are notoriously difficult to calculate since transition-states lie at saddle points in the potential energy surfaces of reactions. As such, the search for new heterogeneous catalysts has traditionally been empirical, depending on large-scale screening and combinatorial approaches. Recent years have seen an increase in the application of linear free-energy scaling relationships to the rational search for better heterogeneous catalysts. At the heart of this approach is the notion that for a set of related catalysts, the transition-state energy AGt is linearly dependent on the change in free energy (AG) for a given elementary reaction step through a proportionality constant a:
AGI = aAG +
P
(1.3)The physical basis for Equation 1.3 is summarized in Figure 1.2A. The stabilization of the reaction intermediate in Figure 1.2A in turn stabilizes the transition-state, thus lowering AG' and speeding up the rate of the elementary reaction step. A notable advantage to this phenomenological model is that given a training set of data for a number of previously characterized catalysts, a value for AGI can be predicted from AG. Values for AG are calculated from intermediate species, which are the local minima of potential energy surfaces and are therefore computationally less expensive than calculating transition-states. Once the values for a and P are determined for this training set, Equation 1.3 can be substituted into Equation 1.2, making the microkinetic solution a function of thermodynamic binding energies (AG) as opposed to transition-state energies. Equation 1.3, known as the Bronsted (or Bell)-Evans-Polanyi (BEP) relation after the chemists who developed it,12-14 should come
to no surprise to most chemists. The Hammett equation from organic chemistry is a well-known manifestation that interrelates kinetic and equilibrium constants in substituted benzoic acid derivatives.15'16It is important to note that the BEP relation is entirely phenomenological
and the linear dependence of AG- on AG is by no means universal for all heterogeneously catalyzed reactions.
A direct consequence of applying the BEP relation to heterogeneous catalysis is the Sabatier principle (Figure 1.2B). Named after the French chemist Paul Sabatier, the principle states that the optimal heterogeneous catalyst should bind the substrate neither too weakly nor too strongly. 17.1 A catalyst that binds the substrate too weakly (AG more positive) will
not be able to supply sufficient reactants to the surface of the solid for catalysis to turn over. On the other end of the spectrum, a catalyst that binds the substrate too strongly (AG more negative) will have difficulty turning over surface reactions since the strength of adsorption with the intermediates is too great to overcome.
A \G !=o +~ 0 Reaction Coordinate B 0-AG
Figure 1.2 Linear free-energy scaling relationships and their implications for catalysis. (A) Reaction coordinate diagram demonstrating the case when there is a linear relationship between
AGt and AG and (B) a schematic Sabatier plot using linear free-energy relationships.
An important consequence of applying the BEP relation (Equation 1.3) to microkinetic analysis, as demonstrated schematically in Figure 1.2B, is that the overall catalytic activity of
a solid can be optimized by tuning an easily calculated thermodynamic term (AG), which is known as an activity descriptor. Remember that AG is just the reaction free energy for one elementary process in a multi-step mechanism. Thus, the choice of an adequate descriptor relies heavily on the proposed reaction mechanism. In some cases, values for AG for intermediates are linear dependent with themselves, which has important consequences for catalysis. In other cases, the elementary step will not follow the BEP relation (i.e. a = 0), suggesting that the AG for that step is not a suitable descriptor for catalysis. For the case where it is safe to apply the rate-determining step assumption, AG for the rds may serve as a suitable descriptor for the catalytic process.
While predicting kinetic parameters based on thermodynamic free energies is a particularly attractive approach to rational catalyst design, an intuitive understanding of AG for a particular elementary step may not come easily to an experimental chemist. Fortunately, thermodynamic free energies often correlate with observable, physical properties of catalysts. A notable example is the correlation of oxygen and carbon monoxide binding strengths (AGo and AGco) to the relative position of the d-band of 3d - 5d metal surfaces, which was pioneered by Danish physicists Jens Norskov, Bjork Hammer and collaborators.19 Electronic states of d-orbital parentage for metal surfaces are of appropriate energy and symmetry to participate in or and z bonding and anti-bonding interactions with oxygen and carbon monoxide adsorbates. For surfaces with a center of mass of the electronic density of states (DOS) of d-parentage sufficiently lower than the Fermi level of the system, both bonding and anti-bonding orbitals are occupied leading to a relative weak surface-adsorbate interaction. As the d-band increases towards the Fermi level, however, the anti-bonding orbitals of the surface-adsorbate interaction fall above the Fermi level and become partially unoccupied. Therefore, metals with higher d-band centers participate in stronger surface-adsorbate interactions (AG becomes more negative), which has been verified spectroscopically in several cases for 3d - 5d metal and metal-alloy surfaces.2 0,2 The success of the
Hammer-Norskov d-band model, as it has been come to be called, has guided much of the research into next-generation platinum alloy catalysts for the oxygen reduction reaction (ORR) as well as for CO oxidation as demonstrated in Figure 1.3.2228 Platinum alloys with lower d-band centers correspond to the weak-binding branch of the Sabatier plot while higher d-band centers correspond to the strong-binding branch. Catalysts such as Pt3Co and Pt3Ta alloys
have intermediate d-band centers and hence intermediate 0 and CO binding strengths and optimized catalytic activities.
A o2 + 4H+ + 4e- -2H2 0 22 E () 4 -E -3.50 -3.25 -3.00 -2.75 -2.50
d-band center (eV) B 90 60'+%02 __ Co2 80 -3 70 E60-2 50--0/ E 40 -o 30-20 -10 -3.50 -3.25 -3.00 -2.75 -2.50
d-band center (eV)
Figure 1.3 The specific catalytic activity for (A) oxygen reduction and (B) CO oxidation as a function of the DFT-calculated d-band center for platinum alloys. Measurements for ORR were
recorded in 0. 1 M HC04 and those for CO oxidation were acquired in a reactor with 0.02 at
CO and 0.01 atmn 02 at a flow rate of 0.67 mL min-' mg-' at 200 'C. Adapted with permission
from references 22 and 28.
The Hammer-Norskov d-band model is a notable example of a descriptor-based approach to catalyst discovery and design. Instead of relying on exhaustive catalyst screening, this
approach correlates tunable physical properties of a solid (the descriptor) with the free energy of an elementary step (AG). Through the BEP relation and microkinetic analyses of the reaction mechanism, the Sabatier principle (Figure 1.2B3 and Figure 1.3) follows naturally. It's important to note that AG can correlate with many different physical properties of the
catalyst and any given descriptor should not be thought of as unique. Indeed, in our example
of the oxygen reduction reaction and the related oxygen evolution reaction (OER), the last decade of research has put forth a diverse family of descriptors for catalytic activity on both
transition-metals and their oxides. While some correlate activity with the position of bands in the DOS,29,30 others correlate with the electronic configuration of the transition-metal (the
number of valence electrons, the number of electrons in the eg antibonding set, etc.),3
1-33 and
still others correlate with structural features of the coordination center.34 Common to these is
the underlying approach outlined here that the descriptor follows directly from a careful treatment of the reaction mechanism, which is in contrast to the activity descriptors found empirically in earlier studies.35-37 These earlier studies, which linked activity with enthalpies of reduction and metal hydroxide formation, do not presume a direct link between the mechanism and the descriptor.
Another shortcoming to descriptor-based catalyst design is the possibility of multiple mechanisms for a given set of catalyst candidates. The construction of quantitative Sabatier plots (Figure 1.2B and Figure 1.3) assumes that all evaluated catalysts share a common reaction mechanism. As such, care should be taken when proposing activity descriptors to give evidence that each catalyst follows the same general mechanism. Similarly, descriptors ought to reflect the physical and chemical properties of the catalyst surface under the relevant reaction conditions. As we shall see, the structure of catalytically active sites can change dramatically under different reaction conditions, which can alter the properties of the catalyst. Thus, a rigorous correlation between the descriptor and catalytic activity should take any of these transformations into account.
1.4 Mechanisms for CO Oxidation Catalysis
In the case of CO oxidation, one atom of oxygen is transferred to carbon monoxide to produce gaseous carbon dioxide,
C 1- 2 O 0
CO + 02 T C02 AGn = -257.2 kJ/mol (1.4)
While the gas-phase reaction itself is exergonic, kinetically it is impossible. In fact, we cannot even draw a free-energy diagram or measure EA for CO oxidation in the gas phase as we've done for the arbitrary reaction in Figure 1.1. The reaction is forbidden by spin selection rules. The total spin of the reactants (S = 0 for CO and S = 1 for 02) and the product
(S = 0 for C02) are not identical, hence the role of a catalyst in this special case is also to
mechanisms for CO oxidation both rely on the formation of reactive oxygen species for oxidative catalysis and follow the general pathway
CO # COads
02 # 2 0 ads
COads + Oads r CO2 ads -+ CO2
In this simplified reaction mechanism, both CO and 02 have to adsorb to the catalyst surface as intermediates before they can react to form a molecule of CO2.In the case of
oxygen, we see that some substrates can adsorb dissociatively. The origin and nature of the activated oxygen species involved in the catalytic reaction, represented here rather generally as "Oads," is an important distinguishing feature between two accepted mechanisms for CO oxidation.
1.4.1 The Langmuir-Hinshelwood Mechanism for CO Oxidation Catalysis
The Langmuir-Hinshelwood mechanism, along with the Eley-Rideal mechanism, can be used to describe most catalytic processes occurring on base- and noble-metal surfaces.38
Originally conceived to explain the kinetics of platinum catalysts for CO oxidation, the Langmuir-Hinshelwood mechanism involves the adsorption of CO and 02 onto metal (M) surfaces, where they react to form CO2 (Figure 1.4A).39 In the first two steps (the order of
which is arbitrary in Figure 1.4A), the gases adsorb to the surface of the metal with 02 adsorbing dissociatively to form two Oads species. Since CO and 02 adsorb to the same metal site M, gas adsorption is considered competitive, with the relative binding strengths (AGads) depending on the electronic structure of the center M. After the diffusion of COads and Oads to adjacent metal sites, these species react in step 3 to form a surface-bound CO2 intermediate,
which desorbs rapidly in step 4 completing the reaction cycle.
Since it involves the breaking of strong surface-adsorbate bonds, the third step is typically considered rate-determining. Thus the overall rate law expression can be written as
rL-H =k30C000 - k3'0C0 26* (1.5)
where Oco, 0 and OC02 are the surface coverages of COads, Oads and CO2 ads, respectively and
see that the rate will depend on the thermodynamic driving forces for CO and 02 dissociative adsorption onto M. In terms of linear free energy scaling relations, we note that AGco and AGo may be suitable activity descriptors. Indeed, rigorous computational studies on noble-metal catalyst surfaces have shown that AGco and AGO serve as independent descriptors for CO oxidation; the Sabatier plots for these catalysts are three-dimensional, with AGco and AGo as the x- and y-axes and catalytic activity as the z-axis.441
A Co M-M co B M"*-02-_M". co 74o 1 1 0
oo0
7C
QICA C M("-1)*-0-M("-1) M"*-02--M"* M-M M-M Co. 2 M-MFigure 1.4 Mechanisms for CO oxidation; (A) the Langmuir-Hinshelwood and (B) the Mars-van Krevelen mechanisms.
Assuming the other steps are under steady-state conditions and defining equilibrium constants K for CO and 02 adsorption and CO2 desorption, we can expand Equation 1.5 (See
Appendix A.2) to relate the overall reaction rate in terms of partial pressures;
kKCO adsK 1/2 dp 2 _ k' PCi 2
rL-H 2 a 2 KCO2 des )2 (1.6)
1 + KCO adsPCO + K/2 ads1/2 + / 02KC0 1 2 des C02)
A few more generally accepted assumptions can be made to simplify Equation 1.6. First, the desorption of CO2 from the surface is generally considered very favorable (1/Kco2 des ~
0)-Additionally, CO adsorption is typically much stronger than 02 dissociative adsorption (Kco adsPCO >> (1 + K0 adsP02). Thus Equation 1.6 simplifies to
k 1/2 P1/2
r = 3 kK2 ads 02 (1.7)
rL-H KCO adspCO
A few salient features of Equation 1.7 are important to note. As we have discussed, CO and
reflected by the position of the equilibrium constants in Equation 1.7 on either side of the fraction bar. Additionally, we see that the reaction is 2 order with respect to 02 and inverse first order with respect to CO. This partial pressure dependence is an important clue when proposing reaction mechanisms, since the second common mechanism for CO oxidation catalysis, the Mars-van Krevelen mechanism, has a significantly different partial pressure dependence.
1.4.2 The Mars-van Krevelen Mechanism for CO Oxidation Catalysis
In contrast to the classical Langmuir-Hinshelwood mechanism, many studies on transition-metal oxide catalysts have proposed an alternative mechanism for CO oxidation. The Mars-van Krevelen mechanism (Figure 1.4B) was originally used to describe the catalytic oxidation of aromatic compounds with vanadium oxides, and the defining feature of the mechanism is the direct involvement of framework 02. ions in the oxidative step.42 The Mars-van Krevelen mechanism has been implicated for CO oxidation catalysis on a wide
array of oxide catalysts such as RuO2,
4 3 single-phase CuOx,44 mixed-phase Cu/CeO
2,
45'46 and
even Pt under high-pressure conditions.47
After the adsorption of CO onto a metal site M, an oxygen atom from the oxide lattice is transferred to CO to form the CO2 adduct in step 2 (Figure 1.4B). Taken together, elementary
steps 1 and 2 in Figure 1.4B are analogous to the insertion of carbon monoxide into the oxygen bond of molecular platinum, iridium and nickel hydroxides to form metal-hydroxycarbonyl adducts in organometallic chemistry (see Figure 4.13 and the discussion in Section 4.5).48-51 The desorption of gaseous CO2 in step 3 results in the formation of an oxygen vacancy (denoted 0), effectively reducing the surface by two electrons. The dissociative adsorption and reduction of 02 refills this vacancy in step 4, thus closing the catalytic cycle. Similar to the Langmuir-Hinshelwood mechanism, the transfer of the lattice oxygen atom to CO (step 2) can be considered the rate-determining step; not only are strong M-0 bonds broken, but the surface is reduced by two electrons. Upon first glimpse, the Langmuir-Hinshelwood and Mars-van Krevelen mechanisms may appear nearly identical. Both mechanisms adsorb CO and 02 onto metal sites and both have rate-determining steps involved with C-O bond formation. There are subtle but important features of the Mars-van Krevelen mechanism that distinguish it from Langmuir-Hinshelwood kinetics. While CO and 02 must compete for adsorption at metal sites in the Langmuir-Hinshelwood mechanism, the
same is not strictly true for the Mars-van Krevelen mechanism. In our oversimplified mechanistic picture in Figure 1.4B, CO adsorbs to coordinatively unsaturated transition metal centers at the surface of the bulk oxide, while oxygen only adsorbs into oxygen vacancies created upon C-O bond making in step 2. While it is certainly true that CO can adsorb into oxygen vacancy sites and 02 can compete with CO at unsaturated surface sites, these interactions are thermodynamically unfavorable. In the case of CO adsorption to oxygen vacancy sites, geometric constraints imposed by the extended metal oxide preclude the binding of adsorbates other than oxygen. Of course the oxygen filling the vacancy could come from CO, but that would require breaking one of the strongest bonds in chemistry. The C-O bond in carbon monoxide has a bond dissociation energy (1077 kJ/mol) over twice that of the 0-0 bond in 02 (498 kJ/mol). In the case of 02 binding to unsaturated surface sites, we have already noted that CO preferentially binds to these sites over 02 during our discussion of the Langmuir-Hinshelwood mechanism.
These important features are highlighted by the rate expression we derive from Figure 1.4B. Since we propose the C-0 bond formation step (step 2) to be the rate-determining step, our overall rate law has the form
rM_,K= k2 co - k2'OCO2 (1.8)
Since CO and 02 adsorption processes are noncompetitive, the forward reaction rate is a function only of the coverage of CO bound to the unsaturated transition metal sites, in contrast to the rate expression for Langmuir-Hinshelwood kinetics (Equation 1.5). As we have done previously for the Langmuir-Hinshelwood mechanism, we assume that the other elementary steps in Figure 1.4B are under steady state conditions governed by their equilibrium constants. Expressing Equation 1.8 in terms of partial pressures (see Appendix A. 1 for full derivation) gives us the extended rate expression for Mars-van Krevelen kinetics:
k2'KvacPCO
2
k2KCO adsPCO - 1/2
rMvK = KCO2 desPO2 (1.9)
1 + KcO adspCO + 1/2( + CO d
As we have discussed previously in 1.4.1, CO2 desorption from transition metal sites can