HAL Id: hal-02357365
https://hal.archives-ouvertes.fr/hal-02357365
Submitted on 14 Nov 2019
HAL is a multi-disciplinary open access
archive for the deposit and dissemination of
sci-entific research documents, whether they are
pub-lished or not. The documents may come from
teaching and research institutions in France or
abroad, or from public or private research centers.
L’archive ouverte pluridisciplinaire HAL, est
destinée au dépôt et à la diffusion de documents
scientifiques de niveau recherche, publiés ou non,
émanant des établissements d’enseignement et de
recherche français ou étrangers, des laboratoires
publics ou privés.
Tracing cadmium contamination kinetics and pathways
in oysters (Crassostrea gigas) by multiple stable Cd
isotope spike experiments
Emilie Strady, Jörg Schäfer, Magalie Baudrimont, Gérard Blanc
To cite this version:
Emilie Strady, Jörg Schäfer, Magalie Baudrimont, Gérard Blanc.
Tracing cadmium
contam-ination kinetics and pathways in oysters (Crassostrea gigas) by multiple stable Cd isotope
spike experiments.
Ecotoxicology and Environmental Safety, Elsevier, 2011, 74 (4), pp.600-606.
Tracing cadmium contamination kinetics and pathways in oysters
(Crassostrea gigas) by multiple stable Cd isotope spike experiments
Emilie Strady
a,n, Jo¨rg Scha¨fer
a,n, Magalie Baudrimont
b, Ge´rard Blanc
aa Universite´ de Bordeaux, UMR EPOC 5805, GEMA Team Av. des Faculte´s, 33405 Talence, France b Universite´ de Bordeaux, UMR EPOC 5805, Place du Dr B. Peyneau, 33120 Arcachon, France
a r t i c l e i n f o
Article history:
Received 20 May 2010 Received in revised form 6 October 2010 Accepted 9 October 2010 Available online 28 October 2010
Keywords: Crassostrea gigas
Cadmium
Stable isotope spiking Trophic direct contamination
a b s t r a c t
Laboratory experiments using stable Cd isotopes (110Cd and112Cd) were conducted to separately and
simultaneously characterize Cd accumulation in different tissues of Pacific oysters (Crassostrea gigas) via the (i) trophic and (ii) direct pathways. For this, we exposed juvenile oysters to110Cd-spiked seawater
(110Cd: 2mg l—1; constant level) and 112Cd-spiked food (Thalassiossera weissflogii,112Cd: 2mg l—1in 3
35 ~ 10 cells/oyster/L) in four experimental treatment groups,each containing 6 oysters, for 21 days with constant trophic feeding. These Cd contamination levels were ~ 10 times lower than those typically used in experimental accumulation studies. Three oysters per treatment group were dissected every 7 days with separate sampling of the gills, digestive gland and the rest of the body. Metallothioneins were analysed in the digestive gland and gills. Cadmium concentrations and isotope ratios were measured in water (daily) and tissues (weekly) by GF-AAS and ICP-MS. The observed time-dependant evolution in Cd concentrations and110Cd/114Cd and112Cd/114Cd isotope ratios clearly revealed the bio-accumulation
short-term kinetics and pathways of Cd contamination in the different tissues. Under the experimental conditions, significantly changed isotope ratios in gills and the digestive gland of oysters suggested rapid and efficient contamination by110Cd derived from direct exposure followed by internal Cd transfer
between organs. Trophic contamination became measurable after 14 days of exposure corresponding to a trophic transfer rate of 1%. Constant metallothionein levels during the experiment suggested that the initially present metallothionein levels were sufficient to deal with the experimental Cd exposure.
1. Introduction
Oyster cultures are economically important in coastal areas. Oysters are filter-feeding bivalves that easily accumulate trace metals, especially cadmium (Baudrimont et al., 2005; Lekhi et al., 2008; Bendell and Feng, 2009; Christie and Bendell, 2009; Ng et al., 2010). Due to known human health effects (Bragigand et al., 2004; Cheng and Gobas, 2007; Copes et al., 2008; Widmeyer and Bendell-Young, 2008; Saratug et al., 2010), consumption of oysters has been limited to 5
m
g g—1 dw in Europe (CE No. 466/2001). Oysterproduction and selling have thus become restricted to regions where cadmium oyster concentrations are below this amount. Thus, detailed knowledge of the mechanisms underlying Cd accumulation by the oyster is needed such that possibleremedia-tion strategies can be implemented.
Experimental studies of Cd bio-accumulation in oysters using radiolabelled isotope analysis have shown that contamination may occur via direct (metal uptake by the gill epithelium of the dissolved
metal from the water column) and trophic (metal uptake by the digestive apparatus of metal associated to nutritive particles) pathways (Reinfelder et al., 1997; Boisson et al., 2003). This technique is very sensitive at low contamination levels, but the analytical constraints and the authorisations required to use radiolabelled isotopes make this technique inaccessible to non-labelled laboratories. Thus, most experimental studies of trace metal contamination of marine organ-isms are based on dose–response experiments where exposure levels typically are orders of magnitude higher than real environmental conditions, for example in recent literature (Brinza et al., 2009; Nadella et al., 2009). Globally, such high metal exposure levels facilitate both measuring bio-accumulation and control exposure levels in seawater and detecting ecotoxicological responses to contamination with respect to sensitivity of currently applied analytical techniques such as atomic absorption spectrometry (AAS) or mass spectrometry (MS). Furthermore, analysing dissolved metals in seawater to continuously adjust exposure level during the experiment requires specific techniques and protocols to control/limit saline matrix effects, e.g. by dilution, liquid/liquid or solid/liquid extraction before AAS and MS measurements (Danielsson et al., 1982; Dabrin et al., 2009; Strady et al., 2009). Accordingly, the experimental metal exposure level may depend on analytical performances and the chosen metal exposure levels typically have been much higherthan environmental values and open
doi:10.1016/j.ecoenv.2010.10.020
n Corresponding authors.
E-mail addresses: [email protected] (E. Strady),
to criticism. In this context, we based Cdcontamination experiments on single stable isotope enrichment and Inductively Coupled Plasma Mass Spectrometry (ICP-MS) measurements as previously studied in freshwater (Croteau and Luoma, 2007; Croteau et al., 2007; Komjarova and Blust, 2008). We improved this method by (i) developing multiple stable Cd isotope enrichment to trace simultaneously both contamination pathways and (ii) in estuarine and marine waters after removal of the saline matrix by solid–liquid extraction. This approach aimed at using close-to environment expo-sure levels to (i) simultaneously trace different contamination path-ways in the marine environment, (ii) determine the respective kinetics and (iii) identify related detoxification processes using protein responses.
The objective of the present work was to explore the potential of multiple stable Cd isotope spikes to simultaneously trace accumulation kinetics andpathways in gills, digestive glands andthe rest of the oyster tissues exposed to direct or/and trophic contamination. For this, we exposed juvenile oysters to seawater and algae spiked with single Cd stableisotopes (e.g.110Cd in seawater and112Cd in algae) at levels only
~10 times higher than typical mid-salinity values in the Gironde Estuary (Dabrin et al., 2009), for three weeks. In fact we referenced the exposure level of the experiment to the historic polymetallic polluted Gironde Estuary (Boutier et al., 1989; Jouanneau et al., 1990; Lapaquellerie et al., 1995;Audry et al., 2007), where oyster farming has been forbidden because of high Cd contents measured in wild oysters (Boutier et al., 1989). We report and discuss time-resolved Cd accumulation in organs and the rest of the tissues obtained from changes in isotope ratios over time and on metallothionein levels observed. Finally, the role of direct and trophic pathways in the observed accumulation patterns is discussed.
2. Materials and methods
2.1. Oysters
Juvenile Pacific oysters (18 months old, ~ 4 cm shell length, Crassostrea gigas) were coming from a farming activity in the uncontaminated area, the Arcachon Bay France (Marie, 2005). W e selected 72 oysters with similar weight and shape, and introduced six of them in each experimental treatment (10 L synthetic seawater, salinity 15, [Cd] ¼ 30 ng L—1; Instant Oceans) two days before the contamination
experiment and without feeding for acclimatising.
2.2. Experimental conditions
Direct and trophic pathways were traced by spiking seawater and algae with stable cadmium isotopes,110Cd and112Cd, respectively (Assays, atomic percent
97.36% and 98.27%, respectively). Seawater, initially Cd concentrated at 0.07mg L—1,
was110Cd-spiked at 2mg L—1. All oysters were fed daily with Thalassiosira weissflogii
3 —1 —1
at a constant level (35 ~ 10 cells oyster L , counting by Nageotte chamber) close to environmental conditions (e.g. Marennes-Ole´ ron Bay, Malet et al., 2008; Thau Lagoon, Dupuy et al., 2000). Algae for trophic characterisation were112
Cd-spiked at 2mg L—1for 200 ~ 103cells L—1, 48 h before being fed to the oysters, and
were added to the experimental treatments every two days. The algae were grown in the laboratory in specific chambers containing enriched nutrient medium. Cd concentrations in the algae were determined by substituting the [Cd] in the filtered water where the algae were contaminated to the initial [Cd] added, as the algae dry weight was too low.
Globally, this feeding rate was sufficient to produce faeces and pseudo-faeces, which were collected with a Pasteur syringe, dried and kept at 4 1C in the dark. Thus, six oysters per treatment were exposed to four conditions in three replicate treatments (Fig. 1): (1) Control, C; (2) SW,110Cd: 2mg L—1, enriched seawater
representing the direct pathway; (3) A, 112Cd: 2 mg L—1 for 200 ~ 103 cells L—1,
enriched algae representing the trophic pathway and (4) SWA, enriched seawater and algae, representing both direct (110Cd: 2mg L—1) and trophic (112Cd: 2mg L—1
3 —1
for 200 ~ 10 cells L ) pathways.
2.3. Water control
During experiments,110Cd concentrations were adjusted daily to 2mg L—1after
Cd determination by GF-AAS (Solaar Thermo; Pd 2 g L—1 and Mg 1 g L—1matrix
modifiers, 10-fold dilution). Physico-chemical parameters were controlled daily and kept at constant level: salinity 15 7 0 . 3 , temperature 15 1C7 1 1C, pH 8.37 0 . 2 and
2
O (100% saturation) via an oxygen diffuser. The light conditions employed were 12 h per day under lighting and in the dark. Furthermore, 60 mL of seawater was sampled daily in every treatment, acidified (HNO3Ultrex, 2%), stored at 4 1C in the
dark, and dissolved metal was pre-concentrated and separated from the salt matrix by solid–liquid extraction (DigiSEP blue cartridges, SCP Science, functional group amino di acetate;Strady et al., 2009) prior to ICP-MS measurements (Thermo ~ X7). This robust method provided very good reproducibility ( o 3%)and accuracy ( o 5 % ) of certified seawater (CASS-4: NASS-5) and also of Milli-Qs water enriched with 110Cd and112Cd.
2.4. Metal and metallothionein quantification in oyster tissues
Two oysters per treatment (or replicate) were removed before starting the experiment (T0) and after 7 days (T7), 14 days (T14) and 21 days (T21) of exposure. Each oyster was immediately dissected and separated into three parts: gills (G), digestive gland (DG) and the rest of the body (R). Aliquots representing 2/3 of G and DG masses and the whole R were kept at —20 1C for metal analysis. Then they were weighed, dried at 85 1C for 24 h, weighed again, mineralised for 3 h in 3 mL HNO3at
100 1C (DigiPREP,sSCP Sciences) and the solution obtained was stored at 4 1C in the
dark until analysis by GF-AAS (Thermo Solaar; using Pd 2 g L—1and Mg 1 g L—1
matrix modifiers) and by ICP-MS (Thermo ~ X7). The other aliquots representing 1/3 of the G and DG mass were stored at —80 1C under N2-atmosphere until
metallothionein (MT) analysis by the mercury-saturation-assay described byMarie et al. (2006a) and using cold inorganic mercury.
2.5. Cadmium concentrations and stable isotope ratios in oysters by ICP-MS
Oyster tissue digestates were measured by Inductively Coupled Plasma-Mass Spectrometry (ICP-MS; Thermo ~ X7). As stable isotopes were added to seawater
1 1 0 1 1 2
1 1 4
( Cd) and algae ( Cd) to trace contamination pathways, we used external calibration with a Cd elemental solution (SCP Sciencess) calibration and did all of
our calculations from isotope dwell counts (Croteau et al., 2004) according to the following equations expressed for112Cd isotope and transposable to110Cd. Firstly,
we determined the isotope ratios (112/114Cd)
min samples which correspond to the
dwell counts of spiked isotope over the reference isotope Cd
112=114 112 114
ð CdÞm¼ ð CdÞm=ð CdÞm ð1Þ
where (112Cd)
mand (114Cd)mrepresent the measured counts for112Cd and114Cd
isotopes.
Total Cd concentrationin the samples was calculated from the mono-isotopic Cd concentrations (112Cd) as the sum of the natural concentrations derived from
natural isotopes and the additional concentrations accumulated from the spikes (Eqs. (2) and (3)).
112 112 112
½ Cd]¼ ½ Cd]nþ½ Cd]s ð2Þ
where [112Cd]
nand [112Cd]srepresent natural and spiked112Cd concentrations in the
samples.
m
½112Cd]¼ ðð CdÞ ~ ð114 112=114CdÞn Þ ~ Sn þðð CdÞ112 m —ð 114CdÞm ~ ð112=114CdÞn Þ ~Ss112
ð3Þ where (112/114Cd)
n represents natural isotope ratios, Sn and Ss represent,
respectively, the slopes of the natural isotopic abundance calibration curves and of the modified (spiked) isotopic abundance calibration curves.
Fig. 1. Experimental procedure. The [110Cd] and [112Cd] values represent the mean
[110Cd] and [112Cd] measured in seawater units over the 21 days of experiment. To
notice, concentrations attempted in seawater units were [110Cd] ¼ 2 mg l—1and
However, one cannot exclude that112Cd from spiked algae was present in the
seawater of the A (enriched algae) and SWA (enriched seawater and algae) treatments (concentrations very close to 110Cd), contributing 112Cd to direct
contamination. Thus, we corrected this potential112Cd direct contamination from
the110Cd direct signal, in A and SWA treatments, using the following equations
(expressed for SWA and transposable to A treatments):
112 direct SWA 110 direct SWA 112=114 direct SWA
ð CdÞs ¼ ð CdÞs ~ ð CdÞm ð4Þ
where (112Cd)
s dire ct S W A is the 112Cd direct pathway counts in SWA treatments, s
(112Cd)dire ct S W A is the 110Cd direct pathway counts in SWA treatments, and m
(112/114Cd)dire ct S W A is the measured isotope ratios in SWA treatments. m
Thus, in SWA treatments, (112/114Cd)SWA isotope ratios were determined
according to
112=114 SWA 112 112 direct SWA 114
ð CdÞm ¼ ðð CdÞm-ð CdÞs Þ=ð CdÞm ð5Þ
Accordingly, [112Cd] in SWA treatments was determined from Eq (2) by
substituting [112Cd]dire ct, as follows:
112 SWA 114 112=114 112 ½ Cd] ¼ ðð CdÞm~ ð CdÞn Þ ~ Sn þ ð ðCdÞm m —ð CdÞ ~ ð114 112=114CdÞ Þ- ðCdÞ110 direct SWA n s ~ ð112=114CdÞmdirect SWA~S112s ð6Þ Finally, Cd concentration in SWA treatments was calculated using both 110Cd
and 112Cd isotope concentrations according to the following equation: s
SWA 110 SWA 112 SWA
½Cd] ¼½ Cd] þ ½ Cd] ð7Þ
2.6. Statistical analysis
We first checked the normality and homogeneity of error terms. When these assumptions were achieved (e.g. bio-accumulation and metallothionein), the signifi-cant effect of factors taken into account was analysed using a variance method (ANOVA) and a least square deviation test (LSD). When assumptions were not respected (e.g. isotope ratios), a non-parametric method was performed using the Kruskall–Wallis test. For all statistical results, a probability of p o 0 . 0 5 was considered significant.
3. Results
3.1. Experimental conditions
Cadmium concentrationswere measured daily in all experimental treatments (Fig. 1). In C treatments, concentrations were low and
constant over the experiment (Fig. 1). In SW treatments, Cd concentrations varied with a mean of 2.270.5
m
g L—1(Fig. 1). In Aand SWA treatments, GF-AAS measurements revealed Cd concentra-tions higher than expected. Simultaneous measurements by ICP-MS showed enrichment in 112Cd in A and SWA treatments, probably
originating from release of112Cd from contaminated algae. Thus, Cd
concentrations in seawater were calculated from the112Cd isotope
(Eq. 7) in A and SWA treatments (Fig. 1).
3.2. Cadmium isotope ratios in oyster tissues
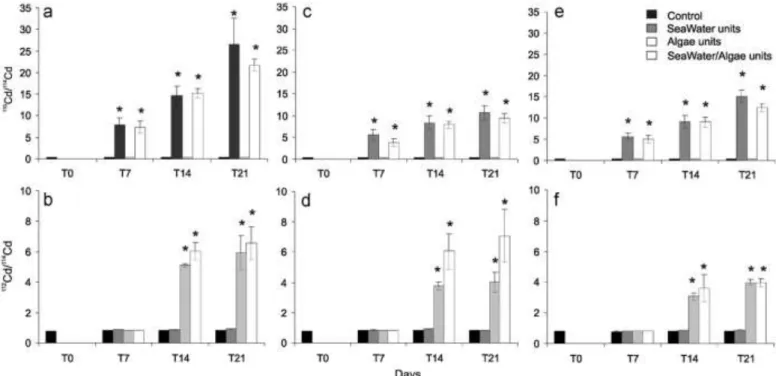
Time-dependent evolution of Cd isotope ratios110Cd/114Cd and 112Cd/114Cd in gills, digestive gland and the rest of the body were
measured for the different experimental conditions after 7, 14 and 21 days of exposure (Kruskall–Wallis test, p o0.05; Fig. 2). The
110Cd/114Cd ratio, characterizing direct contamination,
signifi-cantly changed after 7 days of exposure in gills, digestive glands and in the rest of the tissues for the SW and SWA treatments (Fig. 2a, c, e). After 21 days,110Cd/114Cd ratios in gills from A and
SWA were significantly higher than in digestive glands and the rest of the tissues. In contrast, trophic contamination characterised by
112Cd/114Cd ratios became significantly measurable after 14 days of
exposure in gills, digestive glands and the rest of the tissues for the A and SWA treatments (Fig. 2b ,d, f). After 21 days, the112Cd/114Cd
ratios in gills and digestive glands were similar in magnitude.
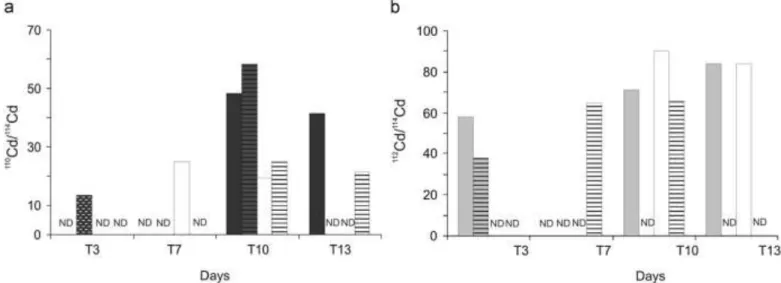
3.3. Cadmium isotope ratios in faeces and pseudo-faeces
Since oysters did not regularly produce faeces (F) and pseudo-faeces (PF), we could not collect them daily in every treatment. Thus, we grouped F and PF of the three replicate treatments and compared their isotope composition to those of the Control treatment sampled the same day or within the same few-days interval, when the production was too low. The110Cd/114Cd ratios
in F and PF changed rapidly (after 3 days of exposure) and showed significantly higher enrichment in PF than in F (Kruskall–Wallis
Fig. 2. Stable Cd isotopes ratio variations (110Cd/114Cd and112Cd/114Cd, mean 7 SEM, n ¼ 3) in gills (a, b), digestive glands (c, d) and rests of bodies (e, f) over experiment from
Controls units (black area), SeaWater units (dark grey area), Algae units (light grey area) and SeaWater/Algae units (white area). Stars indicates the significance (p o 0.05, Kruskall–Wallis test).
test, p o0.05;Fig. 3a). Higher variations occurred in F and PF from SW treatments than from SWA treatments (Fig. 3a).112Cd/114Cd
ratios in F and PF varied rapidly, significantly and with the same amplitude in A and SWA treatments (Fig. 3b). However, measured
112Cd/114Cd ratios were higher in Fthan in PF.
3.4. Cadmium bio-accumulation in oyster tissues
Cd concentrations in oyster tissues were measured by ICP-MS and bio-accumulation was calculated from Cd stable isotope enrichment (see Section 2). Thus, we calculated both direct (110Cd) and trophic (112Cd) contamination in the gills, digestive
gland and rest of the body from the respective excess isotopes and corrected the data for 112Cd stable isotope accumulated by the
direct pathway in A and SWA treatments according to Eq. (7) (Fig. 4).
Cadmium concentrations in gills, digestive glands and the rest of the tissues from Control oysters were constant over time (Fig. 4a– c). After 21 days, concentrations were significantly higher in all tissues of oysters from SW and SWA treatments than in those from A treatments (ANOVA p o0.05;Fig. 4a–c). From T14 to T21, Cd accumulated more efficiently in digestive glands than in gills, and accumulation in the rest of the body slightly increased (Fig. 4). In fact, bio-accumulation in gills, which are the most exposed tissues to the direct pathway, was 2-fold and 6-fold higher than in Control
oysters after 7 days and 21 days of exposure, respectively (Fig. 5). Furthermore, final Cd concentrations in gills and digestive glands were similar and tended to be higher than in the rest of the tissues.
3.5. Metallothionein levels
Metallothionein (MTs) levels in oysters were measured in gills and digestive glands at the beginning (T0) and the end (T21) of the experiment for all treatments (Fig. 5). After 21 days, MT concentrations in gills and digestive glands of oysters from the SW, A and SWA treatments were not significantly different from those in gills and digestive glands of Control oysters (ANOVA p o0.05; Fig. 5a,b).
4. Discussion
4.1. Stable isotope enrichment
Simultaneous tracing of direct and trophic Cd bio-accumulation oyster tissues using two stable Cd isotopes was successful. In fact,
110Cd and112Cd enrichment in seawater and algae, respectively,
induced rapid, important and precise stable isotope ratio variations in oyster tissues, faeces and pseudo-faeces. Cadmium concentra-tions were determined precisely from modified isotope ratios by isotope dilution calculation adapted to the experimental setup
Fig. 3. Stable Cd isotopes ratio variations (110Cd/114Cd and112Cd/114Cd) in faeces (full area) and pseudo-faeces (area with horizontal lines) over experiment from Controls units
(black area), SeaWater units (dark grey area), Algae units (light grey area) and SeaWater/Algae units (white area). N.D.: not determined.
Fig. 4. Bio-accumulated Cd (mg g—1dw, mean 7 SEM (standard errors of means), n ¼ 3) in gills (a), digestive glands (b) and rests of bodies (c) over experiment from Controls
units (black area), seawater units (dark grey area), algae units (light grey area) and seawater/algae units (white area). Concentrations were measured by ICP-MS and corrected for112Cd isotopes measured in seawater in SW and SWA units. Letters indicate significant differences between mean values (p o 0.01, ANOVA LSD test).
(Eq. (2)). The obtained results clearly suggest that the method is well-adapted and that the response obtained is much more sensitive than what would be needed at this exposure level which is only 10 times higher than that in real coastal environ-ments (e.g. Gironde Estuary; (Dabrin et al., 2009). Accordingly, we suggest that the method would be sufficiently sensitive and reliable for lower contamination levels and/or exposure time, comparable to those in previous papers on single stable isotope experiments dealing with direct or trophic contamination of freshwater organ-isms (Croteau and Luoma, 2007, 2009). One major advantage of simultaneously tracing direct and trophic contamination pathways with two stable isotopes is the possibility of closely following and distinguishing metal pathways and redistribution in different tissues under exactly the same experimental conditions. The tracing technique also enabled us to detect unexpected effects, such as the fact that 112Cd exclusively spiked in the algae also
appeared as dissolved metal in seawater of experimental treat-ments designed to monitor both trophic contamination alone and concomitant direct and trophic contamination. Previous work on
T. weissflogii Cd contamination showed that 25–30% of the metal
was cell-surface-adsorbed at this contamination level (using hydroxyquiniline-5-sulphonate; Miao and Wang, 2006). The resulting potential transfer of112Cd from algae to seawater in A
and SWA treatments would be expected to induce additional direct
112Cd contamination of oyster tissues, which has been corrected
using Eq. (7).
4.2. Direct contamination pathway
Cadmium bio-accumulation in oyster tissues was more impor-tant and faster via the direct than the trophic pathway which is consistent with previous work applying different experimental conditions (Ettajani et al., 2001; Boisson et al., 2003). Kinetics of direct Cd contamination differed between tissues with accumulation being more efficient and faster in gills than in digestive glands and the rest of the tissues (see Section 3.4.). Tracing direct contamination (110Cd in excess) in digestive glands
and the rest of the tissues after 7 days of exposure was quite unexpected. In fact, these organs and tissues are not considered closely related to mechanisms involved in direct contamination. Accordingly,110Cd/114Cd ratios in digestive glands and the rest of
the tissues were attributed to metal redistribution by blood from the most exposed organs (gills) to less affected tissues (digestive
glands and the rest of the tissues), as observed in other marine organisms (e.g. eel,Pierron et al., 2008)).
Despite important Cd bio-accumulation, metallothionein con-centrations (MT) in gills and digestive glands from oysters contaminated by direct contamination did not increase throughout the experiment (Fig. 5), suggesting that the initially present MT concentrations were sufficient to initiate detoxification processes and decontamination. We remind that oysters were coming from an uncontaminated farming area and were not exposed to high Cd level before the experiment. This result is clearly different from those of previous accumulation studies where metallothionein production occurred (Ettajani et al., 2001; Marie et al., 2006a, 2006b). This is probably due to the fact that these studies were conducted at concentration levels of ~ 20
m
g L—1, which is ~10-fold higher than concentration levels in the present study and ~ 100-fold higher than maximum values in the Gironde Estuary (Dabrin et al., 2009),.
Cadmium accumulation via the direct pathway was traced in faeces (F) and pseudo-faeces (PF) by significant110Cd/114Cd ratio
variations (Fig. 3). Since PF and F were immediately removed from the experimental treatment to avoid isotope equilibration with seawater, we assume that110Cd was transported via blood from
gills to PF and from digestive glands to F. These assumptions are in accordance with increasing isotope ratios measured from T3 to T10, and with a stronger shift in PF than in F, probably reflecting higher
110Cd levels accumulated in gills than in digestive glands (Fig. 3).
Thus, excretion with PF and F can be considered as one pathway of Cd elimination from gills and digestive glands. However, under the experimental conditions we could not quantify Cd excretion, due to the low recoveries of FandPF.
4.3. Trophic contamination in oysters
Tracing trophic contamination showed112Cd bio-accumulation
in digestive glands, gills and in the rest of the oysters after 14 days of exposure (Fig. 4). Detecting trophic contamination in gills and the rest of the tissues was quite unexpected (Nassiri, 1995) and was attributed to Cd redistribution between organs by internal mechanisms, as already discussed for direct contamination. Oysters were dissected at least 24 h after feeding to avoid algae from remaining in the gills. Although one cannot exclude that Cd weakly bound to algae as remaining cell-adsorbed Cd (Miao and Wang, 2006) could be adsorbed on gill membranes, Cd desorption by seawater in A and SWA treatments (see discussion above) would
Fig. 5. Metallothioneins concentrations (nmol sites Hg—1ww, mean 7 SEM, n ¼ 3) in gills (a) and digestive glands (b) 21 days after exposure from Controls units (black area),
Seawater units (dark grey area), Algae units (light grey area) and seawater/algae units (white area). Letters indicate significant differences between mean values (p o 0.01, ANOVA LSD test).
be expected to represent the major desorbable fraction and has been corrected (Eq. (7)). Kinetics of bio-accumulation in digestive glands were lower for trophic than for direct pathways. From the start of the experiment to 7 days of exposure, we measured at the same time an increasing112Cd/114Cd ratio in F (T3;Fig. 3) and an
unchanged 112Cd/114Cd ratio in digestive glands (T7; Fig. 2).
Furthermore, at this exposure level, Cd in T. weissflogii algae is expected to consist of ~30% soluble Cd, ~ 45% insoluble Cd and ~25% adsorbed Cd (Miao and Wang, 2006). This may suggest Cd elimination via excretion rather than adsorption/absorption by stomach and gut membranes (Fisher et al., 1996). From T7 to T14, the112Cd/114Cd ratio in digestive glands increased (Fig. 2), whereas
it remained constant in F (Fig. 3), suggesting the concomitance of both Cd absorption by membranes and Cd elimination. Finally, from T14 to T21, the 112Cd accumulated in digestive glands
increased considerably (Fig. 4), suggesting more efficient Cd absorption by membranes. Metallothionein concentrations in the digestive gland remained constant over time (Fig. 5), indicating that no metallothionein-based decontamination mechanisms were induced in response to the exposure level within three weeks. The trophic uptake proportion of Cd in oysters was estimated at 1% during the experiment. We determined this uptake rate by estimating the accumulated112Cd in whole oyster tissues, which
is the amount of112Cd in accumulated oysters from algae minus
that in oysters from Control treatments, divided by the supplied enriched112Cd algae. Previous studies have shown that trophic
transfer of Cd in oysters depends on algae species and exposure level (Nassiri, 1995; Ettajani et al., 2001). In fact, at the 20
m
g L—1Cdexposure level the trophic transfer to oysters was ~ 9% for
Skeletonema costatum and ~ 20% for Tetraselmis suecica, whereas
at the extremely high level of 200
m
g L—1 it was ~5% for bothspecies. Thus, by comparing studies, we can conclude that trophic Cd transfer in oysters mainly depends on algae species and that the exposure level appeared to be less significant which is consistent with trophic transfer studies conducted on mussel contamination (Wang and Fisher, 1996; Reinfelder et al., 1997; Arifin and Bendell-Young, 2000).
4.4. Simultaneous direct and trophic contamination in oysters
One of the most promising characteristics of stable isotope spike experiments is the possibility of independently tracing simulta-neous direct and trophic contamination (see SWA treatments,
assuming non-interaction between the two uptake routes of exposure). Isotope ratios and bio-accumulation kinetics observed for oysters exposed to both enriched seawater and algae were similar to those observed for direct-only or trophic-only exposure (Figs. 2 and 5). Plotting the direct contamination [110Cd] over the
trophic contamination [112Cd] measured in digestive glands from
oysters from all experimental treatments highlights the role of different contamination pathways over time, clearly showing different trophic and direct contamination kinetics (Fig. 6). Furthermore, the ‘SWA treatments’ distribution was equivalent to the sum of Cd accumulated separately via the two pathways (Fig. 6a), even at the beginning of the experiment at low Cd accumulation (Fig. 6b). These results may suggest (i) that internal metal redistribution mechanisms were similar, when oysters were contaminated via one or both pathways and (ii) the absence of positive or negative feedback between the different contamination pathways under the present experimental conditions. Interestingly, metallothionein levels in gills and digestive glands were again constant at the end of the experiment, even for the highest level of accumulated Cd (Fig. 5). 5. Conclusions
Multiple stable isotope spike experiments are a reliable and efficient tool for simultaneously tracing contamination pathways in marine organisms under realistic experimental conditions. The respective contributions of direct and trophic contamination in gills, digestive glands, and in the rest of the bodies were clearly identified, showing that under the experimental conditions, gills and digestive glands were mainly contaminated by direct expo-sure. Accumulation kinetics in the juvenile oyster tissues changed over time, leading to relatively high Cd accumulation and redis-tribution between tissues. Constant metallothionein concentra-tions along the experiment suggest that the initially present metallothionein levels in the oysters were sufficient to deal with the experimental Cd exposition. To conclude, tracing contamina-tion pathways by multiple stable isotope spikes was successful for Cd in oysters and can be transposed to other marine organisms for trace metals with at least three stable isotopes that may be measured in seawater. In perspective, the sensitive responses obtained at the concentration levels used in this work clearly suggest that the present method is suitable at even lower (i.e. environmental) concentration levels in seawater.
Fig. 6. (a) Mean [110Cd] concentration (direct contamination) over mean [112Cd] concentration (trophic contamination) measured in digestive glands of oysters from Control,
SeaWater unit, Algae units and SeaWater/Algae units after 7, 14 and 21 days of experiment. (b) Zoom of (a). The grey area represents the natural variation content of [110Cd] and
Acknowledgments
The authors thank Ce´cile Bossy and Re´gine Maury-Brachet for their advice during metal isotope analysis and GF-AAS measure-ments, respectively, and Catherine Pham for her English revising Funding was provided by the INSU EC2CO CYTRIX VOTR’TRAM Project, Project ‘Region Aquitaine RRLA’ and a grant from the French Ministry of Research.
References
Arifin, Z., Bendell-Young, L.I., 2000. Influence of a selective feeding behaviour by the blue mussel Mytilus trossulus on the assimilation of109Cd from environmentally
relevant seston matrices. Mar. Ecol. Prog. Ser. 192, 181–193.
Audry, S., Blanc, G., Scha¨fer, J.,Guerin, F., Masson, M., Robert, S., 2007. Budgets of Mn, Cd and Cu in the macrotidal Gironde Estuary (SW France). Marine Chemistry 107, 433–448.
Baudrimont, M., Scha¨fer, J.,Marie, V., Maury-Brachet, R., Bossy, C., Boudou, A., Blanc, G., 2005. Geochemical survey and metal bioaccumulation of three bivalve species (Crassostrea gigas, Cerastoderma edule and Ruditapes philippinarum) in the Nord Me´ doc salt marshes (Gironde estuary, France). Sci. Total Environ. 337, 265–280.
Bendell, L.I., Feng, C., 2009. Spatial and temporal variations in cadmium concentra-tions and burdens in the Pacific oyster (Crassostrea gigas) sampled from the Pacific north-west. Mar. Pollut. Bull. 58, 1137–1143.
Boisson, F., Goudard, F., Durand, J.P., Barbot, C., Pieri, J., Amiard, J.C., Fowler, S.W., 2003. Comparative radiotracer study of cadmium uptake, storage, detoxification and depuration in the oyster Crassostrea gigas: potential adaptive mechanisms. Mar. Ecol. Prog. Ser. 254, 177–186.
Boutier, B., Chiffoleau, J.,Jouanneau, J.,Latouche, C., Phillips, I., 1989. Lacontamina-tion de la Gironde par le cadmium: origine, extension, importance. Scientific and Technical Report, Ifremer no. 14.
Bragigand, V., Berthet, B., Amiard, J.C., Rainbow, P.S., 2004. Estimates of trace metal bioavailability to humans ingesting contaminated oysters. Food Chem. Tox. 42, 1893–1902.
Brinza, L., Nyga˚ rd, C.A., Dring, M.J., Gavrilescu, M., Benning, L.G., 2009. Cadmium tolerance and adsorption by the marine brown alga Fucus vesiculosus from the Irish Sea and the Bothnian Sea. Bioresour. Technol. 100, 1727–1733. Cheng, W.W.L., Gobas, F.A.P.C., 2007. Assessment of human health risks of
consumption of cadmium contaminated cultured oysters. Human Ecol. Risk Assess. 13, 370–382.
Christie, J.C., Bendell, L.I., 2009. Sources of dietary cadmium to the Pacific oyster
Crassostrea gigas. Mar. Environ. Res. 68, 97–105.
Copes, R., Clark, N.A., Rideout, K., Palaty, J., Teschke, K., 2008. Uptake of cadmium from Pacific oysters (Crassostrea gigas) in British Columbia oyster growers. Environ. Res. 107, 160–169.
Croteau, M.N., Luoma, S.N., 2007. Characterizing dissolved Cu and Cd uptake in terms of the biotic ligand and biodynamics using enriched stable isotopes. Environ. Sci. Technol. 41, 3140–3145.
Croteau, M.N., Luoma, S.N., 2009. Predicting dietborne metal toxicity from metal influxes. Environ. Sci. Technol. 43, 4915–4921.
Croteau, M.N., Luoma, S.N., Pellet, B., 2007. Determining metal assimilation efficiency in aquatic invertebrates using enriched stable metal isotope tracers. Aquat. Toxicol. 83, 116–125.
Croteau, M.N., Luoma, S.N., Topping, B.R., Lopez, C.B., 2004. Stable metal isotopes reveal copper accumulation and loss dynamics in the freshwater bivalve
Corbicula. Environ. Sci. Technol. 38, 5002–5009.
Dabrin, A., Scha¨ fer, J., Blanc, G., Strady, E., Masson, M., Bossy, C., Castelle, S., Girardot, N., Coynel, A., 2009. Improving estuarine net flux estimates for dissolved cadmium export at the annual timescale: application to the Gironde Estuary. Estuarine Coastal Shelf Sci. 84, 429–439.
Danielsson, L.G., Magnusson, B., Westerlund, S., Zhang, K., 1982. Trace metal determinations in estuarine waters by electrothermal atomic absorption spectrometry after extraction of dithiocarbamate complexes into freon. Anal. Chim. Acta 144, 183–188.
Dupuy, C., Vaquer, A., Lam-Hoai, T., Rougier, C., Mazouni, N., Lautier, J., Collos, Y., Le Gall, S., 2000. Feeding rate of the oyster Crassostrea gigas in a natural planktonic
community of the Mediterranean Thau Lagoon. Mar. Ecol. Prog. Ser. 205, 171– 184.
Ettajani, H., Berthet, B., Amiard, J.C., Chevolot, L., 2001. Determination of cadmium partitioning in microalgae and oysters: contribution to the assessment of trophic transfer. Arch. Environ. Contam. Toxicol. 40, 209–221.
Fisher, N.S., Teyssie´ , J.L., Fowler, S.W., Wang, W.X., 1996. Accumulation and retention of metals in mussels from food and water: a comparison under field and laboratory conditions. Environ. Sci. Technol. 30, 3232–3242.
Jouanneau, J.M., Boutier, B., Chiffoleau, J.F., Latouche, C., Philipps, I., 1990. Cadmium in the Gironde fluvioestuarine system: behaviour and flow. Sci. Total Environ. 97–98, 465–479.
Komjarova, I., Blust, R., 2008. Multi-metal interactions between Cd, Cu, Ni, Pb and Zn in water flea Daphnia magna, a stable isotope experiment. Aquat. Toxicol. 90, 138–144.
Lapaquellerie, Y., Jouanneau, J.M., Maillet, N., Latouche, C., 1995. Cadmium pollution in sediments of the Lot river (France), estimate of the mass of cadmium. Pollution en Cd dans les se´diments du Lot (France) et calcul du stock de polluant. Environ. Technol. 16, 1145–1154.
Lekhi, P., Cassis, D., Pearce, C.M., Ebell, N., Maldonado, M.T., Orians, K.J., 2008. Role of dissolved and particulate cadmium in the accumulation of cadmium in cultured oysters (Crassostrea gigas). Sci. Total Environ. 393, 309–325. Malet, N., Sauriau, P.G., Ryckaert, M., Malestroit, P., Guillou, G., 2008. Dynamics and
sources of suspended particulate organic matter in the Marennes-Ole´ron oyster farming bay: insights from stable isotopes and microalgae ecology. Estuarine Coastal Shelf Sci. 78, 576–586.
Marie, V., 2005. Etude de la re´ponse des me´tallothione´ ines chez les bivalves,
Corbicula fluminea, Dreissenapolymorpha et Crassostrea gigas, apre`sexposition au
cadmium et au zinc. Approches in situ et expe´ rimentales. Ph.D. Thesis, Universite´ Bordeaux1, p. 461.
Marie, V., Gonzalez, P., Baudrimont, M., Bourdineaud, J.P., Boudou, A., 2006a. Metallothionein response to cadmium and zinc exposures compared in two freshwater bivalves, Dreissena polymorpha and Corbicula fluminea. BioMetals 19, 399–407.
Marie, V., Gonzalez, P., Baudrimont, M., Boutet, I., Moraga, D., Bourdineaud, J.P., Boudou, A., 2006b. Metallothionein gene expression and protein levels in triploid and diploid oysters Crassostrea gigas after exposure to cadmium and zinc. Environ. Toxicol. Chem. 25, 412–418.
Miao, A.J.,Wang, W.X., 2006. Cadmium toxicity to two marine phytoplankton under different nutrient conditions. Aquat. Toxicol. 78, 114–126.
Nadella, S.R., Fitzpatrick, J.L., Franklin, N., Bucking, C., Smith, S., Wood, C.M., 2009. Toxicity of dissolved Cu, Zn, Ni and Cd to developing embryos of the blue mussel (Mytilus trossolus) and the protective effect of dissolved organic carbon. Comp. Biochem. Physiol. Toxicol. Pharmacol. 149, 340–348.
Nassiri, Y., 1995. Approche par microscopie e´lectronique a`transmission analytique des me´ canismes de toxicite´ et de bio-accumulation du cadmium et du cuivre chez Skeletonema costatum, Tetraselmis suecica, Crassostrea gigas. Ph.D. Thesis, Universite´ de Nantes.
Ng, T.Y.T., Chuang, C.Y., Stupakoff, I., Christy, A.E., Cheney, D.P., Wang, W.X., 2010. Cadmium accumulation and loss in the Pacific oyster Crassostrea gigas along the west coast of the USA. Mar. Ecol. Progr. Ser. 401, 147–160.
Pierron, F., Baudrimont, M., Lucia, M., Durrieu, G., Massabuau, J.C., Elie, P., 2008. Cadmium uptake by the European eel: trophic transfer in field and experimental investigations. Ecotoxicol. Environ. Saf. 70, 10–19.
Reinfelder, J.R., Wang, W.X., Luoma, S.N., Fisher, N.S., 1997. Assimilation efficiencies and turnover rates of trace elements in marine bivalves: a comparison of oysters, clams and mussels. Mar. Biol. 129, 443–452.
Saratug, S., Garrett, S.H., Sens, M.A., Sens, D.A., 2010. Cadmium, environ- mental exposure and health outcomes. Environ. Health Perspect. 118, 182–199. Strady, E., Blanc, G., Scha¨ fer, J., Coynel, A., Dabrin, A., 2009. Dissolved uranium,
vanadium and molybdenum behaviours during contrasting freshwater dis-charges in the Gironde Estuary (SW France). Estuarine Coastal Shelf Sci. 83, 550–560.
Wang, W.X., Fisher, N.S., 1996. Assimilation of trace elements and carbon by the mussel Mytilus edulis: effects of food composition. Limnol. Oceanogr. 41, 197– 207.
Widmeyer, J.R., Bendell-Young, L.I., 2008. Heavy metal levels in suspended sedi-ments, Crassostrea gigas, and the risk to humans. Arch. Environ. Contam. Toxicol. 55, 442–450.
![Fig. 1. Experimental procedure. The [ 110 Cd] and [ 112 Cd] values represent the mean [ 110 Cd] and [ 112 Cd] measured in seawater units over the 21 days of experiment](https://thumb-eu.123doks.com/thumbv2/123doknet/14773841.592646/3.892.469.843.120.311/experimental-procedure-values-represent-measured-seawater-units-experiment.webp)
![Fig. 6. (a) Mean [ 110 Cd] concentration (direct contamination) over mean [ 112 Cd] concentration (trophic contamination) measured in digestive glands of oysters from Control, SeaWater unit, Algae units and SeaWater/Algae units after 7, 14 and 21 days of e](https://thumb-eu.123doks.com/thumbv2/123doknet/14773841.592646/7.892.196.714.121.402/concentration-contamination-concentration-contamination-measured-digestive-seawater-seawater.webp)
