HAL Id: hal-00301686
https://hal.archives-ouvertes.fr/hal-00301686
Submitted on 9 Aug 2005HAL is a multi-disciplinary open access
archive for the deposit and dissemination of sci-entific research documents, whether they are pub-lished or not. The documents may come from teaching and research institutions in France or abroad, or from public or private research centers.
L’archive ouverte pluridisciplinaire HAL, est destinée au dépôt et à la diffusion de documents scientifiques de niveau recherche, publiés ou non, émanant des établissements d’enseignement et de recherche français ou étrangers, des laboratoires publics ou privés.
Characterization of the organic composition of aerosols
from Rondônia, Brazil, during the LBA-SMOCC 2002
experiment and its representation through model
compounds
S. Decesari, S. Fuzzi, M. C. Facchini, M. Mircea, L. Emblico, F. Cavalli, W.
Maenhaut, X. Chi, G. Schkolnik, A. Falkovich, et al.
To cite this version:
S. Decesari, S. Fuzzi, M. C. Facchini, M. Mircea, L. Emblico, et al.. Characterization of the organic composition of aerosols from Rondônia, Brazil, during the LBA-SMOCC 2002 experiment and its representation through model compounds. Atmospheric Chemistry and Physics Discussions, European Geosciences Union, 2005, 5 (4), pp.5687-5749. �hal-00301686�
ACPD
5, 5687–5749, 2005 Aerosol organic composition during the SMOCC experiment S. Decesari et al. Title Page Abstract Introduction Conclusions References Tables Figures J I J I Back CloseFull Screen / Esc
Print Version Interactive Discussion
EGU
Atmos. Chem. Phys. Discuss., 5, 5687–5749, 2005 www.atmos-chem-phys.org/acpd/5/5687/
SRef-ID: 1680-7375/acpd/2005-5-5687 European Geosciences Union
Atmospheric Chemistry and Physics Discussions
Characterization of the organic
composition of aerosols from Rond ˆ
onia,
Brazil, during the LBA-SMOCC 2002
experiment and its representation
through model compounds
S. Decesari1, S. Fuzzi1, M. C. Facchini1, M. Mircea1, L. Emblico1, F. Cavalli1, W. Maenhaut2, X. Chi2, G. Schkolnik3, A. Falkovich3, Y. Rudich3, M. Claeys4, V. Pashynska4, G. Vas4, I. Kourtchev4, R. Vermeylen4, A. Hoffer5, M. O. Andreae5, E. Tagliavini6,7, F. Moretti6, and P. Artaxo8
1
Istituto Scienze dell’Atmosfera e del Clima - C.N.R., Bologna, Italy
2
Department of Analytical Chemistry, Institute for Nuclear Sciences, Ghent University, Gent, Belgium
3
Department of Environmental Sciences, Weizmann Institute, Rehovot, Israel
4
Department of Pharmaceutical Sciences, University of Antwerp, Antwerp, Belgium © 2005 Author(s). This work is licensed under a Creative Commons License.
ACPD
5, 5687–5749, 2005 Aerosol organic composition during the SMOCC experiment S. Decesari et al. Title Page Abstract Introduction Conclusions References Tables Figures J I J I Back CloseFull Screen / Esc
Print Version Interactive Discussion
5
Biogeochemistry Department, Max Planck Institute for Chemistry, Mainz, Germany
6
Dipartimento di Chimica “G. Ciamician”, Universit `a di Bologna, Bologna, Italy
7
Centro di Ricerche per le Scienze Ambientali, Universit `a di Bologna, Ravenna, Italy
8
Instituto de Fisica, Universidade de Sao Paulo, Sao Paulo, SP, Brazil Received 2 May 2005 – Accepted 24 June 2005 – Published: 9 August 2005 Correspondence to: S. Decesari (s.decesari@isac.cnr.it)
ACPD
5, 5687–5749, 2005 Aerosol organic composition during the SMOCC experiment S. Decesari et al. Title Page Abstract Introduction Conclusions References Tables Figures J I J I Back CloseFull Screen / Esc
Print Version Interactive Discussion
EGU Abstract
The chemical composition of carbonaceous aerosols collected during the LBA-SMOCC field experiment, conducted in Rond ˆonia, Brazil, in 2002 during the transition from the dry to the wet season, was investigated by a suite of advanced analytical techniques. The period of most intense biomass burning was characterized by high
concentra-5
tions of submicron particles rich in carbonaceous material and water-soluble organic compounds (WSOC). At the onset of the rainy period, submicron total carbon (TC) concentrations had decreased by about 20 times. In contrast, the concentration of supermicron TC was fairly constant throughout the experiment, pointing to a constant emission of coarse particles from the natural background. About 6–8% of TC (9–11%
10
of WSOC) was speciated at the molecular level by GC-MS and liquid chromatography. Poly-hydroxylated compounds, aliphatic and aromatic acids were the main classes of compounds accounted for by individual compound analysis. Functional group anysis by proton NMR and chromatographic separation on ion-exchange columns al-lowed characterization of ca. 50–90% of WSOC into broad chemical classes (neutral
15
species/light acids/humic-like substances). In spite of the significant change in the chemical composition of tracer compounds from the dry to the wet period, the func-tional groups and the general chemical classes of WSOC changed only to a lesser extent. Model compounds representing size-resolved WSOC chemical composition for the different periods of the campaign are then proposed in this paper, based on the
20
chemical characterization by both individual compound analysis and functional group analysis deployed during the LBA-SMOCC experiment. Model compounds reproduce quantitatively the average chemical structure of WSOC and can be used as best-guess surrogates in microphysical models involving organic aerosol particles over tropical ar-eas affected by biomass burning.
ACPD
5, 5687–5749, 2005 Aerosol organic composition during the SMOCC experiment S. Decesari et al. Title Page Abstract Introduction Conclusions References Tables Figures J I J I Back CloseFull Screen / Esc
Print Version Interactive Discussion
1. Introduction
The Large Scale Biosphere-Atmosphere Experiment in Amazonia-Smoke, Aerosols, Clouds, Rainfall and Climate (LBA-SMOCC) experiment was conducted in the Amazon Basin in the period Sept.–mid-Nov. 2002, with the principal purpose of investigating how and to what extent aerosol particles produced by biomass burning alter cloud
5
formation. Previous studies have highlighted that smoke particles emitted by biomass burning are enriched in organic carbon (OC) and also contain a variable amount of elemental carbon (EC), operationally defined as the fraction of carbon that is refractory at high temperature in an inert atmosphere (Chow et al., 2001; Mayol-Bracero et al., 2002a, b). Elemental carbon is often used as a synonym for “soot carbon” defined
10
by IPCC(2001) as “Particles formed during the quenching of gases at the outer edge of flames of organic vapors, consisting predominantly of carbon, with lesser amounts of oxygen and hydrogen present as carboxyl and phenolic groups and exhibiting an imperfect graphitic structure”.
Although carbonaceous aerosols are less hygroscopic than particles consisting of
15
sulfate or sodium chloride, the polar organic compounds known to occur in biomass burning aerosol may absorb water from the gas phase, thus enhancing the ability to nucleate cloud droplets (“CCN ability”) of the particles (Svenningsson et al., 2005). The organic compounds that have an affinity to water are generally isolated by extracting aerosol samples with water and measuring their total carbon concentration
20
by liquid total organic carbon (TOC) analysis. These water-soluble organic compounds (WSOC) constitute a variable fraction of the aerosol TC. They can be internally or externally mixed with other aerosol constituents (e.g., inorganic soluble and insoluble components) and, most importantly, they contain a wide range of chemical species that are expected to show very different water solubilities (Mochida and Kawamura,
25
2004). All these factors are of primary importance in determining the CCN ability of biomass burning particles.
ACPD
5, 5687–5749, 2005 Aerosol organic composition during the SMOCC experiment S. Decesari et al. Title Page Abstract Introduction Conclusions References Tables Figures J I J I Back CloseFull Screen / Esc
Print Version Interactive Discussion
EGU
In order to evaluate the net effect of carbonaceous particles from biomass burning on the formation of clouds, it is indicated to compare their characteristics with those formed during unpolluted episodes in the same region. The SMOCC aircraft cam-paign revealed that forested areas distant from the biomass burning sources show a background of CCN with low concentrations and a rather constant vertical profile in
5
the troposphere (Andreae et al., 2004). Previous studies highlighted the occurrence of natural sources of aerosol particles from the biota in the same area (Graham et al., 2003). The processes responsible for particle formation in the Amazon basin – biomass burning and biogenic emission – are geographically distinct and follow very different temporal trends. In particular, the dramatic increase in the aerosol load
ob-10
served during the dry period in the rural areas of Rond ˆonia and Mato Grosso can be mainly attributed to biomass burning. In the same period, biomass burning products strongly impact the TC concentrations and composition in the neighboring forested ar-eas. Biogenic organic aerosols have mainly been characterized at forest sites located in a large distance from the main pollution sources (Kub ´atov ´a et al., 2000; Graham et
15
al., 2003; Claeys et al., 2004a). However, primary biological particles (e.g., pollen and fungal spores) were found to increase also in rural areas at the end of the dry period, when the increase in precipitation impedes extensive burning activities (Graham et al., 2002).
The chemical composition of carbonaceous particles produced by biomass burning
20
in Rond ˆonia was characterized during the 1999 LBA-EUSTACH-2 campaign (Mayol-Bracero et al., 2002a). It was found that WSOC account for 45–75% of TC and that a substantial fraction of the thermally refractory carbon determined by evolved gas anal-ysis (EGA) analanal-ysis is also water-soluble. This soluble refractory carbonaceous mate-rial was linked to complex polycarboxylic acids, which are denoted by the generic term
25
“HULIS” (humic-like substances) and were determined by analysis of water extracts. Another important fraction of WSOC was identified as neutral compounds mainly con-sisting of sugar-like compounds such as levoglucosan, which is the most abundant product of the pyrolysis of cellulose at temperatures higher than 300◦C (Shafizadeh,
ACPD
5, 5687–5749, 2005 Aerosol organic composition during the SMOCC experiment S. Decesari et al. Title Page Abstract Introduction Conclusions References Tables Figures J I J I Back CloseFull Screen / Esc
Print Version Interactive Discussion
1984).
Except for levoglucosan, linking the organic composition of the aerosol to the chemi-cal reactions occurring during the complex and varying combustion processes remains an issue. The relatively low concentrations of sugars in biomass burning smoke, com-pared to the abundance of their degradation products, likely results from the fact that
5
biomolecules undergo pronounced chemical transformations, even at relatively low temperatures (<200◦C), owing to heterogeneous reactions with oxygen and reactions between amines and sugars (Moens et al., 2004). Combustion studies on Grami-naceae (Knicker et al., 1996) have shown that at 350◦C cellulose and hemicelluloses are completely degraded to volatile products (with levoglucosan as a major compound)
10
in a time span of 1 min. The remaining char products contain mainly complex aliphatic compounds and newly formed aromatic compounds, and have a very low content of oxygenated substances. The composition of these char residues is completely dif-ferent from that of biomass burning aerosol which instead shows a large fraction of oxygenated compounds (Graham et al., 2002). The oxygenated compounds may form
15
during the low-temperature stages of combustion. In addition, a substantial fraction of compounds volatilized at the high temperatures of the combustion process may con-dense onto particles, when the smoke plume cools down. Finally, the photochemical production of newly formed condensable compounds within the plume and in the re-gional haze will increase the fraction of oxygenated species relative to soot (Gao et al.,
20
2003; Reid et al., 2004). Therefore, there are a number of processes that are respon-sible for the high content of oxygenated water-soluble organic compounds in biomass burning particles, ranging from combustion itself, through the early aging stages to ac-tual in-situ secondary processes. Chemical transformation within the aerosol particles, e.g., polymerization of low-molecular weight compounds, is not a likely mechanism for
25
altering significantly the oxygen to carbon ratio of the organic matter. However, it may alter its solubility through the modification of functional groups of specific classes of compounds, for example, benzoic acids may be converted to high-molecular weight
ACPD
5, 5687–5749, 2005 Aerosol organic composition during the SMOCC experiment S. Decesari et al. Title Page Abstract Introduction Conclusions References Tables Figures J I J I Back CloseFull Screen / Esc
Print Version Interactive Discussion
EGU
aromatic acids (Hoffer et al., submitted, 20051) and unsaturated acids may be further oxidized to dihydroxy acid derivatives (Claeys et al., 2004b).
The biogenic sources of organic aerosols are still only partly understood and cover a wide range of different sources and source processes. The identification of biomolecules (mainly sugars and lipids) in the coarse fraction of aerosols collected at
5
forest sites has highlighted the importance of the direct emission of primary biological particles, like spores, pollen, plant debris, soil detritus and insect body parts, to the atmosphere (Graham et al., 2003; Simoneit et al., 2004). Recently, another source process has been characterized for the formation of secondary organic aerosols, i.e., photo-oxidation of isoprene which is emitted in large amounts by the tropical forest
10
vegetation (Claeys et al., 2004a; Wang et al., 2005).
Biomass burning and biogenic sources show a very different seasonal dependence. In a simplified scheme since the Amazon forest ecosystem is productive throughout the year, while biomass burning mainly occurs in the dry period, the latter gives rise to episodes of very high aerosol loads, which are superimposed on a relatively
con-15
stant natural background of primary biological particles and photo-oxidation products of biogenic volatile organic compounds (secondary organic aerosol). Consequently, the atmospheric concentrations of biomass burning aerosols, along with their compo-sition, will vary according to the strength and type of the combustion sources, as well as the ambient conditions, with strong diel and day-to-day variations (Falkovich et al.,
20
2005; Schkolnik et al., 2005; Fuzzi et al., to be submitted, 20052). The aim of this
1
Hoffer, A., Gelencs´er, A., Blazs´o, M., Guyon, P., Artaxo, P., and Andreae, M. O.: Chem-ical transformation in organic aerosol from biomass burning, Atmos. Chem. Phys. Discuss, submitted, 2005.
2
Fuzzi, S., Decesari, S., Facchini, M. C., Cavalli, F., Emblico, L., Mircea, M., Andreae, M. O., Trebs, I., Hoffer, A., Guyon, P., Artaxo, P., Rizzo, L.V., Lara, L. L., Pauliquevis, T., Maenhaut, W., Raes, N., Chi, X., Mayol-Bracero, O. L., Soto, L., Claeys, M., Kourtchev, I., Rissler, J., Swietlicki, E., Tagliavini, E., Schkolnik, G., Falkovich, A. H., Rudich, Y., Fisch G., and Gatti, L. V.: Overview of the inorganic and organic composition of size-segregated aerosol in Rond ˆonia,
ACPD
5, 5687–5749, 2005 Aerosol organic composition during the SMOCC experiment S. Decesari et al. Title Page Abstract Introduction Conclusions References Tables Figures J I J I Back CloseFull Screen / Esc
Print Version Interactive Discussion
study is to trace the changes in the organic aerosol composition during the transition from the biomass burning period to the rainy period, with particular focus on WSOC. A combination of state-of-the-art techniques for speciation of polar organic compounds has been exploited for the chemical characterization, together with functional group analysis by1HNMR. The results and implications of some specific analytical methods
5
have been published in separate papers (Falkovich et al., 2005; Schkolnik et al., 2005). Here, they are included to provide comprehensive compositions for the main periods of the LBA-SMOCC field campaign. In past studies on tropical areas affected by biomass burning, only limited analyses (e.g., ion chromatography or GC-MS) on selected sam-ples have been performed, providing sets of measurements that are difficult to
inter-10
compare (Reid et al., 2004). Here, we provide what is probably the most complete set of analyses of biomass burning aerosols, for a full assessment of the organic chemical composition. Finally, we propose a model representation of the water-soluble fraction of OC, derived from both individual compounds and functional group composition for the different periods of the campaign. These model compositions should be useful in
15
microphysical models of aerosol hygroscopic growth, as well as in laboratory studies for the determination of the hygroscopic behavior of mixed organic/inorganic systems (Svenningsson et al., 2005).
2. Experimental
2.1. Sampling
20
The SMOCC field campaign was conducted at a ground-based station on the Fazenda Nossa Senhora Aparecida (FNS) (10◦4504400S, 62◦2102700W, 315 m a.s.l.), which is lo-cated approximately 8 km southwest of the town Ouro Preto do Oeste in the state of Rond ˆonia, Brazil. The place was deforested by fire about 20 years ago and the area
Brazil, from the biomass burning period to the onset of the wet season, to be submitted to J. Geophys. Res., 2005.
ACPD
5, 5687–5749, 2005 Aerosol organic composition during the SMOCC experiment S. Decesari et al. Title Page Abstract Introduction Conclusions References Tables Figures J I J I Back CloseFull Screen / Esc
Print Version Interactive Discussion
EGU
is now a pasture site with Brachiaria brizantha as a dominant grass species. Sam-pling of aerosol particles was conducted from 9 September to 14 November 2002, by deploying a series of impactors and filter-based techniques. A full description of the sampling platform is provided by Fuzzi et al. (20052). According to meteorological con-ditions, the sampling period was subdivided into dry (intense burning; 11 September to
5
7 October), transition (8 October to 29 October) and wet (30 October to 14 November) periods. With respect to the determination of TC and organic and elemental carbon (OC and EC), and of the organic chemical composition, sampling was conducted by: a) a stacked filter unit (SFU) sampler that separates coarse (10>d >2.0 µm, where d is the aerodynamic diameter) and fine particles (d <2.0 µm) by sequential filtration on 8.0
10
and 0.4 µm pore-size Nuclepore® polycarbonate filters, with a flow rate of 10–15 l/min.; b) three high-volume dichotomous impactors (HVDS) with front and back quartz fiber filters, segregating fine (PM2.5) and coarse (>2.5 µm) particles, operating at a flow rate of ca. 300 l/min; c) two microorifice uniform deposit impactor (MOUDI) devices, one (from Institute of Physics of the University of Sao Paulo (IFUSP)) with Nuclepore®
15
polycarbonate filters as impaction foils, the other (from Ghent University (UGent)) with aluminum foils on the impaction stages; d) a 5-stage Berner impactor with aluminum and Tedlar foils on the impaction stages. Sampling time varied from 12 h in the dry period (when the highest aerosol concentrations were encountered) to 24 and 48 h at the end of the campaign. Positive artifacts during sampling were either avoided by
us-20
ing inert substrates (polycarbonate, Tedlar, Aluminum) or corrected by the analysis of back-filters (in the case of quartz filters). In contrast, presumably semi-volatile organic compounds (Eatough et al., 2003) could not be efficiently collected by our sampling apparatus.
The comparison of aerosol measurements performed with analogous sampling
sys-25
tems (e.g., HVDS and SFU) indicates that the uncertainties in the flow measurement and potential other minor sampling biases, such as differences in the size cutoff be-tween samples, led to differences of up to 25% in the concentration data reported from the various samplers and groups. Where such biases could be quantified and
correc-ACPD
5, 5687–5749, 2005 Aerosol organic composition during the SMOCC experiment S. Decesari et al. Title Page Abstract Introduction Conclusions References Tables Figures J I J I Back CloseFull Screen / Esc
Print Version Interactive Discussion
tions applied, this is indicated in the text and tables. Otherwise, values are reported as obtained from the species mass measured on the particular samples and the sample volumes determined with the flow meters attached to the individual samplers.
2.2. TC/OC/EC analysis
Ghent University (UGent) analyzed the fine and coarse filter samples (both front
5
and back filters) of two HiVol samplers (HVDS1 and HVDS3) for OC, EC and TC (TC=OC+EC) with a thermal-optical transmission (TOT) technique (Birch and Cary, 1996; Schmid et al., 2001), using a thermal-optical carbon analyzer from Sunset Lab-oratory Inc. (Tigard, OR, USA). The analysis was done in a two-stage procedure; one or two 1.5-cm2rectangular punches of each quartz filter were heated stepwise (up to
10
900◦C) in a non-oxidizing helium (He) atmosphere, and then (again up to 900◦C) in an oxidizing atmosphere of 2% oxygen and 98% He. The carbon that evolves at each temperature is oxidized to carbon dioxide (CO2), and then reduced to methane (CH4) for quantification with a flame ionization detector (FID). The transmittance of light from a He-Ne laser through the filter punches is continuously monitored and used for setting
15
the OC/EC “split” point, thereby correcting for pyrolysis/charring during the first stage of the analysis.
Max Planck Institute for Chemistry (MPIC) measured total carbon (TC) and the el-emental carbon after water extraction (ECw) on HiVol samples (HVDS2) by evolved gas analysis (EGA) (Mayol-Bracero et al., 2002; Hoffer et al., 20051). The combustion
20
was performed in an oxygen atmosphere, the temperature was increased linearly from 50◦C to 780◦C at a rate of 20◦C/min, and the conversion was completed over a MnO2 catalyst at 800◦C. The EC concentration was determined integrating the last peaks of the thermograms obtained after water extraction (Mayol-Bracero et al., 2002).
ACPD
5, 5687–5749, 2005 Aerosol organic composition during the SMOCC experiment S. Decesari et al. Title Page Abstract Introduction Conclusions References Tables Figures J I J I Back CloseFull Screen / Esc
Print Version Interactive Discussion
EGU
2.3. TOC analysis
UGent analyzed the fine (<2.5 µm) filter samples (both front and back filters) from HVDS1 for total organic carbon (TOC). Filter punches of 1 or 1.5 cm2 were placed in a 15 ml tube, 5 or 10 ml Millipore Simplicity water was added, and the tube was hand-shaken during 5 min, after which it was allowed to stand for 30 min. The sample
5
extract was then filtered through a PVDF syringe filter (pore size 0.2 µm) and analyzed for TOC, thereby correcting for the inorganic carbon, with a Shimadzu TOC-V CPH analyzer. The TOC data were used as water-soluble OC.
ISAC subjected a sub-set of coarse HiVol (HVDS3) filter samples, having collected supermicron particles (>2.5 µm), to TOC analysis. Upon extraction of 1/4 of filter with
10
30 ml of deionized water, samples were filtered to remove the filter debris and ana-lyzed by a Shimadzu TOC5000A analyzer. Blank levels were 1 ppm C and 0.25 ppm C, when filtering with hydrophilic cellulose filters and PTFE hydrophobic filters, respec-tively. Only coarse (>2.5 µm) filters from the transition and the wet periods could be analyzed, because of the relatively low interference from fine particles (Graham et al.,
15
2002).
Pre-cleaned Tedlar substrates mounted on a 5-stage Berner impactor were extracted in 6 ml of deionized water in an ultrasonic bath, and analyzed by means of a Shimadzu TOC5000A analyzer. Blank levels were around 0.2 ppm C and a total of 37, 12, 5 size-segregated samples were analyzed for the dry, transition and wet periods, respectively.
20
2.4. GC-MSMP IC
The fine fraction of the aerosols collected by the HVDS2 sampler was analyzed for individual polar compounds by gas chromatography-mass spectrometry (Hewlett Packard 6890 GC-MSD) after derivatization. The method was adapted from Gra-ham et al. (2002). The samples (3.5–5.3 cm2 of the filter) were extracted in
25
4–6 ml of acetonitrile for 1 h, agitated once every 15 min. The extract was then filtered through a 0.45 µm pore size PTFE syringe filter (Pall). An internal
stan-ACPD
5, 5687–5749, 2005 Aerosol organic composition during the SMOCC experiment S. Decesari et al. Title Page Abstract Introduction Conclusions References Tables Figures J I J I Back CloseFull Screen / Esc
Print Version Interactive Discussion
dard (3,3-dimethylglutaric acid) was added to 3 ml of filtered sample solution, which was then brought to dryness under a gentle stream of N2. After this process, 50 µl pyridine and 50 µl bis(trimethylsilyl)trifluoroacetamide (BSTFA), containing 1% trimethylchlorosilane (TMCS) as a catalyst (Supelco), were added to the samples, which were then put into an oven at 70◦C for 30 min. The sample was injected onto
5
a HP5-MS column (30 m × 250 µm × 0.25 µm) equipped with a Supelco guard column (deactivated methylsiloxane, 1 m × 0.32 mm) in a splitless mode at 280◦C. The temper-ature of the oven was held at 65◦C for 10 min and ramped at 10◦C/min to 310◦C and held for 10 min. The detector was operated both in SIM and SCAN mode, and it was calibrated with aliquots of a stock solution of authentic standards. Repeated analysis
10
of the samples showed that the precision of the method was about 20%. 2.5. GC-MSU A
A series of polar organic compounds in aerosol samples, i.e., the front fine filters of the HiVol quartz filter samples (HVDS1) and aluminum foils from the MOUDI col-lections, were quantified using GC-MS techniques that incorporated derivatisation
15
into trimethylsilyl derivatives. Two methods were employed: the first method was targeted to the quantitation of sugar-like compounds (i.e., anhydrosugars (levoglu-cosan, mannosan, galactosan, 1,6-anhydro-β-D-glucofuranose), the 2-methyltetrols (2-methylthreitol, 2-methylerythritol), C5 alkene triol derivatives of isoprene (2-methyl-1,3,4-trihydroxy-1-butene (cis and trans) and 3-methyl-2,3,4-trihydroxy-1-butene), the
20
monosaccharides (fructose, glucose), and the sugar polyols (arabitol, mannitol)), while the second method was targeted to the quantitation of acidic compounds (i.e., hydroxy monocarboxylic acids (glyceric acid, threonic acid+ isomer), dicarboxylic acids (suc-cinic acid, fumaric acid, glutaric acid), hydroxy dicarboxylic acids (malic acid, α-hydroxy glutaric acid, β-hydroxy glutaric acid, tartaric acid) and aromatic acids (hydroxy benzoic
25
acids, vanillic acid, isovanillic acid)).
Method 1: The first method was adapted from one previously described for the determination of levoglucosan in urban aerosols (Pashynska et al., 2002). A part
ACPD
5, 5687–5749, 2005 Aerosol organic composition during the SMOCC experiment S. Decesari et al. Title Page Abstract Introduction Conclusions References Tables Figures J I J I Back CloseFull Screen / Esc
Print Version Interactive Discussion
EGU
of the quartz filter sample (1/16 or 1/32) of the whole filter area was used for ex-traction. Before extraction, the recovery standard, methyl β-L-xylanopyranoside was added. In the case of analysis of aluminum foils, 1/2 or 1/4 of the whole foil was used and the foil was also spiked with a second internal recovery standard, deuter-ated (d3)–malic acid (2,2,3-d3-malic acid; Cambridge Isotope Laboratories, Andover,
5
MA, USA), for measurement of malic acid. Sample workup consisted of extraction with dichloromethane:methanol (4:1, v/v) and trimethylsilylation. GC-MS analysis was per-formed with a TRACE GC2000 gas chromatograph and a Polaris Q ion trap mass spec-trometer equipped with an external electron ionization source (ThermoFinnigan, San Jose, CA, USA) using an electron energy of 70 eV. For data acquisition and
process-10
ing, Xcalibur version 1.2 software was used. The gas chromatograph was equipped with a deactivated silica precolumn (2 m × 0.25 mm i.d.) and a CP Sil 8CB low-bleed capillary column (95% dimethyl-, 5% phenylpolysiloxane, 0.25 mm film thickness, 30 m x 0.25 mm i.d.; Chrompack, Middelburg, The Netherlands). The following temperature program was applied: the initial temperature was 50◦C and kept for 5 min, the
temper-15
ature was then increased to 200◦C at the rate of 3◦C/min and kept at that temperature for a further 2 min and then raised to 310◦C at the rate of 30◦C/min. The total anal-ysis time was 62 min. The GC-MS instrument was operated in the full scan mode in the mass range m/z 45-500, and quantification was based on mass chromatographic data (i.e., extracted ion chromatograms). For derivatisation of standard solutions of all
20
saccharidic compounds, the same procedure was applied. The quantification of the monosaccharide anhydrides (levoglucosan, mannosan, and galactosan), the polyols (erythritol, arabitol, and mannitol), the monosaccharides (fructose and glucose), and the 2-methyltetrols (2-methylthreitol and 2-methylerythritol) was based on an internal standard calibration procedure employing methyl β-L-xylanopyranoside (and d3-malic
25
acid in case of the Al foils) as internal recovery standard and pure reference com-pounds, if available. For assessing the amount of the 2-methyltetrols, 2-methylthreitol and 2-methylerythritol, and the C5alkene triol derivatives of isoprene (Wang et al., sub-mitted, 20052), for which no pure reference compounds were available, the response
ACPD
5, 5687–5749, 2005 Aerosol organic composition during the SMOCC experiment S. Decesari et al. Title Page Abstract Introduction Conclusions References Tables Figures J I J I Back CloseFull Screen / Esc
Print Version Interactive Discussion
factor of erythritol was used. In the case C5alkene triol derivatives of isoprene were ob-served, which are related to 2-methyltetrols, they were lumped with the 2-methyltetrols. Duplicate analyses show that the precision of the determinations was about 10%. All reported concentrations are corrected for procedural blanks.
Method 2: The second method employs the same analytical principles as method
5
1 and is also based on the use of internal recovery standards. A part of the quartz filter sample (1/4) of the whole filter area was used for extraction. All glassware used for sample workup was deactivated with 5% dimethyldichlorosilane in toluene in or-der to minimize adsorption and loss of polar acidic compounds. Before extraction, three recovery standards (3.75 µg of each) were added to the filter sample: (a)
deuter-10
ated glutaric acid (2,2,4,4-d4-pentanedioic acid; Cambridge Isotope Laboratories), (b) deuterated malic acid (2,2,3-d3-malic acid; Cambridge Isotope Laboratories) and (c) tropic acid (3-hydroxy-2-phenylpropionic acid; Fluka, Buchs, Switzerland) were added. Deuterated glutaric acid served as internal recovery standard for the dicarboxylic acids, i.e., glutaric acid, succinic acid and fumaric acid. Deuterated malic acid served as
in-15
ternal recovery standard for the hydroxy mono- and dicarboxylic acids, i.e., malic acid, glyceric acid, α- and β-hydroxy glutaric acid, threonic acid, an isomer of threonic acid, and tartaric acid. Tropic acid served as internal recovery standard for the aromatic acids, i.e., 2-, 3- and 4-hydroxybenzoic acid, vanillic acid and isovanillic acid. Extrac-tion was performed in 25 ml Pyrex flasks with methanol (3 times with 20 ml) under
20
ultrasonic agitation for 15 min. The subsequent steps were the same as for method 1. For assessing the amounts of the analytes, the response factor of pure reference com-pounds was used. Duplicate analyses show that the precision of the determinations was about 10%. All reported concentrations are corrected for procedural blanks. 2.6. IC
25
A 1/4 of each HiVol sample was extracted twice into 5.0 ml of water, by short vortex agitation followed by 15 min of gentle shaking. The combined extract was centrifuged for 5 min and filtered through a GHP Acrodisk® syringe filter (25 mm, 0.45 µm pore size;
ACPD
5, 5687–5749, 2005 Aerosol organic composition during the SMOCC experiment S. Decesari et al. Title Page Abstract Introduction Conclusions References Tables Figures J I J I Back CloseFull Screen / Esc
Print Version Interactive Discussion
EGU
Gelman, Pall Corporation, NY, USA), which had been previously washed with 10 ml water. Each MOUDI and half of each SFU sample were extracted in the same manner into 4.0 ml of water. These were filtered using a GHP Acrodisk® syringe filter (13 mm, 0.45 µm pore size). It has been validated that further extraction was not needed.
IC analysis was carried out using a Varian ProStar HPLC system equipped with a
5
Dionex ED50 electrochemical detector. Anions were determined using a Dionex AS11 analytical column and ASRS-Ultra suppressor in autosuppression mode. For simulta-neous separation of inorganic and short-chain (C1–C9) organic anions, gradient elution by 0.4–25 mM NaOH (2 mL/min) was employed (Table 1). Cations were determined us-ing a Dionex CS12 column and CSRS-Ultra suppressor in autosuppression mode with
10
20 mM methanesulfonic acid (MSA) as an eluent (1 ml min−1). All ions were quantified against standard calibration curves. A thorough validation of extraction and analytical method can be found in Falkovich et al. (2004).
2.7. IEC
Sample extracts obtained as described for IC analysis were purified using AccellT M
15
QMA solid-phase extraction cartridges (Waters, MA, USA) in order to eliminate HULIS, which interfered with detection. The samples were separated using ion exclusion liquid chromatography using a Dionex ICE-AS1 column and a Varian ProStar 230I HPLC pump, and polyhydroxy compounds were detected by photodiode array (Varian ProStar 330) at 194 nm (for a detailed description of the method, please see Schkolnik
20
et al., 2005). The method uncertainty is 15% for concentrations >0.2 µg/m3, and 23% for concentrations <0.2 µg/m3.
2.8. IC–UV
Ion-exchange chromatography on a tertiary amine stationary phase (DEAE) was used to fractionate WSOC according to their ionic nature at pH 8. The whole set of 5-stage
25
ACPD
5, 5687–5749, 2005 Aerosol organic composition during the SMOCC experiment S. Decesari et al. Title Page Abstract Introduction Conclusions References Tables Figures J I J I Back CloseFull Screen / Esc
Print Version Interactive Discussion
the IC-UV technique, implemented on a Hitachi L-7100 HPLC system equipped with a Gilson autosampler, a Toso-Haas DEAE-TSK gel column (7.5 mm i.d. × 7.5 cm l.), and an UV detector (260 nm). The aliquots of samples for HPLC analysis were dried under vacuum and re-dissolved with 300 µl of mobile phase A, necessary to fill the 100 µl loop of the HPLC system. The injection of samples dissolved in the first mobile phase
5
instead of water allowed the suppression of the injection peak in the chromatogram, in order to perform a more accurate integration of the peak arising from non-retained analytes.
The mobile phase was an aqueous solution of 20% acetonitrile and NaClO4at the following concentrations: A) 0 M; B) 0.02 M; C) 0.4 M. The pH of the mobile phases B
10
and C was held constant at 8.0 with a 0.01 M TRIS:HCl buffer. A first isocratic elution was followed by a gradient (from 12 to 15 min) changing the solvent composition from A to B; after 6 min of isocratic conditions, a second gradient from 21 to 26 min allowed the system to reach the 100% C composition. A last five minute gradient changed the com-position of the mobile phase to 100% A. Flow rate was 0.7 ml min−1. The compounds
15
eluted A) with the first eluent (from 3 to 17 min), B) after the increase of the NaClO4 concentration to 0.02 M (from 17 to 26 min), or C) after the second increase of the ionic strength (from 26 to 32 min) were classified as neutral compounds (NC), mono-/di-acids (MDA) and polyacids (PA), respectively. Compared to the original analytical procedure proposed by Decesari et al. (2000), the elution method used in the present study
im-20
proves the separation between NC and the acidic fractions, allowing to overcome the elution problems with the phenolic compounds (Chang et al., 2005). The attribution of the separated fractions to chemical classes has been verified by injection of standard compounds (their retention time in minutes is indicated in parentheses in the following listing) selected to represent all the classes of polar organic compounds known to
oc-25
cur in biomass burning aerosol (Graham et al., 2002). NC: D-galactal (4.5), D-glucal (4.5), furfuryl alcohol (5.0), benzyl alcohol (5.6), vanillin (9.8), phenol (10.2), m-cresol (11.9); MDA: glyoxylic acid (19.2), sodium formate (19.7), sodium oxalate (23.4), malic acid (23.9), potassium hydrogen-phthalate (25.1); PA: 1,3,5-benzene-tricarboxylic acid
ACPD
5, 5687–5749, 2005 Aerosol organic composition during the SMOCC experiment S. Decesari et al. Title Page Abstract Introduction Conclusions References Tables Figures J I J I Back CloseFull Screen / Esc
Print Version Interactive Discussion
EGU
(28.3), citric acid (28.5), Suwannee River fulvic acid (ca. 29). Clearly, the retention times of all the standards match with those expected according to the classification into the three main chromatographic fractions.
Calibration factors to convert the peak areas of NC, MDA and PA into their specific carbon concentrations were provided by chromatographic fractions isolated on
prepar-5
ative glass columns of DEAE-cellulose gel. Buffer solutions of ammonium bicarbonate were used for selective elution of NC, MDA and PA. In order to improve the resolution while keeping low the volume of mobile phase necessary to elute the strongly retained compounds, two columns, A and B (lengths: 1 cm+ 4 cm), were initially used in series to separate NC from the acidic compounds retained on the column. MDA were
subse-10
quently eluted with the 0.02 M buffer, while in a second step PA were eluted with 1 M buffer directly from column A by-passing B. This procedure allows the elution of each fraction with an amount of ammonium bicarbonate low enough to be easily removed by rotary evaporation. The isolated fractions were then analyzed for TOC and by HPLC, providing an external calibration for the HPLC technique. The precision of the
proce-15
dure for providing calibration factors is 8% for NC and PA and 20% for MDA, while the variability between samples belonging to homogenous sets (e.g., the samples of the dry, transition or wet periods) introduces an uncertainty of 10–20% up to 30% in the case of NC in the coarse aerosol samples.
3. Results
20
3.1. Concentrations and trends of TC, EC and total WSOC
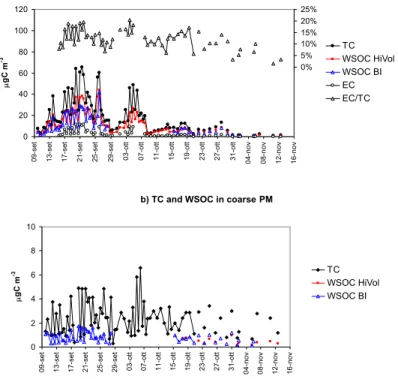
Figure 1 shows the temporal trends of TC from the TOT analysis of HVDS1 filters in the fine and coarse size fractions throughout the experiment. EC data provided by EGA analysis of water-extracted HVDS2 filters (fine fraction) are also reported after correc-tion for sampling biases between the two HiVol systems. Data are already corrected for
25
ACPD
5, 5687–5749, 2005 Aerosol organic composition during the SMOCC experiment S. Decesari et al. Title Page Abstract Introduction Conclusions References Tables Figures J I J I Back CloseFull Screen / Esc
Print Version Interactive Discussion
aerosol (Table 1). These data are in agreement with results reported in the literature on biomass burning in tropical forests (Reid et al., 2004). It should be noted that the EC values provided by EGA analysis of water-extracted filters are about six-fold higher than those measured by TOT analysis (not shown in the figure), while they are sub-stantially in agreement with those determined by means of a Ruprecht and Patashnik
5
(R&P) 5400 carbon analyzer (Fuzzi et al., 20052). The partitioning between OC and EC in TOT analysis depends strongly on the temperature program used (Schmid et al., 2001), especially for biomass smoke aerosols, and suffers from artifacts when filters are heavily loaded (Kubatova et al., 1999).
The figure also shows the concentrations of total WSOC determined on the same
10
HVDS filters used for TOT analysis, plus the total WSOC determined on the Berner im-pactor samples obtained by lumping the imim-pactor stages corresponding to an aerosol diameter <1.2µm (fine fraction), and those sampling between 1.2 and 10 µm (coarse fraction). Generally, the Berner impactor was less efficient than the HVDS in sam-pling WSOC in the fine fraction, providing concentrations 20% lower on average during
15
the first part of the campaign, when the aerosol concentrations were highest and the discrepancy between the samplers largest. The air concentrations of WSOC are al-ways well correlated with those of TC and PM (the latter are not shown in the figure), with temporal trends that reflect the main factors controlling the aerosol loads in the boundary layer as discussed in a parallel paper (Fuzzi et al., 20052). Clearly, the high
20
aerosol concentrations of submicrometer carbonaceous particles observed in Septem-ber and in the beginning of OctoSeptem-ber (i.e., the dry period) must be attributed to the intense biomass burning activities in Rond ˆonia and Mato Grosso, and other upwind Brazilian states at that time. Under high pressure meteorological conditions, the height of the tropical continental boundary layer undergoes a diurnal cycle, which causes
25
fluctuations in the aerosol loads with clear maxima during the night.
After the intense precipitation event on 8 October, the concentrations of biomass burning particles started to increase again but without reaching the peaks observed in the dry period. This period was denoted as the “transition period”. Finally, “wet”
ACPD
5, 5687–5749, 2005 Aerosol organic composition during the SMOCC experiment S. Decesari et al. Title Page Abstract Introduction Conclusions References Tables Figures J I J I Back CloseFull Screen / Esc
Print Version Interactive Discussion
EGU
conditions with frequent rain episodes became established after 1 November, leading to a substantial decrease in the concentrations of the fine particles, down to approx. 4% relative to the average concentrations observed in the dry period.
Conversely, the TC in the coarse fraction did not undergo a significant decrease from the dry to the wet period (Fig. 1b), suggesting that its concentrations were only
5
marginally affected by the biomass burning emissions and were controlled by other sources that also hold for periods of intense precipitation. In contrast to the strong dom-inance of submicrometer WSOC mass during dry conditions, the concentrations of the WSOC in the fine and coarse fractions were comparable (0.72 and 0.50 µg C/m3on av-erage, respectively) during the wet period. The trends in WSOC concentrations in the
10
fine and coarse fractions closely follow those of TC. However, the average WSOC/TC ratios are different, indicating that coarse carbonaceous particles have a lower WSOC content (Table 1b). The analysis of the chemical tracers indicates that biological par-ticles contributed to the coarse fraction of the aerosol (see the following discussion). Large biological particles emitted by vegetation typically contain substances that are
15
essentially water-unextractable, such as cell membranes and walls, epi-cuticular ma-terials, as well as water-soluble compounds trapped inside intact cells (Graham et al., 2003). Therefore, the occurrence of large biological particles is a plausible explanation for the less soluble character of coarse carbonaceous particles collected at FNS. Con-versely, WSOC dominate the composition of TC in fine particles from biomass burning
20
sources. During the dry period, a limited but significant increase in the WSOC per-centage was observed during day-time compared to the night. This difference can be attributed either to the different combustion stages occurring during the day compared to night (i.e., more frequent flaming than smoldering fires), or to the photochemical pro-duction of secondary organic compounds during day (Hoffer et al., 20051). Therefore,
25
different sources of biomass burning aerosols and secondary processes are likely to affect the soluble/insoluble character of the fine particles in the dry period.
ACPD
5, 5687–5749, 2005 Aerosol organic composition during the SMOCC experiment S. Decesari et al. Title Page Abstract Introduction Conclusions References Tables Figures J I J I Back CloseFull Screen / Esc
Print Version Interactive Discussion
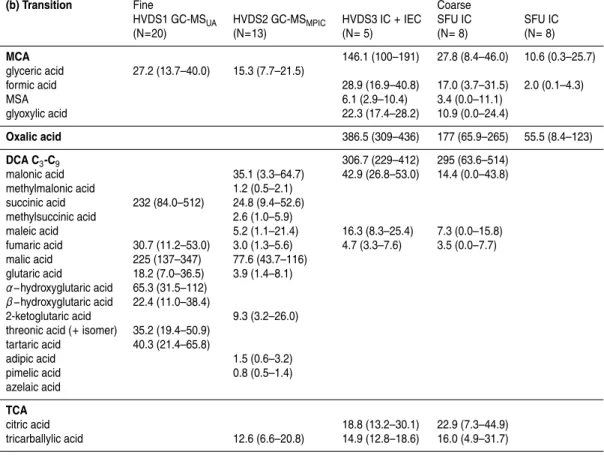
3.2. OC speciation in the fine and coarse aerosol
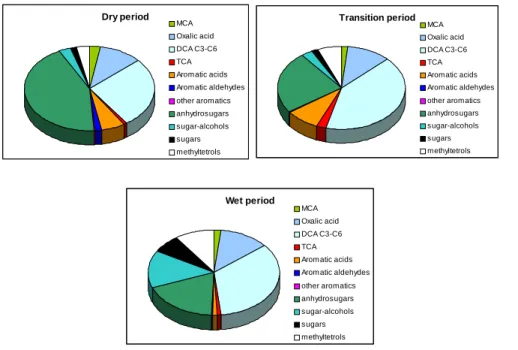
Using the diverse analytical techniques for individual compound analysis, as described in the experimental section, we identified and quantified a series of polar organic com-pounds with 1 to 12 carbon atoms per molecule, comprising different chemical classes: mono-carboxylic, dicarboxylic and tricarboxylic acids, aromatic acids and aldehydes,
5
sugars, sugar-alcohols and anhydrosugars. A summary of the results of WSOC spe-ciation from the analysis of filter samples is given in Table 2, while a pie chart (Fig. 2) shows the relative concentrations of the different identified chemical classes deter-mined in fine PM for the various periods of the campaign. The four sets of data available for the composition of submicron particles exhibit discrepancies in the concentrations
10
of specific classes of compounds. However, since the statistics for each series are not based on the same number of samples, a general conclusion on the recovery of the different sampling systems and analytical methods cannot be provided here.
In general, the IC analysis provided higher concentrations of monocarboxylic, tricar-boxylic and aromatic acids compared to the GC–MS methods. The GC–MS analysis
15
following the UA methods (denoted by GC-MSUA) provided higher values for the dicar-boxylic acids and lower for the sugar-derivatives compared to the analysis performed with the MPIC method (denoted by GC-MSMPIC). The recovery of low-molecular weight compounds, such as C3–C6dicarboxylic acids (DCA) by GC-MS can be affected by the different extraction techniques employed. The levoglucosan concentrations obtained
20
with the GC-MSUA method are in agreement with the results of the IEC-UV method which does not require a derivatization step (Schkolnik et al., 2005). Therefore, the deviation between the two methods shown in the Table is merely due to the different sets of samples analyzed. Further, it is noted that the levoglucosan concentrations obtained with the GC-MSUA method are in good agreement with those for the
LBA-25
EUSTACH-2 campaign, which had been conducted at the same pasture site (Graham et al., 2002). A possible reason for the large discrepancies obtained for measurement of polar carboxylic acids between the two GC-MS methods is the different polarity of
ACPD
5, 5687–5749, 2005 Aerosol organic composition during the SMOCC experiment S. Decesari et al. Title Page Abstract Introduction Conclusions References Tables Figures J I J I Back CloseFull Screen / Esc
Print Version Interactive Discussion
EGU
the extraction solvents used: the GC-MSUA method uses methanol as an extraction solvent, and internal recovery standards that allow to correct for losses during sample workup, while the GC-MSMPIC method uses acetonitrile (less polar than methanol) as extraction solvent and assumes a 100% recovery.
The data in Tables 2a and b can be directly compared with the GC–MS results from
5
the 1999 LBA-EUSTACH-2 campaign (Graham et al., 2002). The coarse filters col-lected during the SMOCC campaign were subjected to a less comprehensive set of analyses than used in LBA-EUSTACH, and sugar-derivatives were not measured. In the case of the submicron particles, on the other hand, the combination of speciation methods in the present study, comprising both GC and LC techniques provided a more
10
detailed picture of the organic composition. In particular, in addition to the di- and tri-carboxylic acids, benzoic and vanillic acids, and sugar-derivatives already identified and measured by Graham et al. (2002), the analysis of the LBA-SMOCC samples in-dicated higher concentrations of monocarboxylic acids and significant concentrations of dicarboxylic acids, hydroxy mono- and dicarboxylic acids, and 2-methyltetrols. The
15
identified chemical compounds are classified as follows:
– C1−C3monocarboxylic acids: acetic, formic, methanesulfonic, lactic, glyoxylic and glyceric acids. They represent 4 to 7% of total aliphatic acids. Monocar-boxylic acids have multiple sources, including both biomass burning and biogenic emissions (Souza et al., 1999);
20
– C2−C9aliphatic dicarboxylic acids: oxalic acid was found to be by far the most abundant carboxylic acid identified, followed by malonic, succinic and malic acid, and with a clear increase in the relative contribution of the latter species towards the end of the campaign. Oxalic acid can originate from multiple sources, both primary and secondary. It was recently found as the most abundant carboxylic
25
acid in biomass burning smoke in South Africa (Gao et al., 2003). Conversely, malic acid shows a more pronounced biogenic origin and was found to accompany photo-oxidation products of isoprene (i.e., 2-methyltetrols) in the Amazon basin
ACPD
5, 5687–5749, 2005 Aerosol organic composition during the SMOCC experiment S. Decesari et al. Title Page Abstract Introduction Conclusions References Tables Figures J I J I Back CloseFull Screen / Esc
Print Version Interactive Discussion
(Claeys et al., 2004a);
– Aliphatic tricarboxylic acids: they include citric and tricarballilyc acids, and
ac-count for only 1 to 2% of the mass of total speciated organic compounds. They have been found previously (Graham et al., 2002);
– One-ring aromatic acids and aldehydes: the aromatic compounds include
5
methoxylated species (vanillin, syringaldehyde and the corresponding acids) and hydroxy-benzoic acids. The methoxylated compounds are more abundant com-pared to the hydroxy-benzoic acids in the dry season, whereas the contrary holds starting from the transition period. The concentration of the aromatic compounds clearly decreases relatively to aliphatic acids from 1:5 in the dry period to 1:25 in
10
the wet period. One-ring aromatic acids and aldehydes are primary compounds known to be produced by the combustion of lignins (Simoneit, 2002) and are, therefore, enriched in fresh biomass burning smoke;
– Sugars and sugar-derivatives: they comprise both pyrogenic (anhydrosugars;
Graham et al., 2002) and biogenic (sugars and sugar-alcohols; Simoneit et al.,
15
2004) compounds. Levoglucosan is the most abundant single compound identi-fied in submicron aerosols during the whole campaign, including the wet period. However, the concentration of levoglucosan and the other anhydrosugars clearly decreases relative to the biogenic compounds (sugars and sugar-alcohols), from 10:1 in the dry to 9:10 in the wet period;
20
– 2-Methyltetrols: they were identified as major biogenic compounds in the Amazon
basin, and were attributed to photo-oxidation of isoprene (Claeys et al., 2004a). Principal component analysis confirmed that the concentrations of 2-methyltetrols in the SMOCC filter samples do not correlate with those of pyrogenic compounds, such as levoglucosan and potassium sulfate Maenhaut et al., 2005, in
prepara-25
tion). Figure 2 also shows that 2-methyltetrols account for a very small fraction of the identified WSOC mass during the dry period, whereas they add up to 10% of
ACPD
5, 5687–5749, 2005 Aerosol organic composition during the SMOCC experiment S. Decesari et al. Title Page Abstract Introduction Conclusions References Tables Figures J I J I Back CloseFull Screen / Esc
Print Version Interactive Discussion
EGU
the speciated mass in the wet period, following the decrease of the concentrations of the pyrogenic organic compounds.
The tracer analysis clearly indicates a more pronounced signature of the biogenic sources in the wet period compared to the previous periods of the campaign. Or-ganic compounds of clearly pyrogenic origin account for 52, 35 and 21% of the total
5
speciated compounds in the dry, transition and wet periods, respectively, while the corresponding fractions for the biogenic species are 8, 11 and 31% (Fig. 2). The relatively high concentrations of levoglucosan and other pyrogenic compounds in the samples from November suggest that the biomass burning activity was not totally sup-pressed at the beginning of the wet season. In that period, persistent fire activity could
10
be detected in Rond ˆonia and Mato Grosso in areas temporarily free from precipita-tions (www.master.iag.usp.br/queimadas/). Finally, the increase in the concentrations of aliphatic carboxylic acids compared to anhydrosugars and aromatic compounds to-wards the end of the campaign may reflect more pronounced secondary sources due to oxidation of either pyrogenic and biogenic VOCs. The enrichment of the aliphatic
15
carboxylic acids compared to anhydrosugars is known to occur during the transport of biomass burning products (Gao et al., 2003). After the onset of wet conditions, the longer transport from distant sparse fires, as well as more pronounced in-cloud processing, would favor the production of secondary organic compounds, rendering a more chemically aged character to the aerosol OC. The same conclusion can be
de-20
rived from the change in the size-segregated inorganic chemical composition from the dry to the wet period (Fuzzi et al., 20052).
Table 2 also reports the sum of concentrations of identified organic compounds and the aerosol TC, OC and WSOC for the same periods. The recovery of the speciation methods is higher in the case of the GC-MSUAanalysis on the HVDS1 samples, where
25
the identified compounds account for by 6 to 8% of TC, and 9 to 11% of WSOC on a carbon basis. It is clear that a large part of the organic matter was not amenable to GC–MS analysis because it could not be eluted or derivatised into stable products, and eventually eluded identification at the molecular level.
ACPD
5, 5687–5749, 2005 Aerosol organic composition during the SMOCC experiment S. Decesari et al. Title Page Abstract Introduction Conclusions References Tables Figures J I J I Back CloseFull Screen / Esc
Print Version Interactive Discussion
3.3. OC speciation in the size-segregated samples
Selected samples of 12-stage and 10-stage MOUDI impactors underwent OC specia-tion by GC-MS, IC and IEC-UV techniques, providing the size-distribuspecia-tions of the most important identified organic compounds in the three periods of the campaign (Falkovich et al., 2004; Claeys et al., in preparation, 20053; Schkolnik et al., 2005). The resulting
5
size-segregated organic composition in terms of identified chemical classes is plotted for samples representative from the dry, transition and wet periods in Fig. 3a and 3b. The concentrations of the speciated OC classes are expressed as percentages of the aerosol mass in each size bin. Figure 3a reports the size-segregated composition of the carboxylic acids determined by IC analysis. Mono-carboxylic acids, oxalic acid
10
and C3–C9dicarboxylic acids are the main contributors to the acidic organic fraction in all the size intervals, although aromatic compounds are also important in the dry and transition periods, but only for particles with a diameter lower than 1 µm. Conversely, aromatic acids were not detected in the sample from the wet period in all size intervals. In all periods, the carboxylic acids are less abundant in the finest size range, as well
15
as in the coarse fraction. Their contribution to aerosol mass is also higher in the dry compared to the other two periods. The contribution of the 2-methyltetrols determined by GC–MS to PM (Fig. 3b) also shows a decrease toward the wet period, but only in the submicron fraction, whereas the opposite is true for the coarse fraction. Anhy-drosugars are the most abundant compounds in all seasons, with levoglucosan as the
20
main species in the submicron and supermicron fractions, respectively. Sugar-alcohols (arabitol and mannitol) contribute up to almost two thirds of the speciated polyols in the size intervals 1.8–10 µm in the dry period, but this fraction increases to 60–90% in the transition phase and to 80–100% in the wet period. Finally, the contribution of the
3
Claeys, M., Kourtchev, I., Pashynska, V., Vas, G., Vermeylen, R., Cafmeyer, J., Chi, X., Artaxo, P., and Maenhaut, W.: Polar organic marker compounds in boundary layer aerosols during the LBA-SMOCC 2002 biomass burning experiment in Rondnia, Brazil: time trends, diurnal variations and size distributions, in preparation, 2005.
ACPD
5, 5687–5749, 2005 Aerosol organic composition during the SMOCC experiment S. Decesari et al. Title Page Abstract Introduction Conclusions References Tables Figures J I J I Back CloseFull Screen / Esc
Print Version Interactive Discussion
EGU
2-methyltetrols to OC increases significantly in the wet period, but only in the submicron size intervals.
The data reported in Figures 3a and 3b show that the contribution of the identified classes of organic compounds to aerosol PM changes with the aerosol diameter, and is generally highest in the 0.4–4 µm range. Since TC was not determined systematically
5
on MOUDI samples, a size-segregated carbon balance was not attempted. However, the available TC size-distributions indicate a relatively constant TC/PM ratio for submi-crometer aerosols, which are essentially carbonaceous particles (Fuzzi et al., 20052). Therefore, the fraction of TC speciated at the molecular level is also expected to be higher for particles with diameter larger than 0.4 µm than for those in the finest size
10
range. Finally, it should be noted that, since submicron particles with diameter lower than 0.4 µm account for 30 to 40% of PM2 (Fuzzi et al., 20052), the recovery values relative to OC obtained on PM2 and PM2.5 filter samples (see previous section) must be considered as averages between the low percentage of speciated OC in the finest particles and the high percentage of identified organic compounds in larger (>0.4 µm)
15
submicron particles.
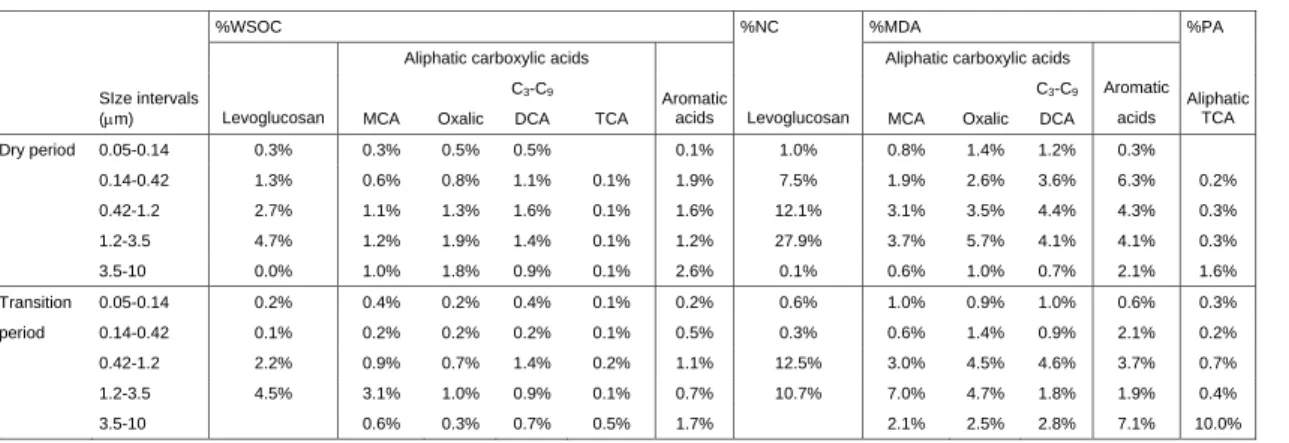
3.4. Apportionment of WSOC into main chemical classes
Compared to the methods for WSOC speciation discussed so far, the IC-UV technique presented in the experimental section is a chromatographic method for the separation of broad chemical classes of WSOC, which is not targeted to speciation at the
molec-20
ular level. The neutral compounds (NC), mono-/di-acids (MDA) and the polyacids (PA) separated by IC-UV were identified mainly on the basis of their chromatographic be-havior (i.e., the retention time). The quantitative analysis is based on the determination of the TOC on isolated fractions used to calibrate the UV detector. Therefore, the con-centrations of NC, MDA and PA could be derived only as µg of carbon per cubic meter,
25
as for total WSOC. Other than some improvements in the chromatographic conditions, the method is essentially the same as the one used for the analysis of PM2.5 samples during the LBA-EUSTACH campaign (Mayol-Bracero et al., 2002a).
ACPD
5, 5687–5749, 2005 Aerosol organic composition during the SMOCC experiment S. Decesari et al. Title Page Abstract Introduction Conclusions References Tables Figures J I J I Back CloseFull Screen / Esc
Print Version Interactive Discussion
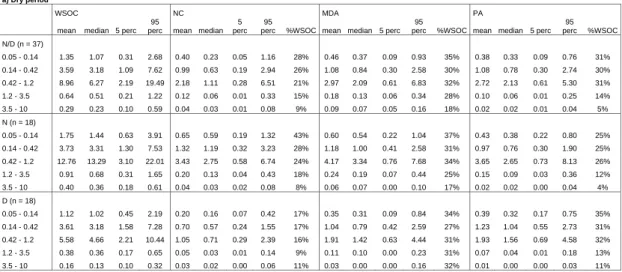
The NC, MDA and PA were detected by UV absorption at 260 nm in all samples ana-lyzed, provided that the injected WSOC amount exceeded 500 ng C. Using calibration following the procedure described in the experimental section, the HPLC peak areas of the three main regions of the chromatogram provided the concentrations of NC, MDA and PA in the size range 0.05–3.5 µm (stages I to IV of the Berner impactor) for 37
sam-5
ples from the dry period, 12 samples from the transition period and 5 samples from the wet period, whereas the concentrations in larger particles (3.5–10 µm) were often below the detection limit. Table 3 reports the statistics for the concentrations of NC, MDA and PA in size-segregated samples from the three periods and also separately for nocturnal and diurnal samples. The mean relative contributions of the three IC-UV
10
classes to the total water-soluble carbon are also included. Average size-segregated distributions for the three chemical classes and for the WSOC fraction unresolved by the IC–UV method are shown in Fig. 4 for the three main periods of the campaign. A constant feature for all samples is the substantially lower relative concentration of PA in the coarse size range compared to the submicron size fraction. PA show a particularly
15
low abundance in coarse particles from the wet period. MDA exhibit rather constant contributions to WSOC in the submicron particles, whereas their contribution to WSOC in the coarse particles is quite variable. Finally, the NC fraction of WSOC decreased steadily from the finest size range (0.05–0.14 µm) to the coarsest, although a mode in the range 1.2–3.5 µm was also observed in some samples from the transition and
20
wet periods. Table 3 also highlights some systematic differences in the composition of the aerosol samples collected at night-time compared to day-time. In particular, the NC fraction is significantly higher during the night (often by a factor of two compared to the day) in all periods. Conversely, PA are relatively more abundant during day in the dry period, but differences in the other two seasons are less evident. MDA also
25
show limited diel variations, tending towards enrichment during night (similar to NC), especially in the finest size fraction during the transition period. The high content of neutral compounds of nocturnal samples is clearly correlated with the higher nocturnal concentrations observed for levoglucosan (Schkolnik et al., 2004). Therefore, the diel
ACPD
5, 5687–5749, 2005 Aerosol organic composition during the SMOCC experiment S. Decesari et al. Title Page Abstract Introduction Conclusions References Tables Figures J I J I Back CloseFull Screen / Esc
Print Version Interactive Discussion
EGU
variations in the IC–UV composition can be interpreted in terms of different combustion conditions (e.g., smoldering vs. flaming processes) active at different times of the day. The production of PA during the day can also be explained by heterogeneous chemical processes promoted by sunlight (Hoffer et al., 20051). Although the chemical classes separated by the IC–UV method are not unambiguous tracers of the WSOC sources,
5
the variations in their relative concentrations can be interpreted on the basis of the correlation with other chemical constituents of the aerosol (e.g., K), which can be more readily associated with a particular source or source processes. A full treatment of this subject is given in a parallel paper (Fuzzi et al., 20052).
The fraction of WSOC not accounted for by the sum of NC, MDA and PA is
size-10
dependent, being around 0–15% for the smallest particles, and increasing to 70% in the coarsest size range. The proportion is lower in the dry period, compared to the transition and especially the wet period, during which 50% of WSOC could not be ac-counted for even in the accumulation mode size range. The organic materials that can contribute to WSOC, especially in the wet period, and not accounted for by the IC–UV
15
analysis could be either semi-volatile compounds that were lost during the calibration procedure, or hydrophilic colloids (very high molecular weight humic-like particles, frag-ments of biological membranes and other cell constituents) that are extracted from the impactor foils but are not elutable from the HPLC column.
4. Discussion
20
4.1. Speciated WSOC and chemical classes
The analytical techniques described in the experimental section can be grouped into methods for individual compound analysis (GC–MS, IC and IEC–UV), and methods tar-geted to the separation of main chemical classes (IC–UV). The former allow the identi-fication and measurement of six categories of polar organic compounds, but leave
un-25
ACPD
5, 5687–5749, 2005 Aerosol organic composition during the SMOCC experiment S. Decesari et al. Title Page Abstract Introduction Conclusions References Tables Figures J I J I Back CloseFull Screen / Esc
Print Version Interactive Discussion
a high recovery in the measurement of the water-soluble fraction of OC by fractiona-tion into three main categories, whose specific chemical composifractiona-tions, however, rests poorly defined. Therefore, in general, the IC–UV chromatographic classes do not cor-respond directly to any of the categories of polyols and carboxylic acids accounted for by individual compound analyses, but are more likely to include them.
5
To better understand the chemical nature of the “neutral compounds”, “mono-/di-acids” and “poly“mono-/di-acids”, the WSOC speciated by GC–MS, IC and IEC in size-segregated samples can be classified according to their number of carboxylic groups per molecule; the estimation of their contribution to each of the three IC–UV classes is then straight-forward. However, the concentrations of the identified WSOC were obtained on MOUDI
10
samples, while those of total WSOC and of NC, MDA and PA were available only for the Berner impactor, making the comparison difficult owing to the different size resolutions and sampling efficiencies of the two impactors. To make the two sets of data compara-ble, we first defined a sub-set of four MOUDI samples analyzed by IC and IEC for their organic and inorganic composition, and collected approximately in parallel with Berner
15
impactor samples. Then, the MOUDI size-distributions for the identified WSOC and inorganic compounds were converted to continuous size-distributions according to an inversion algorithm, using the MICRON inversion program (Wolfenbarger and Seinfeld, 1990), which takes into account the collection efficiency and species concentration in each MOUDI stage. A more detailed description of the use of the program is given
20
by Havr ´anek et al. (1996). The concentrations of the chemical species measured in MOUDI samples could then be retrieved for the size intervals of the Berner impactor by integrating the continuous size distributions between the Berner cut-offs. To take into account the different sampling efficiencies of the two impactors, the concentrations of organic species were normalized to those of sulfate, which had been measured on both
25
sets of impactor samples. The identified WSOC from MOUDI were then expressed as
µgC m−3 and compared to the concentrations of total WSOC and of the IC-UV classes
from the Berner impactor.
ACPD
5, 5687–5749, 2005 Aerosol organic composition during the SMOCC experiment S. Decesari et al. Title Page Abstract Introduction Conclusions References Tables Figures J I J I Back CloseFull Screen / Esc
Print Version Interactive Discussion
EGU
the transition phase (n=2). Levoglucosan accounts for 1 to 12% of NC in the fine frac-tion, and for an even higher percentage in the size range 1.2–3.5 µm. Similarly, the identified mono- and di-carboxylic acids account for 6 to 16% of total MDA in the fine fraction, and 9–18% in coarse particles. In contrast, the contribution of the identified tricarboxylic acids (citric and tricarballylic) to total PA is very low, usually less than 1%.
5
In conclusion, the speciated WSOC represent around 1.5% of the total water-soluble carbon in the 0.05–0.14 µm size interval, and up to 10% in the 0.42–3.5 µm size range. The identified WSOC are mostly NC and MDA, while PA remains essentially uncharac-terized at the molecular level. This finding is in agreement with the hypothesis that PA consist mostly of medium-to-high molecular weight compounds (HULIS). These results
10
for the identified fractions of the three IC–UV classes analyzed in the impactor sam-ples are in agreement with analogous data obtained on comparable PM2.5 samsam-ples collected during the 1999 LBA-EUSTACH-2 experiment (Mayol-Bracero et al., 2002a). 4.2. A synthetic representation of the WSOC composition by model compounds In the previous section, chemical characterization of the IC–UV chromatographic
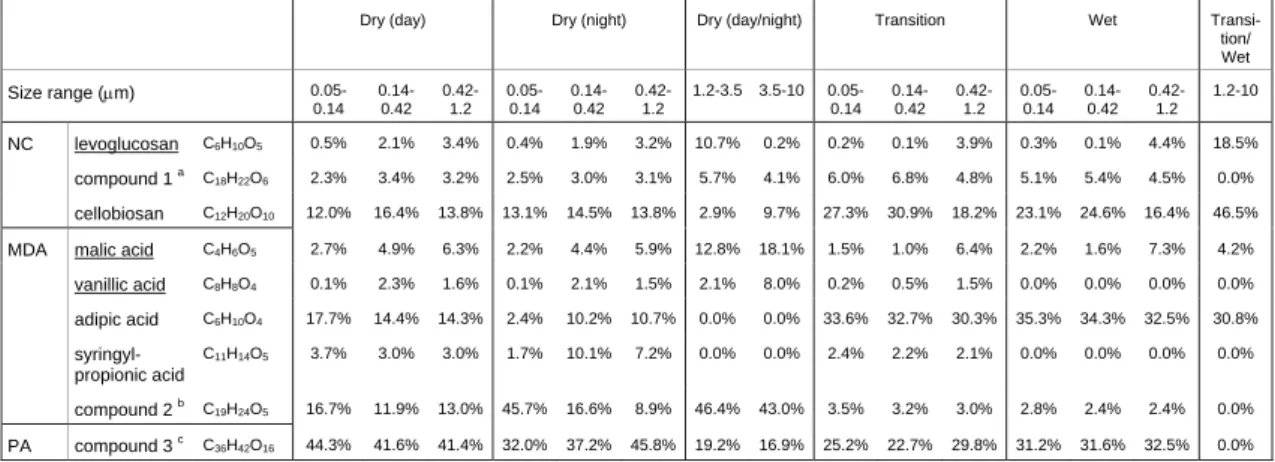
15
classes was attempted in terms of organic compounds identified at the molecular level, showing that large fractions of NC, MDA and especially PA could not be spe-ciated using this approach. An alternative characterization method is the functional group analysis performed by1HNMR spectroscopy on the water-extracts of filter and impactor samples, as well as on chromatographic fractions separated on IC preparative
20
columns (Tagliavini et al., submitted, 20054). 1HNMR analysis provides the functional group composition of the mixture, but little information on the speciation into individ-ual compounds. The functional groups containing hydrogens directly bound to carbon atoms are determined directly, while COOH groups are assessed after derivatization
4
Tagliavini, E., Moretti, F., Decesari, S., Fuzzi, S., and Maenhaut, W.: Organic functional groups approach to the characterization of WSOC from biomass burning aerosol samples: H NMR and chemical derivatization outcomes, submitted to Atmos. Chem. Phys. Discuss., 2005.