HAL Id: hal-00300950
https://hal.archives-ouvertes.fr/hal-00300950
Submitted on 27 Feb 2003HAL is a multi-disciplinary open access
archive for the deposit and dissemination of sci-entific research documents, whether they are pub-lished or not. The documents may come from teaching and research institutions in France or abroad, or from public or private research centers.
L’archive ouverte pluridisciplinaire HAL, est destinée au dépôt et à la diffusion de documents scientifiques de niveau recherche, publiés ou non, émanant des établissements d’enseignement et de recherche français ou étrangers, des laboratoires publics ou privés.
Forecast, observation and modelling of a deep
stratospheric intrusion event over Europe
P. Zanis, T. Trickl, A. Stohl, H. Wernli, O. Cooper, C. Zerefos, H. Gaeggeler,
C. Schnabel, L. Tobler, P. W. Kubik, et al.
To cite this version:
P. Zanis, T. Trickl, A. Stohl, H. Wernli, O. Cooper, et al.. Forecast, observation and modelling of a deep stratospheric intrusion event over Europe. Atmospheric Chemistry and Physics Discussions, European Geosciences Union, 2003, 3 (1), pp.1109-1138. �hal-00300950�
ACPD
3, 1109–1138, 2003 Forecast, observation and modelling of a deep stratospheric intrusion event P. Zanis et al. Title Page Abstract Introduction Conclusions References Tables Figures J I J I Back CloseFull Screen / Esc
Print Version Interactive Discussion
Atmos. Chem. Phys. Discuss., 3, 1109–1138, 2003 www.atmos-chem-phys.org/acpd/3/1109/
c
European Geosciences Union 2003
Atmospheric Chemistry and Physics Discussions
Forecast, observation and modelling of a
deep stratospheric intrusion event over
Europe
P. Zanis1, T. Trickl2, A. Stohl3, H. Wernli4, O. Cooper5, C. Zerefos1, H. Gaeggeler6, 7, C. Schnabel6, 8, L. Tobler7, P. W. Kubik9, A. Priller10, H. E. Scheel2, H. J. Kanter2, P. Cristofanelli11, C. Forster3, P. James3, E. Gerasopoulos12, A. Delcloo13, A. Papayannis14, and H. Claude15
1
Laboratory of Atmospheric Physics, Aristotle Univ. of Thessaloniki, Greece
2
Forschungszentrum Karlsruhe, IMK-IFU, Garmisch-Partenkirchen, Germany
3
Lehrstuhl f ¨ur Bioklimatologie und Immissionsforschung Technische Universit ¨at M ¨unchen, Freising, Germany
4
Atmospheric Physics, ETHZ, Z ¨urich, Switzerland
5
Cooperative Institute for Research in Environmental Sciences, University of Colorado, Boulder/NOAA Aeronomy Laboratory, Boulder, USA
6
Departement f ¨ur Chemie und Biochemie, Universit ¨at Bern, Switzerland
7
ACPD
3, 1109–1138, 2003 Forecast, observation and modelling of a deep stratospheric intrusion event P. Zanis et al. Title Page Abstract Introduction Conclusions References Tables Figures J I J I Back CloseFull Screen / Esc
Print Version Interactive Discussion
8
Scottish Universities Environmental Research Centre, East Kilbride, UK
9
Paul Scherrer Institute, c/o ETH Z ¨urich, Switzerland
10
Institut f ¨ur Isotopenforschung und Kernphysik, Universit ¨at Wien, Austria
11
Institute of Atmospheric Sciences and Climate, Bologna, Italy
12
Nuclear Physics Department, Aristotle Univ. of Thessaloniki, Greece
13
Royal Meteorological Institute KMI, Uccle, Belgium
14
Department of Physics, National Technical University of Athens, Greece
15
Deutscher Wetterdienst, Meteorologisches Observatorium Hohenpeissenberg, Germany Received: 23 December 2002 – Accepted: 20 February 2003 – Published: 27 Febru-ary 2003
ACPD
3, 1109–1138, 2003 Forecast, observation and modelling of a deep stratospheric intrusion event P. Zanis et al. Title Page Abstract Introduction Conclusions References Tables Figures J I J I Back CloseFull Screen / Esc
Print Version Interactive Discussion
Abstract
A wide range of measurements was carried out in central and southeastern Eu-rope within the framework of the EU-project STACCATO (Influence of Stratosphere-Troposphere Exchange in a Changing Climate on Atmospheric Transport and Oxida-tion Capacity) with the principle goal to create a comprehensive data set on strato-5
spheric air intrusions into the troposphere along a rather frequently observed pathway over central Europe from the North Sea to the Mediterranean Sea. The measure-ments were based on predictions by suitable quasi-operational trajectory calculations using ECMWF forecast data. A predicted deep Stratosphere to Troposphere Transport (STT) event, encountered during the STACCATO period on 20–21 June 2001, could 10
be followed by the measurements network almost from its inception. Observations provide evidence that the intrusion affected large parts of central and southeastern Europe. Especially, the ozone lidar observations on 20–21 June 2001 at Garmisch-Partenkirchen, Germany captured the evolution of two marked tongues of high ozone with the first one reaching almost a height of 2 km, thus providing an excellent data set 15
for model intercomparisons and validation. In addition, for the first time to our knowl-edge concurrent measurements of the cosmogenic radionuclides10Be and 7Be and their ratio10Be/7Be are presented together as stratospheric tracers in a case study of a stratospheric intrusion. The ozone tracer columns calculated with the FLEXPART model were found to be in good agreement with water vapour satellite images, captur-20
ing the evolution of the observed dry streamers of stratospheric origin. Furthermore, the time-height cross section of ozone tracer simulated with FLEXPART over Garmisch-Partenkirchen captures with many details the evolution of the two observed high-ozone filaments measured with the IFU lidar, thus demonstrating the considerable progress in model simulations. Finally, the modelled ozone (operationally available since Octo-25
ber 1999) from the ECMWF (European Centre for Medium-Range Weather Forecasts) atmospheric model is shown to be in very good agreement with the observations dur-ing this case study, which provides the first successful validation of a chemical tracer
ACPD
3, 1109–1138, 2003 Forecast, observation and modelling of a deep stratospheric intrusion event P. Zanis et al. Title Page Abstract Introduction Conclusions References Tables Figures J I J I Back CloseFull Screen / Esc
Print Version Interactive Discussion
that is used operationally in a weather forecast model. This suggests that coupling chemistry and weather forecast models may significantly improve both weather and chemical forecasts in the future.
1. Introduction
Stratosphere-Troposphere Exchange (STE), understood as the flux of air or trace con-5
stituents across the tropopause, is one of the key factors controlling the budgets of ozone, water vapour and other substances in both the troposphere and the lower stratosphere. The term STE includes both directions; the Stratosphere to Troposphere Transport (STT) and Troposphere to Stratosphere Transport (TST). Although there is a long scientific debate in the literature over the last four decades on the relative con-10
tribution from photochemistry and STT about the origin of background tropospheric ozone (Junge, 1962; Crutzen, 1973; Chameides and Walker, 1973; Fabian and Pruch-niewicz, 1977; Singh et al., 1978; Logan, 1985; Penkett and Brice, 1986; Austin and Follows, 1991; Follows and Austin, 1992; Davies and Schuepbach, 1994; Holton et al., 1995; Appenzeller et al., 1996a; Roelofs and Lelieveld, 1997; Harris et al., 1998; 15
Lelieveld and Dentener, 2000; Monks, 2000; Stohl et al., 2000) the cross-tropopause flux estimation is still a topic of great scientific interest.
In principle, the most common occurrences of STT in the extratropics, is associ-ated with tropopause folds, which are characterized by tongues of anomalously high potential vorticity (PV) extending equatorward and formed through the isentropic trans-20
port within large-scale cyclonic and anticyclonic disturbances. However, still missing is a single comprehensive and quantitative picture of extratropical STE which would unify the mesoscale approach, which considers the tropopause folds, and the so-called “downward control principle”, which is viewed from the global perspective (Holton et al., 1995; Stohl et al., 2003). Under certain circumstances, some parts of these tongues 25
may be stretched out into elongated filaments, and under others may roll up to form isolated coherent structures containing high PV air (cut-off lows) (Holton et al., 1995).
ACPD
3, 1109–1138, 2003 Forecast, observation and modelling of a deep stratospheric intrusion event P. Zanis et al. Title Page Abstract Introduction Conclusions References Tables Figures J I J I Back CloseFull Screen / Esc
Print Version Interactive Discussion
Deep and intense intrusions of stratospheric air penetrating down to lower tropospheric levels or even to the surface are more relevant than the shallow ones for atmospheric chemistry as they lead to irreversible mixing of stratospheric with tropospheric air and hence to composition changes.
Although STT processes associated with mid-latitude tropopause folds have been 5
widely studied over the last four decades using both observational case studies and nu-merical models, as reviewed by WMO (1986), Davies and Schuepbach (1994), Holton et al. (1995), and Stohl et al. (2003), there is just a limited number of case studies characterising a deep intrusion event on its way down to the lower troposphere, based on both measurements and modelling. Lidar sounding has a great potential for such in-10
vestigations (Ancellet et al., 1991; Langford et al., 1996; Stohl and Trickl, 1999). Eisele et al. (1999), using lidar sounding data during a large number of STT events, found that all but a few deep intrusions reach a level of 3000 m. Only the most vigorous events can produce low altitudes spikes in measured stratospheric tracer concentrations such as O3, H2O, PV, 7Be, and 10Be that are distinct enough to draw the attention of the 15
analyst to a possible stratospheric influence. At least at high mountain peaks there is a higher possibility of an observable stratospheric influence (Stohl et al., 2000). El-bern et al. (1997) performed a statistical assessment of deep intrusions based on ten years records of7Be, ozone, and relative humidity at two Alpine stations, Zugspitze and Wank, in Germany and found that direct deep stratospheric intrusions affect Zugspitze 20
(2962 m asl) during 5% of the time while they affect Wank (1776 m a.s.l.) less than 2.5%. A more recent analysis by James et al. (2002) based on a different data fil-tering approach yielded an average annual stratospheric ozone fraction of 8.8% for pronounced intrusions at the Zugsitze summit. A similar statistical assessment car-ried out for three years at Jungfraujoch (3580 m a.s.l.), Switzerland, Sonnblick (3106 m 25
a.s.l.), Austria and Zugspitze by Stohl et al. (2000), showed that the average observed intrusion frequencies are 17%, 10%, and 7%, respectively. However in all these stud-ies the absolute frequency of deep stratospheric intrusions depends critically on the specification of threshold values for7Be, ozone, and relative humidity.
ACPD
3, 1109–1138, 2003 Forecast, observation and modelling of a deep stratospheric intrusion event P. Zanis et al. Title Page Abstract Introduction Conclusions References Tables Figures J I J I Back CloseFull Screen / Esc
Print Version Interactive Discussion
Although the stratospheric tracers O3, H2O, PV and 7Be have been widely used so far for both climatological and case studies of STT, there are only very few stud-ies, which are mainly climatological, making use of measurements of the cosmogenic radionuclide10Be and the ratio10Be/7Be (Dibb et al., 1994). The cosmogenic radionu-clides 7Be and 10Be are produced through spallation reactions mainly in the strato-5
sphere but they cannot be considered as ideal stratospheric tracers because they at-tach to aerosols and hence their tropospheric lifetime is significantly controlled by wet scavenging processes. A way around the difficulties with wet deposition is to use the concentration ratio of the two radionuclides because both species are washed out in the same way (Raisbeck et al., 1981). In addition, the ratio of10Be/7Be can also be used 10
to trace stratospheric air, like10Be and7Be independently because the ratio values in stratosphere (especially in the lower stratosphere) are much higher than in troposphere due to the much longer half-life of10Be (1.51Ex106yr) compared to7Be (53.12 d) and the relatively long residence time of stratospheric air masses ranging from months to years (Raisbeck et al., 1981). However, in contrast to 7Be, which is measured regu-15
larly with high-resolution gamma-ray spectrometry at Alpine peak stations, regular10Be measurements are scarce, especially in Europe, because its detection requires accel-erator mass spectrometry, which is an expensive method for continuous monitoring. In the framework of STACCATO, combined measurements of10Be and7Be were carried out regularly throughout the course of a full year at Jungfraujoch and Zugspitze. A cli-20
matological study of these7Be and10Be measurements and their ratio was presented by Zanis et al. (2003).
A few of the direct deep stratospheric intrusions have been modelled adequately with numerical simulations. Schuepbach et al. (1999a, 1999b) simulated two episodes at Jungfraujoch with doubly nested mesoscale model (14 km horizontal resolution) ver-25
sions of the “Europa Model” (EM) and “High Resolution Model” (HM) operated by the German and Swiss Weather Services, while Stohl et al. (2000) investigated two episodes over the Alps using a special version of the stochastic Langrangian model FLEXPART based on ECMWF data from the lowest 29 model levels with a
horizon-ACPD
3, 1109–1138, 2003 Forecast, observation and modelling of a deep stratospheric intrusion event P. Zanis et al. Title Page Abstract Introduction Conclusions References Tables Figures J I J I Back CloseFull Screen / Esc
Print Version Interactive Discussion
tal resolution of 1◦ and time resolution of 3 h. The origin of relatively high surface ozone concentrations measured at Izana Observatory (Canary Islands) were also studied successfully using a coupled chemistry – GCM (ECHAM-4) at T63 resolution (1.875◦× 1.875◦) (Kentarchos et al., 2000).
In the present study we provide observational evidence of a successfully forecasted 5
deep stratospheric intrusion event during 20–21 June 2001, based on a measurements network extending from central to southeastern Europe operated within the framework of the EU project STACCATO. Concurrent measurements of the cosmogenic radionu-clides10Be and 7Be and their ratio 10Be/7Be are used for the first time to our knowl-edge to investigate a stratospheric intrusion event. The observational evidence of this 10
deep stratospheric intrusion event is further investigated and supported by model cal-culations with the Lagrangian particle model FLEXPART as well as with the ECMWF global analysis data of potential vorticity, relative humidity and ozone, water vapour (WV) satellite images and 3-D back trajectory analysis. It should be noted that a newly available product from ECMWF is the ozone field, which is analysed and forecast op-15
erationally along with the meteorological parameters at ECMWF since October 1999 and hence this study provides a first validation of this product.
2. Data and methods
2.1. Description of forecast trajectories and measurements
A wide range of measurements were carried out in central and southeastern Europe 20
within the framework of the EU-project STACCATO with the principle goal to collect a comprehensive dataset on stratospheric air intrusions into the troposphere along a rather frequently observed pathway (Wernli and Bourqui, 2002; Sprenger and Wernli, 2003) over central Europe from the North Sea to the Mediterranean Sea. In order to cover a substantial amount of STE cases, co-ordinated measurements during short 25
ACPD
3, 1109–1138, 2003 Forecast, observation and modelling of a deep stratospheric intrusion event P. Zanis et al. Title Page Abstract Introduction Conclusions References Tables Figures J I J I Back CloseFull Screen / Esc
Print Version Interactive Discussion
since November 2000. In a similar approach, Cooper et al. (1998) utilized forecasting techniques in order to time the launching of ozonesondes so that they intercepted tropopause folds. A warning call was issued if it was expected that a significant number of partner stations would be affected by an intrusion. These stratospheric intrusion forecasts, based on ECMWF forecasts, aided the measurement groups with the set-5
up and planning of the observations. Every twelve hours four-day forward trajectories were started from the entire region covering the Atlantic Ocean and western Europe between 250 and 600 hPa. From this large set of trajectories those that initially reside in the stratosphere (PV larger than 2 pvu) and descend during the following four days by more than 300 hPa into the troposphere have been selected as “stratospheric intrusion 10
trajectories”. The same selection criterion has been used in a previous case study (Wernli, 1997) to study an intrusion associated with a major Atlantic cyclone.
Intense vertical ozone profile measurements by lidar and occasional balloon-borne ozonesondes were performed after a warning call was issued. ECC ozonesonde as-cents took place occasionally at Thessaloniki, Greece (40.52◦N, 22.97◦E) and at San 15
Pietro Capofiume (Po basin), Italy (44.65◦N, 11.62◦E) while radiosonde measurements at both stations were also available for all warning calls. In the present study additional ozonesonde data from Uccle, Belgium and Payerne, Switzerland were provided by the respective sounding groups. Ozone-lidar measurements were carried out at Garmisch-Partenkirchen, Germany (47.5◦N, 11.06◦E), with the IFU lidar and at Thessaloniki, 20
Greece (40.52◦N, 22.97◦E), with the AUTH-NTUA lidar.
The IFU ozone lidar (differential-absorption lidar, DIAL) is a three-wavelength lidar operated at 277 nm, 292 nm and 313 nm. Separate receivers (equipped with 1.1-m grating spectrographs each) are used for near-field and far-field detection. The oper-ating range is 0.2 to 18 km under optimum conditions. A total of eight analogue and 25
photon counting channels makes possible the retrieval and intercomparison of different overlapping ozone profiles. In this way, the technical performance of the system can be controlled. The accuracy of the system is approximately 3 ppb up to 6 km and about 5 ppb up to the tropopause, as verified by comparisons with measurements from the
ACPD
3, 1109–1138, 2003 Forecast, observation and modelling of a deep stratospheric intrusion event P. Zanis et al. Title Page Abstract Introduction Conclusions References Tables Figures J I J I Back CloseFull Screen / Esc
Print Version Interactive Discussion
local summit stations and the Hohenpeissenberg ozonesondes. A single measurement is completed within 45 s due to a 100 Hz repetition rate of the KrF pump laser. The IFU lidar was typically operated at intervals of 1 h in the absence of clouds.
Continuous measurements of ozone and 7Be as well as routine acquisition of me-teorological data (relative humidity, temperature, pressure, wind speed and direction) 5
have been carried out regularly at the high-altitude stations Jungfraujoch, Switzerland (46.53◦N, 7.98◦E, 3580 m a.s.l.), Zugspitze, Germany (47.4◦N, 11.0◦E, 2962 m a.s.l.), Sonnblick, Austria (47.05◦N, 12.95◦E, 3106 m a.s.l.) and Mt. Cimone, Italy (44.12◦N, 10.42◦E, 2165 m a.s.l.). In addition to the daily measurements of 7Be (bi-daily for Jungfraujoch), bi-daily measurements of 210 Pb were carried out at Jungfraujoch while 10
regular measurements of10Be were performed at Jungfraujoch (bi-daily) and Zugspitze (daily) with accelerator mass spectrometry (AMS). Information about the7Be measure-ments at all stations can be found in Gerasopoulos et al. (2001) while for10Be mea-surements detailed information is provided by Zanis et al. (2003).
The stratospheric intrusion event presented here influenced a large part of Europe. 15
Figure 1 shows the 4-day forecast trajectories for the time period 19–23 June 2001, where stratospheric air from the Polar region descends deep towards central Europe and in parts towards Greece. In order to facilitate the interpretation of the trajectory plot (e.g. when exactly and at what altitude a stratospheric intrusion can be expected at a specific measurements site) “intrusion hit tables” for the sites Thessaloniki, Jungfrau-20
joch, Garmisch, and Mt. Cimone were also issued daily. These are matrices of time (time step of 3 h) versus altitude and contain a marker that indicates whether – accord-ing to forecast trajectories – the air at the respective altitude and time pertains to a deep stratospheric intrusion. For the case study presented here, the hit tables issued on 19 June 2001 at 00:00 UTC (not shown) indicated that a stratospheric intrusion was 25
expected to affect Jungfraujoch (625–675 hPa) from 03:00 to 18:00 UTC on 20 June 2001 and Garmisch and Mt. Cimone down to 575 hPa.
ACPD
3, 1109–1138, 2003 Forecast, observation and modelling of a deep stratospheric intrusion event P. Zanis et al. Title Page Abstract Introduction Conclusions References Tables Figures J I J I Back CloseFull Screen / Esc
Print Version Interactive Discussion
2.2. Model description
Model calculations of the transport of stratospheric air into the troposphere were per-formed with a special version of the Lagrangian particle dispersion model FLEXPART 4.0 (Stohl et al., 1998). FLEXPART was validated with data from three large-scale tracer experiments in North America and Europe (Stohl et al., 1998) and was shown 5
to be capable of simulating intrusions of stratospheric air filaments into the lower tro-posphere (Stohl and Trickl, 1999; Stohl et al., 2000). It was also used to establish a 15-year climatology of stratosphere-troposphere exchange (James et al., 2003) and to study the transport of aircraft emissions (Forster et al., 2003). This study contributes to the further validation of FLEXPART.
10
FLEXPART was driven with global model-level data from the European Centre for Medium-Range Weather Forecasts (ECMWF, 1995) with a horizontal resolution of 1◦, 60 vertical levels and a time resolution of 3 h (analyses at 00:00, 06:00, 12:00, 18:00 UTC; 3-h forecasts at 03:00, 09:00, 15:00, 21:00 UTC). FLEXPART treats ad-vection and turbulent dispersion by calculating the trajectories of a multitude of parti-15
cles. Stochastic fluctuations of the three wind components are superimposed on the grid-scale winds to represent transport by turbulent eddies. In the boundary layer, magnitude and Lagrangian decorrelation times of these fluctuations are obtained from a detailed parameterisation, and above the boundary layer the turbulent components are set to small values dependent upon the wind shear. To represent convective trans-20
port, FLEXPART was equipped with the convection scheme developed by Emanuel and Zivkovic-Rothman (1999). This scheme uses the grid-scale temperature and hu-midity data and has the advantage of providing a uniform treatment of all types (i.e. shallow to deep) of moist convection. For every model column a displacement matrix is calculated that is translated into displacement probabilities for individual particles. 25
The model setup is similar to the one described by Stohl et al. (2000) and Stohl and Trickl (1999), but with an extended model domain stretching from −80◦W to 40◦E and from 25◦N to 82◦N and up to 16 km above ground level. This domain was filled
ACPD
3, 1109–1138, 2003 Forecast, observation and modelling of a deep stratospheric intrusion event P. Zanis et al. Title Page Abstract Introduction Conclusions References Tables Figures J I J I Back CloseFull Screen / Esc
Print Version Interactive Discussion
homogeneously with particles on 12 June 2001. Only stratospheric particles were con-sidered; tropospheric ones were removed from the simulation. Whether a particle is stratospheric or not was determined using the dynamical definition of the tropopause based on a threshold value for the potential vorticity (PV) of 2 potential vorticity units (pvu, 1 pvu= 1 × 10⁻⁶m2K kg−1s−1). During the 12-day simulation particles are cre-5
ated in the stratosphere at the inflowing boundary, and are destroyed at the outflowing boundary. Approximately 4.5 million particles were present at any time during the sim-ulation.
Each particle carries a certain amount of ozone so that initial ozone concentrations follow the relationship with PV: O3 [ppb] = S [ppb/pvu] × PV [pvu] (Danielsen, 1968; 10
Beekmann et al., 1994). Based on ozonesonde data for the lower stratosphere, Stohl et al. (2000) found S= 60 (51) ppb/pvu for the month of June (July). Therefore, a value of S= 55 ppb/pvu was used here. Ozone is a passive tracer in the model, but is subject to dry deposition at the surface.
Furthermore, this study contributes in validating the ozone fields produced daily from 15
the ECMWF operational atmospheric model. Analysis data are produced four times per day at 00:00, 06:00, 12:00 and 18:00 UTC (http://www.ecmwf.int/services/archive). To our knowledge, this is the first validation of a chemical tracer that is used operationally in a weather forecast model.
3. Results
20
3.1. Description of the synoptic situation
According to ECMWF analysis, the synoptic situation on 18 June 2001 was character-ized by a deep upper-level trough at 500 hPa, extending from Scandinavia to the north of Italy and central Europe. By 19 June 2001 the upper level trough started to detach from the main flow over northern Europe with a large cut-off low developing over south-25
ACPD
3, 1109–1138, 2003 Forecast, observation and modelling of a deep stratospheric intrusion event P. Zanis et al. Title Page Abstract Introduction Conclusions References Tables Figures J I J I Back CloseFull Screen / Esc
Print Version Interactive Discussion
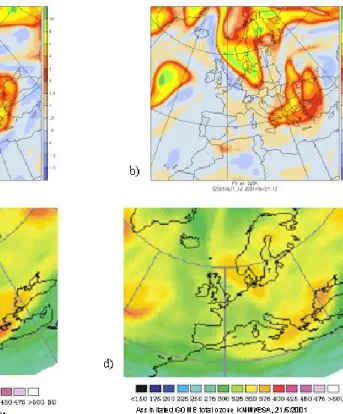
22 June 2001 the cut-off low re-connected to the main flow over northern Europe, and the upper-level trough gradually dissipated. The development of the synoptic situation is documented in Fig. 2, which shows potential vorticity (PV) on the 325 K isentropic surface on 20 and 21 June at 12:00 UT. A hook-shaped streamer of high PV values extends southwards and turns cyclonically on 20 June (Fig. 2a). This high- streamer 5
broke up on 21 June and part of it rolled up in the developing cut-off low (Fig. 2b). The evolution of this upper-level feature is also evident in the respective GOME total column ozone measurements. The GOME total ozone maps show high values on 20 June (Fig. 2c) resembling the hook-shaped streamer of high PV on 20 June while the high total ozone values on 21 June (Fig. 2d) are clearly associated with the developed 10
cut-off low over southeastern Europe.
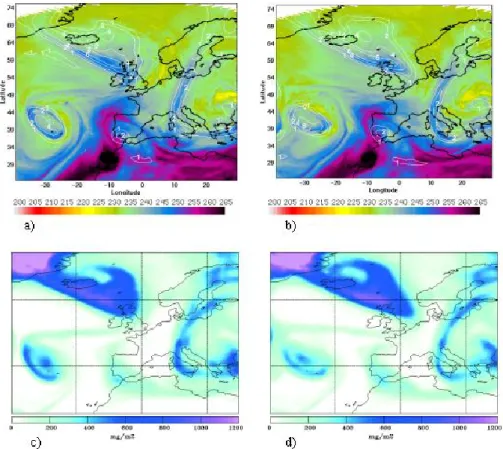
A consistent view of the stratospheric streamer of high PV and low humidity on 20 June is also obtained from the METEOSAT geostationary water vapour (WV) images (Figs. 3a and 3b), that are very useful in depicting the spatial extension of tongues of dry stratospheric air penetrating into the troposphere (Appenzeller et al., 1996b; 15
Cooper et al, 2001). Figures 3a and 3b, which represent the temperature (K) of the top layer of water in the atmosphere, indicate a streamer of dry air extending southwards on 20 June (at 00:00 and 06:00 UT) that coincides with the stratospheric streamer in Figs. 2a and 2b. The PV on the 350 hPa isobaric surface in Figs. 3a and 3b was calculated from the NCEP AVN data at 1 × 1 degree horizontal grid spacing and 50 hPa 20
vertical grid spacing. Thus Figs. 3a and 3b clearly indicate that air of stratospheric origin characterised with high PV and very low WV penetrates into the troposphere over central and southeastern Europe. The WV images from the previous days indicate that this streamer of dry air was present since 18 June 2001, initially located over western Europe extending from Belgium and Holland to southern France and gradually moving 25
eastwards over central Europe and southeastern Europe.
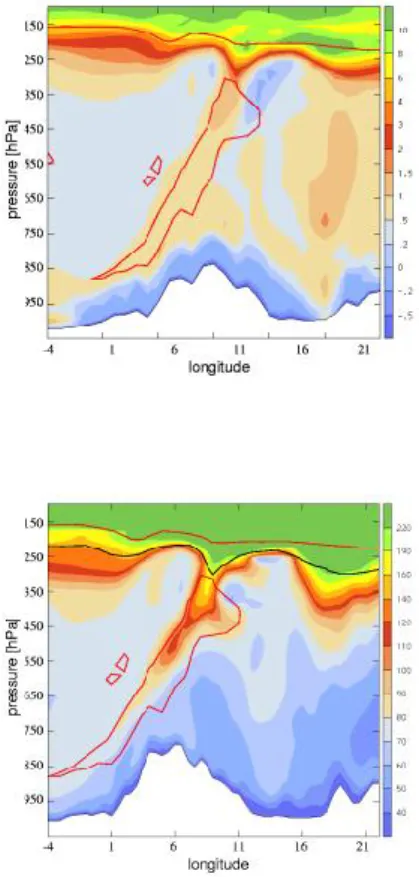
The vertical distribution of the high PV streamer on 20 June is illustrated by the W-E oriented vertical cross-sections of PV and RH over Jungfraujoch on 20 June at 12:00 UTC, based on the ECMWF analyses (Fig. 4a). They show a tongue of high
ACPD
3, 1109–1138, 2003 Forecast, observation and modelling of a deep stratospheric intrusion event P. Zanis et al. Title Page Abstract Introduction Conclusions References Tables Figures J I J I Back CloseFull Screen / Esc
Print Version Interactive Discussion
PV values associated with low RH. The PV values within the tongue range from 0.5 to 1.5 pvu suggesting mixing of the stratospheric air (PV>2 pvu) with the tropospheric air or other diabatic effects such as radiative erosion of PV. Ozone fields are analysed and forecast operationally along with the meteorological parameters at ECMWF since October 1999. Figure 4b, which shows the ECMWF ozone fields along the same cross-5
section, clearly indicates an intrusion of stratospheric air rich in ozone down to the lower free troposphere that is correlated with the tongue of low RH and, in the upper part, elevated PV values. As the air penetrates deeper in the troposphere, ozone decreases from about 100–120 ppbv at 450 hPa to about 80–90 ppbv at 650–700 hPa.
3.2. Profile observations 10
The profile measurements of ozone and RH at several stations within the dry streamer area provide observational evidence that stratospheric air penetrated deep into the tro-posphere. The ozonesonde and radiosonde measurements at Uccle,Belgium (50.8◦N, 4.35◦E) Payerne, Switzerland (46.49◦N, 6.57◦E) and Hohenpeissenberg, Germany (47.8◦N, 11.0◦E) on 18 and 20 June 2001 provided snapshots of the vertical distribu-15
tion of ozone and RH indicating dry layers rich in ozone (Fig. 5). An ozonesonde was launched from Uccle, into the dry streamer at 11:00 UTC 18 June, detecting a layer between 500 and 400 hPa with ozone values up to 140 ppbv and RH less than 10% (Fig. 5a), while on 20 June (at 11:00 UTC) two dry layers (RH at about 20%) were measured with ozone up to 80 and 90 ppbv at about 600 and 500 hPa, respectively 20
(Fig. 5b). At Payerne, there is a minor peak of ozone up to 80 ppbv at 500 hPa on 18 June at 11:00 UTC (Fig. 5c) but on 20 June a large ozone peak up to 90 ppbv is revealed in the lower free troposphere down to 650 hPa (at 11:00 UTC) associated with very dry air (RH<20%) (Fig. 5d). At Hohenpeissenberg, minor structures are seen on 18 June (at 05:00 UTC) but on 20 June (at 05:00 UTC) a very prominent peak of ozone 25
up to 140 ppb is captured at 400 hPa associated with very dry air (RH<20%) (Fig. 5f). The peak at Hohenpeissenberg on 20 June is higher up compared to the ozone peak at 650 hPa at Payerne but the launch time of the ozonesonde was 6 h earlier.
ACPD
3, 1109–1138, 2003 Forecast, observation and modelling of a deep stratospheric intrusion event P. Zanis et al. Title Page Abstract Introduction Conclusions References Tables Figures J I J I Back CloseFull Screen / Esc
Print Version Interactive Discussion
The radiosonde profiles at San Pietro Capofume (not shown here), which is located close to Mt. Cimone in northern Italy, indicate a very dry layer (RH<10%) between 500 and 600 hPa at 00:00 UTC on 21 June while 12 h later a very dry layer is located between 700 and 600 hPa. Finally, the radiosonde profiles at Thessaloniki (not shown here) indicate very dry air (RH<10%) between 4 and 6 km on 23 June 2001 at 06:00 5
and 12:00 UTC but not on the previous days.
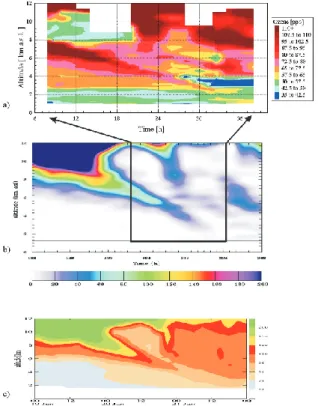
The ozone lidar measurements are extremely valuable because they have the ad-vantage of providing continuous ozone profile measurements, which may capture the evolution of an intrusion event. The time-height-plot of the ozone lidar measurements at Garmisch-Partenkirchen, Germany, on 20–21 June 2001 captures the evolution of a 10
rather complex episode with two marked tongues of elevated ozone with about 150 ppb shortly after the beginning of the measurements and a minor isolated structure with el-evated ozone (Fig. 6a). This minor isolated structure with elel-evated ozone is observed at 3 km and horizontally intersected the Zugspitze summit on 20 June, which is charac-terized by relative humidity values around 28% and a peak ozone mixing ratio of around 15
70 ppb (see Fig. 7a), in agreement with the lidar measurements. The meteorological analysis indicates that the observed descending tongues of elevated ozone is not an intrusion actively descending over Garmisch but the horizontal advection (west to east) of a pre-existing sloped feature as shown in Fig. 4. The faster the horizontal advec-tion, the faster the apparent descent. The first marked tongue could be traced with 20
the lidar over an exceptional vertical range from almost 8 km down to about 2 km a.s.l. This tongue is characterised by a gradual decrease of ozone as it penetrates deeper in the troposphere possibly due to dilution. For example, ozone is about 100 ppbv at 6 km, about 80 ppbv at 4 km after 6 h, and then about 65 ppbv at 2 km after the next 8 h (Fig. 6a). The model simulations (Sect. 3.4, Figs. 6b and 6c) suggest that the lidar 25
missed the beginning of the folding event by just a few hours and that the lidar almost looked into the stratosphere at the beginning of the observational period. Very special are the two steep downward steps in the lidar data at about 6 p.m. (June 20) and 6 a.m. (June 21). These steps are nicely reproduced by the FLEXPART model simulation
ACPD
3, 1109–1138, 2003 Forecast, observation and modelling of a deep stratospheric intrusion event P. Zanis et al. Title Page Abstract Introduction Conclusions References Tables Figures J I J I Back CloseFull Screen / Esc
Print Version Interactive Discussion
(Fig. 7b, see Sect. 3.4). The second sloped feature started to form in the uppermost troposphere at about midnight between 20 and 21 June and is followed down to almost 4 km. This is the first case during which a tropopause fold could be observed with the IFU lidar from its inception.
3.3. Surface observations 5
The surface measurements of humidity ozone and of the cosmogenic radionuclides
7
Be and 10Be at the Alpine peak stations Jungfraujoch and Zugspitze show that the stratospheric intrusion was, indeed, detectable down to 3000 m. At Zugspitze, there is clear evidence that the intrusion reached that height as RH drops down to 20% on 20 and 21 June, while ozone rises by about 17 ppbv from 52 to 69 ppbv on 20 June and 10
by about 13 ppbv from 58 to 71 ppbv on 21 June (Fig. 7a). The daily7Be activity con-centrations increase from near the detection limit of 0.1 mBq/m3(591 atoms/m3) on 19 June to 7.6 mBq/m3(5.0×104atoms/m3) on 20 June and remain at these high levels for several days. The daily10Be activity concentrations measured on 20, 21 and 22 June also remain at rather high levels, ranging from about 8.5 × 10⁴to 9.2 × 10⁴atoms/m3. 15
Although there are no10Be measurements on the previous days, the10Be measure-ments during 20, 21, and 22 June are among the highest 25% of all the10Be samples from Zugspitze during the years 2000 and 2001 (3rd quartile = 7.4 × 10⁴atoms/m3) (Zanis et al., 2003). The ratios of10Be/7Be, which is a stratospheric tracer not affected by washout, remain rather constant on 20, 21 and 22 June, ranging from 1.71 to 1.90. 20
However, it should be noted that in contrast to10Be and7Be measurements, these ra-tios are not among the highest 25% of all the10Be/7Be values determined for Zugspitze during the years 2000 and 2001 (3rd quartile= 2.1).
At Jungfraujoch, there is also a clear observational evidence that the intrusion reached that height as RH drops down to 20% on 20 June, while ozone rose by 25 ppbv 25
from 60 up to 85 ppbv (Fig. 7b). The ozone increase at Jungfraujoch on 20 June is in agreement with the ozone profile data at Payerne on 20 June which show an ozone peak at 650 hPa or about 3500 m a.s.l. (Fig. 3d). Back trajectory analysis (not shown
ACPD
3, 1109–1138, 2003 Forecast, observation and modelling of a deep stratospheric intrusion event P. Zanis et al. Title Page Abstract Introduction Conclusions References Tables Figures J I J I Back CloseFull Screen / Esc
Print Version Interactive Discussion
here) below, at the same level, and above Jungfraujoch on 12:00 and 18:00 UTC indi-cates that air masses descended from about 300 and 400 hPa over the north Atlantic region down to 650 and 700 hPa.
However, the bi-daily7Be activity concentrations decrease from about 7.5 mBq/m3on 18–19 June to 2.1 mBq/m3on 20–21 June. Similarly, the bi-daily10Be activity concen-5
trations decrease from about 12.7×10⁴atoms/m3on 18–19 June to 4.5×10⁴atoms/m3 on 20–21 June. The7Be and10Be activity concentrations on 20–21 June are among the lowest 25% of all the7Be and10Be measurements carried out at Jungfraujoch dur-ing the years 2000 and 2001, respectively (7Be: 1st quartile= 3.83 mBq/m3,10Be: 1st quartile= to 4.98×10⁴atoms/m3) (Zanis et al., 2003). These low7Be and10Be activity 10
concentrations on 20–21 June could be attributed to wet scavenging on 21 June as RH increases and stays close to saturation during almost the whole day. In contrast, the
10
Be/7Be ratio value increases by 23% from 2.6 on 18–19 June to 3.2 on 20–21 June, thus providing evidence that in occasions of wet scavenging the10Be/7Be ratio can still be a valid stratospheric tracer although7Be and10Be are not. These ratio values are 15
among the highest 25% of all the10Be/7Be values measured at Jungfraujoch during the years 2000 and 2001 (3rd quartile= 2.4).
3.4. FLEXPART and ECMWF model calculations
At upper tropospheric levels, the tracer simulation of the FLEXPART model with the ozone tracer column between 5500 and 11000 m (Fig. 3c and 3d) can be compared 20
to the WV images (Figs. 3a and 3b). Although such a comparison is not quantitative, structures seen in the tracer column should coincide with dry regions in the WV image. However, if moist air lies above the dry intrusion, the latter may be masked from the satellite’s view and thus some structures may be missing in the WV images. As the tracer plots are 3-h averages, tracer structures are smoothed and may show less fine-25
scale structure than the WV images. The ozone tracer columns between 5500 and 11000 m on 20 June at 00:00 and 06:00 UTC, illustrated in Figs. 3c and 3d, are in very good agreement with WV images (Figs. 3a and 3b), resembling in space the streamer
ACPD
3, 1109–1138, 2003 Forecast, observation and modelling of a deep stratospheric intrusion event P. Zanis et al. Title Page Abstract Introduction Conclusions References Tables Figures J I J I Back CloseFull Screen / Esc
Print Version Interactive Discussion
of dry air with high PV values on the 350 hPa surface extending southwards.
The time-height cross section of the FLEXPART ozone tracer over Garmisch-Partenkirchen is compared with the respective time-height cross section of ozone retrieved from the IFU lidar measurements (Fig. 6a). The FLEXPART ozone tracer time-height section (Fig. 6b) shows two separate tongues of stratospheric ozone de-5
scending into the troposphere, separated by a region without stratospheric tracer. The maximum descending to below 4 km corresponds well with the high-ozone filament seen in the lidar data, the smaller one in the middle of the observation period with the observed ozone maximum at an altitude of approximately 10 km on 20 June at 22:00 UTC. Both are clearly separated in the measurements by ozone concentrations 10
below 50 ppb, which are typical of the troposphere. The ozone maxima observed at the end of the measurement period at 5 km and 8 km are not present in the model simulation, but a tracer maximum is seen just after the end of the observations. Gener-ally, FLEXPART slightly underestimates the observed ozone concentrations within the stratospheric filaments, possibly due to a too low O3-PV relationship used in the initial-15
isation, the neglect of tropospheric O3and the insufficient vertical resolution. However, the most important structures such as the two steps mentioned in Sect. 3.2 are well represented, confirming the stratospheric nature of the two observed high-ozone fila-ments and demonstrating the success with which FLEXPART captures the details.
Furthermore the time-height cross section of ozone retrieved from the IFU lidar mea-20
surements provides an excellent opportunity to validate the ECMWF ozone which is a newly available product analysed and forecast operationally along with the meteoro-logical parameters at ECMWF since October 1999. The ECMWF ozone time-height section over Garmisch-Partenkirchen during the same event (Fig. 6c) captures suc-cessfully the two separate tongues of stratospheric ozone descending into the tropo-25
sphere down to 4 km. Although the minor structures found in the lidar measurements cannot be seen in ECMWF ozone due to the coarse resolution of the ECMWF model, the most important features, however, compare very well with the lidar observations even though the O3chemistry in the ECMWF model is only represented in a simplified
ACPD
3, 1109–1138, 2003 Forecast, observation and modelling of a deep stratospheric intrusion event P. Zanis et al. Title Page Abstract Introduction Conclusions References Tables Figures J I J I Back CloseFull Screen / Esc
Print Version Interactive Discussion
way. This suggests that coupling chemistry and weather forecast models may signifi-cantly improve both weather and chemical forecasts in the future. To our knowledge, this is the first validation of a chemical tracer that is used operationally in a weather forecast model. At the time of our case study, ozone observations were not yet as-similated into the ECMWF model. With the assimilation of ozone observations, which 5
was started only recently (A. Hollingsworth, personal communication), the agreement would perhaps have been even better. Even more so, the quality of the ECMWF ozone data in this case is surprising.
4. Conclusions
In order to cover a substantial amount of startospheric intrusions within the framework 10
of the EU-project STACCATO, co-ordinated measurements during short campaigns were carried out based on forecast trajectories. These stratospheric intrusion forecast, which were based on forecast data from the ECMWF, aided the measurement groups with the set-up and planning of the observations. One of the forecast STE events en-countered during the STACCATO period was followed by the measurements network 15
from its inception, providing clear observational evidence of a complex deep strato-spheric intrusion event. Both this case study and other events that were succesfully forecast during STACCATO (Galani et al., 2003) proved that these STE forecasts are valuable in planning co-ordinated measurements.
The ozone tracer columns calculated with the FLEXPART model were found to be 20
in good agreement with water vapour satellite images, capturing the evolution of the observed dry streamers of stratospheric origin. In addition, to the best of our knowl-edge, the first concurrent measurements of the cosmogenic radionuclides 10Be and
7
Be and their ratio 10Be/7Be are presented in a case study of a stratospheric intru-sion. At Jungfraujoch, the10Be/7Be ratio value increased by 23% from 18–19 June to 25
20–21 June, in contrast to the7Be and 10Be mesurements that showed a decrease, thus implying that in occasions of wet scavenging the10Be/7Be ratio can still be a valid
ACPD
3, 1109–1138, 2003 Forecast, observation and modelling of a deep stratospheric intrusion event P. Zanis et al. Title Page Abstract Introduction Conclusions References Tables Figures J I J I Back CloseFull Screen / Esc
Print Version Interactive Discussion
stratospheric tracer although7Be and10Be cannot.
Among the considerable amount of data providing the observational evidence for the presented STT event, the ozone lidar observations at Garmisch-Partenkirchen should be emphasised as they captured the evolution of the descending filaments down to almost 2 km advected over Garmisch. This excellent data set was used to validate the 5
FLEXPART model and also for the first time the ECMWF ozone, which is a recently available product analysed and forecast operationally along with the meteorological parameters since October 1999. Generally, FLEXPART slightly underestimated the observed ozone concentrations within the stratospheric filaments, possibly due to a too low O3-PV relationship used in the initialisation and the the insufficent vertical res-10
olution but however, the most important structures were well represented thus demon-strating the success with which FLEXPART captures the details. Finally, the ozone product from ECMWF model gave a correct picture of the event with the most important features in good agreement with the lidar observations even though the O3 chemistry in the ECMWF model is only represented in a simplified way, thus suggesting that cou-15
pling chemistry and weather forecast models may significantly improve both weather and chemical forecasts in the future.
Acknowledgement. This study was carried out within STACCATO (Contract No.
EVK2-CT1999-00050), a project funded by the European Commission under the Fifth Framework Programme. We also thank the Swiss Meteorological Institute (SMI) at Payerne for providing the ozonesonde 20
data. ECMWF and Deutscher Wetterdienst are acknowledged for providing access to the ECMWF archives. Meteosat water vapour images were provided by Space Science and Engi-neering Center, University of Wisconsin-Madison. The work by IFU and TUM was also funded by the German Bundesministerium f ¨ur Bildung und Forschung (BMBF) within the ATMOFAST project. The sampling and delivery of the air filter samples from Jungfraujoch was carried out 25
by EMPA, D ¨ubendorf, Switzerland. Relative humidity data for the Jungfraujoch were provided by Meteo Schweiz, Kundendienst Bodendaten, Z ¨urich. We thank the Swiss Agency for the Environment, Forests and Landscape, BUWAL, for the ozone data measured at the Jungfrau-joch. This work was also funded in part by the Bundeamt fuer Bildung und Wissenschaft, BBW, Berne, Switzerland.
ACPD
3, 1109–1138, 2003 Forecast, observation and modelling of a deep stratospheric intrusion event P. Zanis et al. Title Page Abstract Introduction Conclusions References Tables Figures J I J I Back CloseFull Screen / Esc
Print Version Interactive Discussion
References
Ancellet, G., Pelon, J., Beekmann, M., Papayannis A., and Megie G.: Ground-based lidar studies of ozone exchanges between the stratosphere and the troposphere, J. Geophys. Res., 96, D12, 22 401–22 421, 1991.
Appenzeller, C., Holton, J. R., and Rosenlof, K. H.: Seasonal variation of mass transport across 5
the tropopause, J. Geophys. Res., 101, D10, 15 071–15 078, 1996a.
Appenzeller, C., Davies, H. C., and Norton, W. A.: Fragmentation of stratospheric intrusions, J. Geophys. Res., 101, D1, 1435–1456, 1996b.
Austin, J. F. and Follows, M. J.: The ozone record at Payerne: An assessment of the cross-tropopause flux. Atmos. Environ., 25A, 9, 1873–1880, 1991.
10
Beekmann, M., Ancellet, G., and M ´egie, G.: Climatology of tropospheric ozone in southern Europe and its relation to potential vorticity, J. Geophys. Res., 99, 12841–12853, 1994. Chameides, W. and Walker, J. C. G.: A photochemical theory of tropospheric ozone, J.
Geo-phys. Res., 78, 36, 8751–8760, 1973.
Cooper, O. R., Moody, J. L., Davenport, J. C., Oltmans, S. J., Johnson, B. J., Chen, X., Shep-15
son, P. B., and Merrill, J. T.: The influence of springtime weather systems on vertical ozone distributions over three North American site, J. Geophys. Res., 103, 22 001–22 013, 1998. Cooper, O. R., Moody, J. L., Parrish, D. D., Trainer, M., Holloway, J. S., Ryerson, T. B., H ¨ubler,
G., Fehsenfeld, F. C., Oltmans, S. J., and Evans, M. J.: Trace gas signatures of the airstreams within North Atlantic cyclones – Case studies from the NARE’97 aircraft intensive, J. Geo-20
phys. Res., 106, 5437–5456, 2001.
Crutzen, P. J.: A discussion of the chemistry of some minor constituents in the stratosphere and troposphere, Pure Appl. Geophys., 106–108, 1385–1399, 1973.
Danielsen, E. F.: Stratospheric-tropospheric exchange based on radioactivity, ozone and po-tential vorticity, J. Atmos. Sci., 25, 502–518, 1968.
25
Davies, T. D. and Schuepbach, E.: Episodes of high ozone concentrations at the earth’s surface resulting from transport down from the upper troposphere/lower stratosphere: A review and case studies, Atmos. Environ., 28, 1, 53–68, 1994.
Dibb, J. E., Meeker, L. D., Finkel, R. C., Southon, J. R., Caffee, M. W., and Barrie, L. A.: Estimation of the stratospheric input to the Arctic troposphere: 7Be and10Be in aerosols at 30
Alert, Canada. J. Geophys. Res., 99, 12 855–12 864, 1994.
Read-ACPD
3, 1109–1138, 2003 Forecast, observation and modelling of a deep stratospheric intrusion event P. Zanis et al. Title Page Abstract Introduction Conclusions References Tables Figures J I J I Back CloseFull Screen / Esc
Print Version Interactive Discussion
ing, UK, 1995.
Eisele, H., Scheel, H. E., Sladkovic, R., and Trickl, T.: High-resolution lidar measurements of stratosphere-troposphere exchange, J. Atmos. Sci., 56, 319–330, 1999.
Elbern, H., Kowol, J., Sladkovic, R., and Ebel, A.: Deep stratospheric intrusions: A statistical assessment with model guided analyses, Atmos. Environ., 31, 19, 3207–3226, 1997. 5
Emanuel, K. A. and Zivkovic-Rothman, M.: Development and evaluation of a convection scheme for use in climate models, J. Atmos. Sci., 56, 1766–1782, 1999.
Fabian, P. and Pruchniewicz, P. G.: Meridional distribution of ozone in the troposphere and its seasonal variations, J. Geophys. Res., 82, 2063–2073, 1977.
Follows, M. J. and Austin, J. F.: A zonal average model of the stratospheric contributions to the 10
tropospheric ozone budget, J. Geophys. Res., 97, D16, 18 047–18 060, 1992.
Forster, C., Stohl, A., James, P. and Thouret, V.: The residence times of aircraft emissions in the stratosphere using a mean emissions inventory and emissions along actual flight tracks, J. Geophys. Res., in press, 2003.
Galani, E., Balis, D., Zanis, P., Zerefos, C. S., Papayannis, A., Wernli, H., and Gerasopoulos, 15
E.: Observations of Stratosphere-Troposphere Exchange events over eastern Mediterranean using a ground-based lidar system, J. Geophys. Res., in press, 2003.
Gerasopoulos, E., Zanis, P., Stohl, A., Zerefos, C.S., Papastefanou, C., Ringer, W., Tobler, L., Huebener, S., Kanter, H.J., Tositti, L., and Sandrini, S.: A climatology of 7Be at four high-altitude stations at the Alps and the Northern Apennines, Atmos. Environ., 35/36, 6347– 20
6360, 2001.
Harris, J. M., Oltmans, S. J., Dlugokencky, E. J., Noveli, P. C., Johnson, B. J., and Mefford, T.: An investigation into the source of springtime tropospheric ozone maximum at Mauna Loa Observatory, Geophys. Res. Lett., 25, 11, 1895–1898, 1998.
Holton, J. R., Haynes, P. H., McIntyre, E. M., Douglass, A. R., Rood, R. B., and Pfister, L.: 25
Stratosphere-troposphere exchange, Rev. Geophys., 33, 403–439, 1995.
James, P., Scheel, H. E., Stohl, A., and Trickl, T.: Deep Stratospheric Air Intrusions Case Stud-ies and Climatology, Procced. of EUROTRAC Symposium 2002, P. M. Midgley, M. Reuther, Eds., Margraf Verlag (Germany 2002), contribution TOR-12 (5 pp. on CD), 2002.
James, P., Stohl, A., Forster, C., Eckhardt, S., Seibert P., and Frank, A.: A 15-year climatology 30
of stratosphere-troposphere exchange with a Lagrangian particle dispersion model, Part A: Methodology and mean climate, J. Geophys. Res., in press, 2003.
Tel-ACPD
3, 1109–1138, 2003 Forecast, observation and modelling of a deep stratospheric intrusion event P. Zanis et al. Title Page Abstract Introduction Conclusions References Tables Figures J I J I Back CloseFull Screen / Esc
Print Version Interactive Discussion
lus, 14, 363–377, 1962.
Kentarchos, A. S., Roelofs, G. J., Lelieveld, J., and Cuevas, E.: On the origin of elevated surface ozone concentrations at Izana Observatory, Tenerife during late March 1996, Geophys. Res. Lett., 27, 22, 3699–3702, 2000.
Langford, A. O., Masters, C. D., Proffitt, M. H., Hsie, E. Y., and Tuck, A. F.: Ozone measure-5
ments in a tropopause fold associated with a cut-off low system, Geophys. Res. Lett., 23, 18, 2501–2504, 1996.
Lelieveld, J. and Dentener, F.: What controls tropospheric ozone, J. Geophys. Res., 105, 3, 3543–3563, 2000.
Logan, J. A.: Tropospheric Ozone: Seasonal Behavior, Trends, and Anthropogenic Influence, 10
J. Geophys. Res., 90, D6, 10 463–10 482, 1985.
Monks, P. S.: A review of observations and origins of the spring ozone maximum, Atmos. Environ., 34, 21, 3545–3561, 2000.
Penkett, S. A. and Brice, K. A.: The spring maximum in photo-oxidant in the Northern hemi-sphere tropohemi-sphere, Nature, 319, 655–657, 1986.
15
Raisbeck, G. M., Yiou, F., Fruneaou, M., Loiseaux, J. M., Lieuvin, M., and Ravel, J. C.: Cosmo-genic Be-10/Be-7 as a probe for atmospheric transport processes, Geophys. Res. Lett., 8, 1015-1018, 1981.
Roelofs, G. J. and Lelieveld, J.: Model study of the influence of cross-tropopause O3transports on tropospheric O3levels, Tellus, 49B, 38–55, 1997.
20
Schuepbach, E., Davies, T. D., and Massacand, A. C.: An unusual springtime ozone episode at high elevation in the Swiss Alps; contributions both from cross-tropopause exchange and from the boundary layer, Atmos. Environ., 33, 1735–1744, 1999a.
Schuepbach, E., Davies, T. D., Massacand, A. C., and Wernli, H.: Mesoscale modelling of vertical atmospheric transport in the Alps associated with the advection of a tropopause fold 25
a winter ozone episode, Atmos. Environ., 33, 3613–3616, 1999b.
Singh, H. B., Ludwig, F. L., and Johnson, W. B.: Tropospheric ozone: Concentrations and variabilities in clean remote atmospheres, Atmos. Environ., 12, 2 185–2 196, 1978.
Sprenger, M., and Wernli, H.: A northern hemispheric climatology of cross-tropopause ex-change for the ERA15 time period (1979–1993), J. Geophys. Res., in press, 2003.
30
Stohl, A., Hittenberger, M., and Wotawa, G.: Validation of the Lagrangian particle dispersion model FLEXPART against large scale tracer experiment data, Atmos. Environ., 32, 4245– 4264, 1998.
ACPD
3, 1109–1138, 2003 Forecast, observation and modelling of a deep stratospheric intrusion event P. Zanis et al. Title Page Abstract Introduction Conclusions References Tables Figures J I J I Back CloseFull Screen / Esc
Print Version Interactive Discussion
Stohl, A. and Trickl, T.: A textbook example of long-range transport: Simultaneous observation of ozone maxima of stratospheric and North American origin in the free troposphere over Europe, J. Geophys. Res., 104, 30 445–30 462, 1999.
Stohl, A., Spichtinger-Rakowsky, N., Bonasoni, P., Feldmann, H., Memmesheimer, M., Scheel, H. E., Trickl, T., Hubener, S., Ringer W., and Mandl, M.: The influence of stratospheric 5
intrusions on alpine ozone concentrations, Atmos. Environ., 34, 9, 1323–1354, 2000. Stohl, A., Bonasoni, P., Cristofanelli, P., Collins, W., Feichter, J., Frank, A., Forster, C.,
Gera-sopoulos, E., G ¨aggeler, H., James, P., Kentarchos, T., Kreipl, S., Kromp-Kolb, H., Kr ¨uger, B., Land, C., Meloen, J., Papayannis, A., Priller, A., Seibert, P., Sprenger, M., Roelofs, G. J., Scheel, E., Schnabel, C., Siegmund, P., Tobler, L., Trickl, T., Wernli, H., Wirth, V., Zanis, P., 10
and Zerefos, C.: Stratosphere-troposphere exchange – A review and what we have learned from STACCATO, J. Geophys. Res., in press, 2003.
Wernli, H.: A Lagrangian-based analysis of extratropical cyclones. II: A detailed case study, Q. J. R. Meteorol. Soc., 123, 1677–1706, 1997.
Wernli, H. and Bourqui, M.: A Lagrangian “1-year climatology” of (deep) cross-tropopause 15
exchange in the extratropical Northern Hemisphere, J. Geophys. Res., 107, D2, 4021, doi:10.1029/2001JD000812, 2002.
World Meteorological Organization (WMO): Atmospheric ozone 1985, vol. 1, Rep. 16, 1986. Zanis, P., Gerasopoulos, E., Priller, A., Schnabel, C., Stohl, A., Zerefos, C. S., G ¨aggeler, H.
W., Tobler, L., Kubik, P. W., Kanter, H. J., Scheel, H. E., Luterbacher, J., and Berger, M.: 20
An estimate of the impact of Stratosphere-to-Troposphere Transport (STT) on the lower free tropospheric ozone over the Alps using10Be and7Be measurements, J. Geophys. Res., in press, 2003.
ACPD
3, 1109–1138, 2003 Forecast, observation and modelling of a deep stratospheric intrusion event P. Zanis et al. Title Page Abstract Introduction Conclusions References Tables Figures J I J I Back CloseFull Screen / Esc
Print Version Interactive Discussion
Fig. 1. Example of an operational STE forecast based upon ECMWF forecast data for the time period 19–23 June 2001. The colour indicates the pressure value of the trajectories (in hPa).
ACPD
3, 1109–1138, 2003 Forecast, observation and modelling of a deep stratospheric intrusion event P. Zanis et al. Title Page Abstract Introduction Conclusions References Tables Figures J I J I Back CloseFull Screen / Esc
Print Version Interactive Discussion
Fig. 2. Isentropic PV on the 325 K surface on 20 June 2001, 12:00 UTC (a) and on 21 June 2001, 12:00 UTC(b) based on the ECMWF global analysis data. The asimilated GOME total ozone (KNMI/ESA) fields for 20 June 2001(c) and 21 June 2001 (d) are additionally shown for comparison with the PV fields.
ACPD
3, 1109–1138, 2003 Forecast, observation and modelling of a deep stratospheric intrusion event P. Zanis et al. Title Page Abstract Introduction Conclusions References Tables Figures J I J I Back CloseFull Screen / Esc
Print Version Interactive Discussion
Fig. 3. WV images on 20 June at 00:00 UTC (a) and 06:00 UTC (b). The colour scale repre-sents the temperature (K) of the top layer of water in the atmosphere. The PV on the 350 hPa surface calculated from the NCEP AVN data is marked in (a) and (b) with white contours in pvu. The ozone tracer columns between 5500 and 11000 m on 20 June at 00:00 UTC(c) and 06:00 UTC(d) calculated from the FLEXPART model are illustrated for comparison with the observations of WV.
ACPD
3, 1109–1138, 2003 Forecast, observation and modelling of a deep stratospheric intrusion event P. Zanis et al. Title Page Abstract Introduction Conclusions References Tables Figures J I J I Back CloseFull Screen / Esc
Print Version Interactive Discussion
Fig. 4. W-E oriented vertical cross-sections of PV (a) and ozone (b) over Jungfraujoch on 20 June at 12:00 UTC, based on the ECMWF global analysis data. The red line indicates low RH (15%) while the black line in (b) indicates the dynamical tropopause (PV= 2 pvu). The W-E oriented vertical cross section of PV at the latitude of Jungfraujoch (46.53◦N, 7.98◦E) ranges from 4◦W to 26◦E.
ACPD
3, 1109–1138, 2003 Forecast, observation and modelling of a deep stratospheric intrusion event P. Zanis et al. Title Page Abstract Introduction Conclusions References Tables Figures J I J I Back CloseFull Screen / Esc
Print Version Interactive Discussion
Fig. 5. Profile measurements of ozone and RH based on ozonesonde launches on 18 and 20 June 2001 at Uccle ((a) and (b)) at 11:00 UTC, at Payerne ((c) and (d)) at 11:00 UTC and at Hohenpeissenberg ((e) and (f)) at 05:00 UTC.
ACPD
3, 1109–1138, 2003 Forecast, observation and modelling of a deep stratospheric intrusion event P. Zanis et al. Title Page Abstract Introduction Conclusions References Tables Figures J I J I Back CloseFull Screen / Esc
Print Version Interactive Discussion
Fig. 6. (a) Time-height section of the ozone lidar measurements at Garmisch-Partenkirchen during 20 and 21 June. (b) Time-height section through the FLEXPART ozone tracer field at the location of Garmisch-Partenkirchen. Time is given in hours from the start of the simulation; the plot covers the period from 19 June, 00:00 UTC to 22 June, 00:00 UTC. The black rectangle marks the period and altitude range of the lidar measurements. The horizontal line shows the height of the model topography. (c) Time-height section through the ECMWF ozone field at the location of Garmisch-Partenkirchen for the period from 19 June, 00:00 UTC to 22 June, 00:00 UTC.
ACPD
3, 1109–1138, 2003 Forecast, observation and modelling of a deep stratospheric intrusion event P. Zanis et al. Title Page Abstract Introduction Conclusions References Tables Figures J I J I Back CloseFull Screen / Esc
Print Version Interactive Discussion
Fig. 7. Surface measurements of RH, ozone,7Be,10Be concentrations and their ratio10Be/7Be at Zugspitze(a) and at Jungfraujoch (b), during the period 18–25 June 2001. The7Be, 10Be concentrations and their ratio are daily values at Zugspitze and bi-daily at Jungfraujoch.