HAL Id: hal-00022674
https://hal-insu.archives-ouvertes.fr/hal-00022674
Submitted on 12 Apr 2006HAL is a multi-disciplinary open access archive for the deposit and dissemination of sci-entific research documents, whether they are pub-lished or not. The documents may come from teaching and research institutions in France or abroad, or from public or private research centers.
L’archive ouverte pluridisciplinaire HAL, est destinée au dépôt et à la diffusion de documents scientifiques de niveau recherche, publiés ou non, émanant des établissements d’enseignement et de recherche français ou étrangers, des laboratoires publics ou privés.
Experimental Constraints on Degassing and
Permeability in Volcanic Conduit Flow.
Alain Burgisser, James E. Gardner
To cite this version:
Alain Burgisser, James E. Gardner. Experimental Constraints on Degassing and Permeability in Vol-canic Conduit Flow.. Bulletin of Volcanology, Springer Verlag, 2005, 67, pp.1, 42-56. �10.1007/s00445-004-0359-5�. �hal-00022674�
Experimental Constraints on Degassing and Permeability in
Volcanic Conduit Flow
ALAIN BURGISSER1
[email protected], phone +1 907 474 5713, fax +1 907 474 7290
Alaska Volcano Observatory, Geophysical Institute, University of Alaska Fairbanks Fairbanks, AK 99775-7320 USA
JAMES E. GARDNER
[email protected], phone +1 512 471 0953, fax +1 512 471 9425 Department of Geological Sciences, The University of Texas at Austin
Austin, TX 78712-0254 USA
1Corresponding author
Word count: Abstract 314, Main text 7900
3 Tables, 13 Figures, 14 Equations In press for: Bulletin of Volcanology
Abstract
This study assesses the effect of decompression rate on two processes that directly influence the behavior of volcanic eruptions: degassing and permeability in magmas. We studied the degassing of magma with experiments on hydrated natural rhyolitic glass at high pressure and temperature. From the data collected, we defined and characterized one degassing regime in equilibrium and two regimes in disequilibrium. Equilibrium bubble growth occurs when the decompression rate is slower than 0.1 MPa s-1, while higher rates cause porosity to deviate rapidly from equilibrium, defining the first disequilibrium regime of degassing. If the deviation is large enough, a critical threshold of super-saturation is reached and bubble growth accelerates, defining the second disequilibrium regime. We studied permeability and bubble coalescence in magma with experiments using the same rhyolitic melt in open degassing conditions. Under these open conditions, we observed that bubbles start to coalesce at ~43 vol.% porosity, regardless of decompression rate. Coalescence profoundly affects bubble texture and size
distributions, and induces the melt to become permeable. We determined coalescence to occur on a time scale (~180 s) independent of decompression rate. We parameterized and incorporated our experimental results into a 1D conduit flow model to explore the implications of our findings on eruptive behavior of rhyolitic melts with low crystal contents stored in the upper crust.
Compared to previous models that assume equilibrium degassing of the melt during ascent, the introduction of disequilibrium degassing reduces the deviation from lithostatic pressure by ~ 25 %, the acceleration at high porosities (> 50 vol.%) by a factor 5, and the associated
decompression rate by an order of magnitude. The integration of the time scale of coalescence to the model shows that the transition between explosive and effusive eruptive regimes is sensitive
to small variations of the initial magma ascent speed, and that flow conditions near fragmentation may significantly be affected by bubble coalescence and gas escape.
Keywords: bubble growth, conduit flow, coalescence, decompression, degassing, rhyolite.
1. Introduction
The dynamics of bubble growth, although occurring on a small scale, directly affect the large-scale behavior of volcanic eruptions. Bubbles are present because water supersaturates in a magmatic liquid rising from depth, and water exsolution into the bubbles is the driving force that controls the growth of bubbles in the volcanic conduit. That growth causes the flow density to decrease, decompression rate to increase, and hence the flow to accelerate, possibly leading to an explosive eruption. Since the early work of Sparks (1978), bubble growth dynamics has been explored through increasingly complex numerical models (e.g., Barclay et al. 1995; Lyakhovsky et al. 1996; Proussevitch et al. 1993a; Proussevitch and Sahagian 1998; Sparks et al. 1994; Toramaru 1989; 1995) and experimental work (e.g., Gardner et al. 1999; 2000; Mangan and Sisson 2000).
Because of the complex interdependences of the variables involved, many of the processes involved in bubbles growth remain unclear. In particular, the relation between growth and decompression rate and the role of bubble coalescence (or connectivity) are two poorly constrained processes that directly affect conduit flow dynamics. The highest decompression rates are suggested to arise in the conduit when bubbles grow in equilibrium with the magmatic liquid (Woods 1995). If equilibrium between bubbles and liquid is not maintained, however, the decrease in density of the mixture is reduced, which in turn reduces the decompression rate and flow acceleration. Bubble coalescence controls magma permeability, and possibly the transition
between explosive and effusive eruptive regimes (Yoshida and Koyaguchi 1999). If the magma can become permeable and lose part or all of its gas without fragmenting, it reduces its porosity, thus limiting further acceleration and possibly leading to effusive eruption (Eichelberger et al. 1986).
We conducted experiments on hydrated natural rhyolitic glass at high pressure and
temperature, which allowed us to assess the effect of decompression rate on 1) bubble growth and 2) bubble coalescence. From experiments run under closed degassing conditions, we defined and characterized one growth regime in equilibrium and two regimes in disequilibrium. From experiments using the same rhyolitic melt in open degassing conditions, we determined the onset of bubble coalescence through its profound effect on bubble texture and size distributions. We determined the rate at which coalescence affects the bubble size distribution and linked
coalescence to melt permeability. Finally, we parameterized and incorporated our experimental results into a 1D conduit flow model to explore the implications of our findings on eruptive behavior. We discuss the consequences of disequilibrium degassing for conduit flow dynamics, and the role of connectivity in the transition between effusive and explosive regimes.
2. Methods
We conducted experiments on natural rhyolitic glass from the Panum Crater Dome (PCD; 75.6 wt.% SiO2 in glass, Mangan and Sisson 2000; Westrich and Eichelberger 1994). Small
cores (~ 7 mm length) were filed to fit into 3-mm diameter gold tubing. The tubing was welded shut after adding about 8 wt.% de-ionized water, to ensure saturation at the start of
decompression (saturated value: 4.21 wt.% at 825 °C and 150 MPa, this study). Capsules were weighed before and after welding to ensure that no water was lost. Capsules were then placed in
an externally heated pressure vessel fitted with a rapid-quench attachment, where they remained at 825 °C and 150 MPa for 5 days to allow the cores to saturate with water (Fig. 1). We ensured that runs quenched after this hydration period were bubble-free (see open-degassing runs below).
After the 5-days hydration, one set of samples (22 runs, Table 1) was decompressed instantaneously to 100 MPa and held for 15 minutes, which ensured the presence of a bubble population in equilibrium with the melt that is not influenced by nucleation kinetics. The samples were then isothermally decompressed from 100 MPa at rates that increased with lower pressure. Decompression rates were obtained by dropping instantly the appropriate amount of pressure every few seconds in a step-wise fashion to approximate a linear behavior between the pressures of interest. The time step was 20 s for all runs, except for the two fastest rates, 1 and 10 MPa s-1, which were obtained by 10 and 3 s steps, respectively. Lowering the sample into the water-cooled base of the vessel after the final decompression step quenched the samples. Errors on the pressures are less than 0.1 MPa and errors on the decompression rate are less than 5%, except for the fastest rate (20%).
A second set of samples (16 runs, Table 2) was quenched at 150 MPa after 5-days hydration. After inspection under microscope to ensure that the cores were bubble-free, the cores were reloaded into capsules without water, but with either silicate glass (powdered PCD rhyolitic glass) or MgO powder to serve as a sink for expelled water during decompression, allowing open-degassing conditions (Fig. 1). The capsules were then pressurized at 155 MPa and reheated to 825 °C for 5 minutes, decompressed instantaneously to 100 MPa and held for 15 minutes, and finally decompressed at constant rates to lower pressure and quenched. Errors on pressure and decompression rate are the same than that of the first set of runs.
The diameters of all bubbles within a given volume in thin section were measured using digital images (640×480 pixels) acquired in transmitted light. In the case of the deformed bubbles produced by connectivity, the diameter of a volume-equivalent sphere was taken. The size distribution of bubbles (BSD) of each sample (~ 150 bubbles) was constructed with three to six images, depending on bubble size. The number density of bubbles (BND) of each sample was calculated by multiplying the mean bubble volume given by the BSD with the value of porosity obtained for that sample (Gardner et al. 1999). Porosities were measured using similar digital images of thin sections acquired in reflected light. Errors in porosities were estimated from three images for most samples. Bubbles nucleated heterogeneously, in part on the Fe-Ti oxides present in the melt. Replicate runs show that the nucleated bubbles were similar in number in each experiment. We thus use changes in the BND to monitor for further nucleation and degree of coalescence during decompression.
3. Experimental results
On the basis of run AGB1 (Table 1), we conclude that the instantaneous pressure drop from the saturation pressure of 150 to 100 MPa at the beginning of each run created a unimodal population of bubbles. The melt features about 0.1 vol.% of crystals that are Fe-Ti oxides rods of ~10 µm in length. Both the modest initial super-saturation pressure (50 MPa) and the fact that most of the bubbles are attached to crystals suggest bubbles nucleated heterogeneously at the beginning of each run in both experimental sets (Hurwitz and Navon 1994). The number densities of bubbles in all the decompression runs are between 105-106 cm-3, which confirm the reproducibility of nucleation conditions (Table 1). Such densities correspond to a mean bubble diameter of ~35 µm at 100 MPa (ABG1, Table 1). The upper part of each sample in both
experimental sets contains elongated bubbles (Fig. 2). This region is more pronounced at low pressure, but is always smaller than a quarter of the total sample height. As discussed in Regimes of Bubble Growth (below), the likely cause of the elongation is the volumetric expansion of the sample within the gold capsule that forces the melt upward (cf. Fig. 1). We avoided this region when making porosity and BSD determinations.
3.1. Closed degassing runs
We built a set of experiments to assess the maximum decompression rates that permit equilibrium degassing. For each 20 MPa drop, the highest rate that maintained equilibrium was determined (Fig. 3). The porosity at equilibrium is calculated from the difference in water saturation between the initial pressure and a given pressure (cf. Equ. A8 in the Appendix). For example, the runs ABG3 and ABG8 both maintained equilibrium porosities at 0.1 MPa s-1 down to 60 MPa and were further decompressed to 40 MPa at 0.2 MPa s-1 and 0.15 MPa s-1,
respectively (Table 1). The former had a value of porosity less than expected from equilibrium, whereas the latter reached equilibrium porosity. The maximum decompression rate for the increment from 60 MPa down to 40 MPa is thus 0.175 ± 0.025 MPa s-1. We find that the maximum rates that guarantee equilibrium degassing range between 0.125 ± 0.025 MPa s-1 at high pressure (60-100 MPa) and 0.175 ± 0.025 MPa s-1 at low pressure (30-60 MPa, Fig. 3). We note that slower decompressions would all ensure equilibrium because these rates are maxima, and that they correspond to ascent velocities under a lithostatic load of ~6 m s-1.
We then explored the consequences on bubble growth of a constant decompression rate that exceeds the maximum equilibrium rate. After an initial pressure drop to 100 MPa, we
successively in 10 MPa increments (Figs. 4 and 5). From the successive values of how much porosity deviated from equilibrium, two distinct disequilibrium bubble growth regimes can be defined (Fig. 6). A slow growth rate regime occurs as the decompression rate first exceeds that of equilibrium. In this regime, porosity increasingly deviates from equilibrium as pressure decreases, but the magnitude of deviation does not change with decompression rate (Fig. 5). The slow growth can be illustrated by comparing the mean bubble diameter of a run in disequilibrium with its equilibrium counterpart, correcting for the difference in bubble number densities by multiplying the mean diameter by the ratio of the respective BND. At 80 MPa, for example, the mean bubble diameter reaches 38 µm in the slow growth regime (ABG20, Table 1) instead of 60×(10/22)1/3=48 µm in equilibrium (ABG6). A fast growth rate regime occurs where the magnitude of the deviation from equilibrium diminishes and finally vanishes at high porosities. In this regime, the faster pressure decreases, the faster bubbles grow (Fig. 5).
3.2. Open degassing runs
We explored the relationship between bubble coalescence and decompression rates, using an experimental setup that allowed open degassing conditions (Fig. 1). At high quench pressure, we observe that bubbles are aligned, forming chains of typically less than 20 unconnected bubbles (40 and 44 MPa runs in Fig. 7a). This spatial distribution differs noticeably from the random distribution of the bubbles present in closed-degassing runs. At low quench pressure, large bubbles have deformed shapes with low curvature surfaces (30 and 28 MPa runs in Fig. 7a). In most cases, these large bubbles are the product of the coalescence of two or more smaller bubbles, the original shapes of which can still be distinguished (e.g., 28 MPa run in Fig 7a). At slow decompression rates (0.025 MPa s-1), this change in bubble texture is dramatic (Fig. 7a),
whereas the change is more progressive at higher decompression rates (0.1 MPa s-1 and 0.5 MPa s-1, Fig. 7b).
In runs loaded with anhydrous rhyolite powder (Fig. 1), the powder melted during reheating to create a spherule of glass. At low quench pressure (<30 MPa), the spherules had a rim of bubbles, suggesting they absorbed water during the decompression. Since the only available excess water was within the hydrated samples, these rimmed spherules confirm gas was released from those samples. No analysis for absorbed water was conducted on the MgO powder because runs loaded with MgO displayed identical bubble textures than the ones loaded with rhyolite, suggesting a similar gas escape occurred. At a given quench pressure, the porosity values of open degassing runs are lower and more widespread than the ones of closed degassing runs at 0.1 MPa s-1 and 0.5 MPa s-1, which is consistent with the melt being permeable (Table 2). Most porosity values at 0.025 MPa s-1 are higher than the equilibrium values. Although no satisfying
explanation has been found for this shift, we note that the sample quenched just after having coalesced (PPE10) has a porosity 30 vol.% lower than its immediate neighbors, proving the link between coalescence and permeability. Therefore, the evidence of released water, the abundant coalesced bubbles, and the congruent decrease in porosity indicate that the melt was permeable at low pressure.
Bubble sizes record quantitatively the profound textural changes caused by connectivity (Fig. 8a). If we define the start of coalescence when the ratio of mean bubble diameter to the standard deviation of the BSD is close to unity, it occurs between 34 and 30 MPa (41 and 46 vol.%) at 0.025 MPa s-1, between 36 and 30 MPa (40 and 46 vol.%) at 0.1 MPa s-1, and between 30 and 25 MPa (44 and 50 vol.%) at 0.5 MPa s-1. It thus appears that connectivity starts at 43 ± 3 vol.%, regardless of decompression rate or run duration.
Bubble size distributions change dramatically from disconnected to connected runs (Fig. 8a). At low porosity, we note that the size distributions of bubbles in open degassing runs have a similar Gaussian shape, but a broader distribution than observed in closed system runs (Fig. 8b). At higher porosity, large bubble sizes appear in the distribution, the large end of which can be better described with a power law spanning up to one order of magnitude (Fig. 8c). The absence of the original peak around 200 µm in the distribution (Fig. 8a) leads us to qualify those runs as completely connected (<30 MPa). Size distributions of samples with porosities above 60 vol.% are uncertain, because of the low number of bubbles present (Table 2). The size distribution thus shifts from Gaussian to power-law as coalescence progresses, but unfortunately, the exact shape of the distribution of completely connected samples cannot be determined with certainty. Nevertheless, the size distributions of completely connected runs seem unchanged by further decompression, despite the high porosities reached (Fig. 8a). The bubble number densities of open-system equilibrium runs are similar to closed-system runs and do not significantly vary with coalescence (Table 2).
The pressure range over which connectivity becomes complete increases as the
decompression rate increases (Fig. 9). At 0.025 MPa s-1, connectivity is complete within an interval of 4 MPa, whereas at 0.5 MPa s-1, connectivity is incomplete after 15 MPa
decompression. The completion time for connectivity can be retrieved from the decompression rates and the pressure range. This time seems to be rate-independent and lies between 160 and 180 s (Fig. 9). Although coalescence is homogeneous within the main body of a given sample, we observe coalescence to begin at higher quench pressure in the top part of the samples, where elongated bubbles occur (Fig. 2). This earlier onset of coalescence of the elongated bubbles occurs regardless of decompression rate.
Similarly sized bubbles seem to coalesce in two phases. During the first phase, neighboring bubbles start to deform during growth, creating a planar film of liquid between them (Fig. 10). The second phase occurs when the thinning film between the bubbles fails. Our smallest measured film thickness is on the order of 1 µm (G303), which suggests that the film disrupts when it reaches a thickness less than 1 µm (Klug and Cashman 1996; Navon and Lyakhovsky 1998). The coalesced bubbles present a deformed shape with low curvature surface. We did not observe the relaxation of coalesced bubbles to spherical shape, most likely because the time needed for such relaxation is on the order of hours at the viscosities considered herein (our calculations follows Toramaru 1995).
4. Discussion
4.1. Regimes of bubble growth
The complexity of bubble growth in reaction to a sudden pressure drop is well established (e.g., Proussevitch and Sahagian 1998). Growth caused by a constant decompression rate, however, can be approximated from our experiments by two simple disequilibrium regimes (slow and fast growth rates, Fig. 5). This suggests that one of the main variables (sample volume, melt viscosity, bubble time delay, super-saturation, and porosity) controls the system at a given time. Decompression causes a volumetric expansion of the sample within the gold capsule, which squeezes the melt into the headspace of the capsule (Figs 1 and 2). We attribute the elongated bubbles present in the upper part of the samples to the shear accompanying this extrusion. Because the effect of the shear is confined to a small region of the samples (< 25 vol.%), we conclude that the sample expansion does not influence the average bubble growth. We estimate the melt viscosities in our experiments to range between 5.9×10⁴ Pa s at 100 MPa
and 1.5×10⁶ Pa s at 30 MPa (at 825 °C under water saturation, Hess and Dingwell 1996), which are well below the values that affect bubble growth (~108-9 Pa s, Gardner et al. 2000). Our data provide an indirect measure of the amount of water super-saturation, because super-saturation increases with the difference (∆α) between the equilibrium porosity and the sample porosity (Fig. 6). In the slow growth rate regime, super-saturation (≈∆α) increases linearly with
decreasing pressure regardless of decompression rate (Fig. 5). We note that Gardner et al. (1999) also observed this linearity, and we used it to infer values of ∆α for the 1 and 10 MPa s-1 rates.
Above a critical value (≈αcr), however, bubble growth accelerates and switches from slow to fast
growth regime, quickly becoming faster than the equilibrium rate. This behavior is consistent with the well-known relationship between super-saturation and growth: growth is strongly driven by the amount of excess water, because the rate of water diffusion into the bubble increases with the concentration gradient between the melt and the bubble (Sparks 1978; Proussevitch and Sahagian 1998).
Is super-saturation the main process controlling the occurrences of the two disequilibrium regimes? We stress that the critical porosity observed in our experiments is a proxy for the level of super-saturation away from the bubbles because the critical value (αcr) results from the
integration of all the processes at play during growth. With this simplification in mind, we note two situations where the far-field super-saturation alone cannot explain our data. First, the fastest decompression rate (10 MPa s-1) has a critical value much larger than the other rates, whereas αcr
should not depend on decompression rate (Fig. 6). We note that the time to reach the critical value is only 4 s for the 10 MPa s-1 rate and more than 40 s for the other rates. Bubble time delay, which is a very slow initial growth rate due to unfavorable transport properties of the melt next
to the bubble walls, may play a role at large decompression rates. Proussevitch and Sahagian (1998) calculated the bubble time delay for a rhyolitic melt instantly decompressed from 100 MPa to be ~2 s. Our fast rate approximates the instantaneous decompression simulated by Proussevitch and Sahagian (1998), which suggests that the bubble time delay affected the 10 MPa s-1 run because of its short duration (4 s). Second, super-saturation alone cannot force ∆α to vanish at high porosities, thus re-equilibrating melt and bubbles. We suggest this re-equilibration occurs because the spaces between bubbles are reduced at high porosities. In other words, the shell defined by the super-saturation gradient around a given bubble starts to interact with its neighbors, thereby canceling the gradients, as illustrated in the model by Proussevitch et al. (1993a). The influence of porosity is therefore confined to the latest stages of the decompression (at low pressure and high porosity), when there is competition between the large decompression rate, which forces disequilibrium degassing, and small bubble spacing, which reduces the length over which water must diffuse.
4.2. Coalescence
We can use our experiments to identify some of the parameters that govern coalescence. Most likely, coalescence is incomplete for the faster decompression rate (Fig. 9) because the time allowed for connection decreases as decompression rate increases whereas the time needed for bubbles to coalesce is finite. Thus, the process of coalescence itself is time dependent (~180 s), whereas the inception of coalescence is porosity dependent (~43 vol.%). We note that the decompression rate does not influence the values of time and porosity, suggesting these two parameters do not depend on the speed of magma ascent (see Implications for Volcanic
porosity noted by Westrich and Eichelberger (1994) on high-silica melts. We note that their permeability increase occurs at a higher porosity (60 vol.%) than the one we observed. This difference is probably caused by the closed degassing conditions Westrich and Eichelberger (1994) used in their experiments. This well-defined beginning of permeability in high
temperature silicate melts contrasts with the continuous relationship between permeability and porosity found in cold natural products (Klug and Cashman 1996). This discrepancy suggests inferences carried from measurements made on solid clasts to the properties of hot melt are somewhat limited. Another parameter regulating coalescence is the amount of shear applied to the melt, as suggested by the early coalescence observed in the upper part of the samples. This relationship is not surprising, as the catalyzing role of shear on coalescence is well known (Stasiuk et al. 1996). Considering that the natural system is flowing whereas our experiments are static, we expect the values of the controls of coalescence (porosity and time) to be equal or lower in volcanic conduits than in our experiments because we expect the magma to go under significant shear during ascent in the conduit.
A perhaps more fundamental problem is to identify the cause(s) of coalescence in the open degassing runs. The importance of viscosity and the spatial arrangement of bubbles as
controlling factors of coalescence and permeability have been discussed by many authors (e.g., Proussevitch et al. 1993a; Gaonac’h et al. 1996; Blower 2001). Viscosities are expected to be similar for both open and closed degassing samples, but coalescence is manifest only in the open degassing set. Our experiments generate similar BSD and BND at high pressure for both sets (Fig. 8b). Hence, we expect similar nucleation and growth kinetics. The major difference between the two sets seems to be the volatile concentration gradient at the sample free surface
that extends on a much larger scale than the average bubble diameter. The effect of this concentration gradient on coalescence will be the object of a further study.
Our observations of coalescence have various implications for the study of bubble size distribution in high-silica melts. We observe that power-law BSD, although limited to one order of magnitude, result from bubble coalescence (Fig. 8c). Previously, two possible mechanisms have been proposed to explain the formation of a power-law BSD: cascading coalescence, where successive coalescence events occur through binary collisions of similarly sized bubbles
(Gaonac’h et al. 1996) and continuous bubble nucleation (Blower et al. 2001). While the former is accepted for low-viscosity magmas, the latter has been proposed to explain natural size distributions in high-viscosity systems. In our experiments, all runs in closed degassing
conditions display unimodal bubble size distributions below 100 MPa. Since the open degassing runs followed similar decompression paths as the runs in closed degassing conditions, we deduce that bubbles did not continuously nucleate during decompression below 100 MPa. Instead, the concurrence of bubble coalescence (Fig. 10) with the shift from Gaussian to power-law size distributions suggest that cascading coalescence also operates in high-viscosity melts.
Coalescence generates broad bubble size distributions with large bubbles coexisting with bubbles 20 times smaller. To assess whether the widening of the BSD is entirely caused by coalescence, we compare the BSD between closed degassing runs and the equivalent open degassing runs at the inception of coalescence (both produce similar Gaussian shapes, Fig. 8b). The two runs (ABG30 and G300) have a ~17 µm difference in median bubble diameter, which results from differing bubble number densities. To carry out the comparison, we add this difference to each bubble size of the smaller-sized run (ABG30). The BSD of the closed degassing run is narrow, with a standard deviation less than 20%, and no measured bubbles
below 35+17=52 µm or above 88+17=105 µm. In contrast, the BSD of the open degassing run has a deviation greater than 30% with bubbles as small as 14 µm, and as large as 147 µm. Whereas the larger bubbles are produced by coalescence, the smaller bubbles could result from either nucleation of new bubbles, Ostawald ripening, or hindered growth. The occurrence of a new nucleation event during decompression is unlikely, because of the unimodality of the closed-run BSD and the low decompression rates applied. Ostwald ripening is the tendency of large bubbles to grow at the expense of smaller neighbors because of the diffusive gas exchange driven by the pressure difference between the bubbles. In order to determine whether this process may influence the changes in BSD, we calculated the time scale t for Ostwald ripening to occur after (Proussevitch et al. 1993b):
(
2)
1 2 0 4RTD x r r P t − σ δ =where r0 and r1 are the initial and final bubble radii, R is the gas constant, D is water
diffusivity (5.8×10⁻¹² m2 s-1, Zhang et al. 1991), T is temperature (825 °C), P is the quench pressure (30 MPa for G300), σ is the surface tension between bubble and melt (0.06 N m-1, Epel’baum et al. 1973), x is the water solubility in the melt (Equ. A5), and δ is the distance between neighboring bubbles: δ=2rm((0.78/α)1/3-1) where α is the sample porosity and rm the
mean bubble radius. The time needed for the smallest bubbles (r0= 14 µm) in the open degassing
run G300 (α=0.35, Table 2) to contract from the mean bubble size (r1= 77 µm) is 4.5 hour,
which is much longer than the decompression duration (140 s). We also note that the time for the largest bubble (r0= 147 µm) to ripen from the mean bubble size (r1= 77 µm) is 12.5 hour. Thus,
Ostwald ripening is not likely to affect bubble sizes in any of our experiments because run durations are always less than 50 minutes. Hindered growth is related to the concentration
gradient field around each bubble caused by decompression and it occurs when the concentration gradient around a single bubble affects the growth of its neighbors. Experimental work showed that in melts containing bubbles with large size difference (ratio 1:4), large bubbles tend to damper the growth of smaller neighboring bubbles, possibly decreasing their sizes (Larsen and Gardner 2000). In our experiments, the size ratio between the small bubbles and their coalesced neighbors is on the order of 1:100. Thus, hindered growth seems the most likely process to control the emergence of small bubbles.
Does the permeability that develops in our experiments represent that of a magmatic liquid? Permeability arises only when enough bubbles connect and form chains (e.g., 40 MPa run, Fig. 7a) that reach a free surface. If the sample size is less than 10 times larger than the bubbles it contains, however, the chains are only a few bubbles long and affect the permeability of the sample (Blower 2001). This undesirable effect does not occur in our experiments because samples are 100 times larger than the bubbles when connectivity starts and ~20 times larger when connectivity is complete. We note, however, that the time required for coalescence might depend of the sample size.
It is likely that high porosities were achieved even at low decompression rates (e.g., 85 vol.% for PPE11, Table 2), because the amount of gas that could escape was finite, given the finite volume of the capsule headspace and the limited capacity of absorption of the anhydrous powder. This suggests that the melt created an open network of bubbles while coalescing (e.g., 30 MPa run in Fig. 8a), but quickly came back to an impermeable foam (e.g., 24 MPa run in Fig. 8a). As a result, after bubbles collapse to distorted shapes when they release a fraction of their gas, the melt is ready for a second coalescence event. If our experiments can be believed to represent a larger batch of magma, we can transpose this reasoning to the size of a volcanic
conduit. In this light, the magma can release only a fraction of its gas during a coalescence event because the conduit also has a limited permeability (e.g., Jaupart and Allegre 1991). Further decompression can thus increase the remaining porosity enough to trigger another coalescence event. Thus, the magma might be affected by several coalescence events before reaching the surface. Since each of these events profoundly modifies the bubble size distribution, variable amount of coalescence would reshape the size distribution of the eruptive products. In other words, coalescence restricts our ability of using eruptive products to discern other degassing processes. We note that shear, fragmentation, and post-fragmentation processes may also change the bubble size distribution, adding difficulty to interpreting BSD of natural samples.
5. Implications for volcanic eruptions
5.1. Modeling magma degassing
Water exsolution into bubbles drives bubble growth, and whether exsolution occurs in equilibrium influences conduit flow dynamics. Although one study explored the consequence of disequilibrium degassing on bubble overpressure (Melnik 2000), no quantitative assessment of the dynamic effects of disequilibrium has been performed. Qualitatively, in disequilibrium the density decrease and viscosity increase caused by bubble growth are diminished, which reduce the decompression rate and flow acceleration. Our experimental results for closed degassing relate decompression rates and degassing style. We have thus used a one-dimensional model of magma ascent before fragmentation to explore further the consequences of disequilibrium degassing.
Our model of magma ascent is based on the model Conflow developed by Mastin and Ghiorso (2000), and details of the implementation are given in the Appendix. The model assumes steady,
isothermal, and homogeneous flow in a vertical cylindrical conduit (e.g., Wilson 1980; Dobran 1992; Papale and Dobran 1993; Woods 1995). Following Mastin and Ghiorso (2000), we solve the momentum equation along the conduit as magma rises, allowing viscosity to vary. We introduce new empirical relations between pressure, decompression, and porosity for each regime of bubble growth (Equs. A10 and A13; Fig. 6), thus allowing disequilibrium degassing. We tested the robustness of our numerical scheme by forcing equilibrium degassing at all times, which produced outputs undistinguishable from the ones of Conflow.
5.2. Effects of disequilibrium degassing
The comparison between a run of the model with forced equilibrium degassing and with disequilibrium degassing according to our empirical relations is shown in Fig. 11. Initial conditions for both runs are the same as in the experimental sets (825 °C, 150 MPa, water-saturated, 2154 kg m-3 from Mastin and Ghiorso 2000). A representative mass flux (2.19×10⁶ kg s-1 for 20-m diameter conduit) was determined by running Conflow (Mastin and Ghiorso 2000) with a boundary condition at atmospheric pressure at the vent because, unlike our model,
Conflow simulates flow conditions after fragmentation. In the equilibrium degassing run, we note strong accelerations at high porosities (e.g., 4.7 m s-2 at 60 vol.%; 30 m s-2 at 70 vol.%) and associated large decompression rates (e.g., 15.4 MPa s-1 at 60 vol.%; 47.6 MPa s-1 at 70 vol.%). These decompression rates force the magma to degas, increasing both porosity and viscosity, which in turn drives the pressure to drop further, causing the familiar deviation from lithostatic pressure found in similar works (Dobran 1992; Papale 1999; Mastin and Ghiorso 2000). As expected, disequilibrium degassing produces only modest accelerations at high porosities (e.g., 0.97 m s-2 at 60 vol.%; 5.4 m s-2 at 70 vol.%) and greatly reduces decompression rates (e.g., 3.1 MPa s-1 at 60 vol.%; 6.8 MPa s-1 at 70 vol.%), thus reducing the deviations from lithostatic
pressure. The effect of disequilibrium degassing is best seen at porosities above 60 vol.%, and these reductions of flow acceleration and decompression rate are more important if the values are compared at a given pressure instead of a given porosity.
Disequilibrium degassing causes flow conditions near fragmentation to be not as extreme as previously thought (Dobran 1992; Sparks et al. 1994), and we need to assess whether
fragmentation criterions defined by flow conditions occur at a different porosity. First, in the case of sudden decompression of highly viscous magma (e.g., dome failure), fragmentation has experimentally been determined to require a pressure drop on order of 102-104 MPa s-1 with a magma viscosity between 108 and 1010 Pa s (Alidibirov and Dingwell 2000). We predict both decompression rates and viscosities one to two orders of magnitude below the required values, confirming the inapplicability of this fragmentation criterion in the case of a conduit-driven eruption. Overpressure in bubbles has also been proposed to cause fragmentation (e.g., Navon and Lyakhovsky 1998; Zhang 1999). We calculated (equation 6 in Melnik 2000) with the initial conditions used in Fig. 11 that an overpressure of 10 bar is reached at 87 vol.% porosity in the equilibrium degassing case, and at 83 vol.% in the disequilibrium case. Fragmentation can also occur when the strain rate applied to the magma exceeds its capacity to dissipate the stress by viscous deformation (e.g., Papale 1999). Using the elastic modulus given by Papale (1999), we calculated with the initial conditions used in Fig. 11 that magma viscous dissipation is overcome at 80 vol.% porosity in both equilibrium and disequilibrium cases. Thus, despite significant changes in flow conditions at high porosity, the porosity at which fragmentation occurs is insensitive to the degassing style.
The depth of fragmentation, however, is significantly shallower with disequilibrium
defined by a fixed value of porosity, 64 vol.%, Gardner et al. 1996). We also note that an
estimate of the effect of delayed nucleation (or melt super-saturation, Woods 1995) had a similar effect. Fragmentation depth is thus highly sensitive to the rate at which the different processes that control degassing occur in the conduit.
The robustness of our empirical approach of disequilibrium degassing can be assessed by comparing the effects produced by two independent sets of internally consistent data. For example, the decompression experiments of Gardner et al. (1999) were run under similar conditions as our closed degassing experiments. High-silica rhyolite with low crystal content (< 1 vol.%) was heated at the same temperature (825 °C) and linearly decompressed at various rates. The higher initial confinement pressure (200 MPa) allows a qualitative extension of our model to a broader range of initial conditions. Keeping in mind that the Gardner et al. (1999) decompressions start from initial, water-saturated pressure, and therefore that these runs include nucleation kinetics, we can extend the empirical formulation of the slow growth rate regime (Equ. A10). A regression including both experimental sets gives a coefficient (Az) 20 % higher
than the one determined from 150 MPa, and slightly increases the correlation coefficient (Table 3). The regression of both sets on the boundary between the slow and fast growth regimes (Equ. A14) changes the coefficients (a1 and b1) by less than 1 %, and slightly lowers the correlation
coefficient (Table 3). The extension of the comparison to the fast growth regime is not possible due to the lack of data towards lower pressures for runs initiated at 200 MPa. Runs of the
disequilibrium model with identical initial conditions, but with the coefficients determined from both data sets, are indistinguishable on the scale of Fig. 11. Thus, our empirical approach shows little sensitivity to initial confining pressure, nucleation kinetics at low crystal volume fraction, and small differences in melt composition.
5.3. Effects of connectivity
In a volcanic conduit, the creation of an open network would allow gas to escape from the magma. The ensuing diminution of porosity would reduce flow acceleration and possibly lead to effusive eruption (Eichelberger et al. 1986; Jaupart and Allegre 1991). On the other hand, the high porosities needed for fragmentation may only be reached if bubble connection is
incomplete. Thus, it seems that fast decompression rates are required for explosive eruption (see sections Open degassing runs and Connectivity). We therefore used the conjunction of our model and the experimental results on connectivity to assess the transition between effusive and
explosive regimes.
We performed numerical runs varying only the initial ascent speed of magma (Fig. 12), and superimposed the results of the connectivity experiments. From the open degassing experiments, we consider that connectivity is rate-independent, begins at 32 MPa (43 vol.% porosity in
equilibrium), and is complete after 180 s. We set the fragmentation porosity to 64 vol.% to begin with, because it matches the vesicularity of most pumice (Gardner et al. 1996). Thus, if the magma reaches 64 vol.% porosity more than 180 s after reaching 43 vol.%, then it erupts effusively.
We find that the critical ascent rate is modest, 0.35 m s-1, which corresponds to a mass flux of 2.4×10⁵ kg s-1 for a 20-m diameter conduit (2154 kg m-3, water-saturated magma at 825 °C and 150 MPa), and that only runs below 0.30 m s-1 occur completely in the equilibrium-degassing regime. At those conditions, a variation of 0.1 m s-1 reduces or expands the time allowed for complete connection by about one minute, with a roughly linear dependence between initial ascent rate and connectivity completion. Although we set the fragmentation porosity to 64 vol.%, raising it to the values suggested by the strain-rate criterion, the bubble overpressure criterion, or
commonly used values (67-80 vol.%: Sparks 1978; 75 vol.%: Mastin and Ghiorso 2000) would only increase slightly the initial magma ascent rate, but not change this linear dependence. Thus, the dependence between ascent rate and connectivity suggests that the transition from effusive to explosive regime is very sensitive to initial ascent rate, regardless of the exact formulation of fragmentation.
Because our model does not allow the gas to escape from the magma, the numerical runs are minimum estimates of ascent speeds for open degassing systems. The effect of connectivity, however, can be assessed with an open-system conduit flow where the gas can flow within bubble chains (Yoshida and Koyaguchi 1999). After adjusting the parameters of the model (Equ. 37 in Yoshida and Koyaguchi 1999) to match our values of porosity and pressure at the onset of connectivity, the pressure reached at fragmentation porosity (64 vol.%) if the gas escapes from the bubbles is 6 MPa instead of 17 MPa. The magma takes about 100 s more to reach this former pressure. The linear relationship between ascent rate and connectivity indicates that our closed-degassing model underestimates the critical ascent rate by 0.2 m s-1 (+57%). Therefore, the value of the critical ascent rate highly depends on the exact influence of permeability on flow
dynamics. This limitation, however, does not affect our conclusions regarding the sensitivity to initial conditions displayed by the transition between explosive and effusive regimes.
Superimposing the results of the open degassing experiments to our model leads to two additional conclusions. First, the assumption of closed-system for conduit model can be applied at large magma ascent speeds and high mass fluxes (e.g., Plinian eruptions), but should be restricted to high pressures (> 32 MPa) and low gas volume fractions (< 43 vol.%) at low ascent speeds (e.g., lava dome). Second, our estimate of ~43 vol.% porosity for the onset of
coalescence, which increases the time for gas to escape. The time scale of 180 s given for
connectivity is thus a maximum, and hence flow conditions near fragmentation may significantly be affected by connectivity and gas escape.
6. Conclusions
Decompression experiments performed on rhyolitic melt hydrated at 150 MPa and sub-liquidus temperature lead us to define three distinct bubble growth regimes. An equilibrium
growth regime occurs when the melt initially decompresses slow enough (< 0.1 MPa s-1) to allow
water to completely diffuse from melt to bubbles. The slow growth rate regime occurs when the melt decompresses faster than equilibrium (> 0.2 MPa s-1). In this regime, porosity evolves linearly with pressure, regardless of decompression rate. A fast growth rate regime occurs when the super-saturation reaches a critical value, which depends on decompression rate, and
accelerates bubble growth. The fast growth diminishes the porosity deviation from equilibrium linearly with pressure decrease.
We assessed the consequences of the three growth regimes on conduit flow dynamics by a one-dimensional model of magma ascent fitted by the experimental data. Compared to previous models that assume equilibrium degassing of the melt during ascent, the introduction of
disequilibrium degassing reduces the deviation from lithostatic pressure by ~ 25 %, the
acceleration at high porosities (> 50 vol.%) by a factor 5, and the associated decompression rate by an order of magnitude. Importantly, flow conditions near fragmentation are not as extreme as previously thought. Comparison with other published decompression experiments (Gardner et al. 1999) shows that our empirical approach is valid for rhyolitic (104 – 107 Pa s) melts with low crystal contents (< 1 vol.%) stored in the upper crust (< 200 MPa).
Experiments run under open degassing conditions show that bubbles start to coalesce around 43 vol.% porosity. The fact that this value is independent of decompression rate suggests that coalescence might happen at all eruptive regimes. The process of coalescence, however, is time-dependent and occurs in a matter of minutes (~ 180 s). Thus, coalescence may not reach
completion in the more violent (Plinian) eruptive regimes. Coalescence generates broad bubble size distributions with large bubbles coexisting with bubbles 20 times smaller. Thus, the
occurrence of coalescence in a volcanic conduit profoundly reshapes the bubble size distribution, possibly restricting our ability of using eruptive products to differentiate various degassing processes. Introduction of these results into our conduit flow model shows that the transition between explosive and effusive regime is sensitive to small variations of initial magma ascent speed (on the order of 0.01 m s-1 for a conduit 20 m in diameter). The assumption of closed-system for conduit flow models must be restricted to porosities lower that 43 vol.%, but can be extended to higher porosities in the case of high mass fluxes. Flow conditions near
fragmentation, however, may significantly be affected by coalescence and gas escape.
Acknowledgments
We would like to thank P.J. Shamberger for helping us running the coalescence experiments, while he was a REU intern at the Geophysical Institute and M. Wahlen for letting us use his digital microphotography equipment. Discussions with L. Mastin helped to clarify many mysteries of conduit flow modeling. Thorough reviews by M. Mangan and D. Sahagian greatly improved the manuscript. Funding was provided by the NSF grant EAR-0087853 to J.E.G. and by the Volcano Hazards Program of the US Geological Survey, through the Alaska Volcano Observatory to A.B.
Appendix
Our simple model of magma ascent trough a conduit before fragmentation is based on the approach first developed by Wilson (1980). We closely follow Mastin and Ghiorso (2000)’s solution, so that when the decompression rates are small enough to allow degassing to occur in equilibrium, the output of our model is undistinguishable from the one of Mastin and Ghiorso (2000). The novelty we introduce is the effect of disequilibrium degassing, for which we develop empirical relations between pressure, decompression rate, and porosity for the regimes of bubble growth, and their respective range of applicability (Equs. A10-A15). The model is
one-dimensional and thus flow properties are averaged across the (constant) cross-sectional area of the conduit at any given depth. The flow is considered isothermal and homogeneous (i.e., bubbles rise at the same speed as the magma), the conduit is a vertical cylinder with
impermeable rigid walls, and the gas phase is H2O. Although those assumptions are not strictly
applicable to the natural system, they have been widely used to provide a reasonable
approximation of magma velocities in a conduit during an eruption. We consider that the mass flux Q remains constant, so that:
v r
Q=ρπ 2 (A1)
where ρ is the mixture density, v its speed, and r the conduit radius. The flow below
fragmentation is laminar, thus the steady-state conservation of mass and momentum read (e.g., Woods 1995):
( )
ρ =0 dz v d (A2) f g dz dP dz dv v =− −ρ − ρ (A3)where P is the magma pressure, g is the acceleration of gravity (9.81 m s-2), z is the height within the conduit, and f a friction factor given by (Mastin and Ghiorso 2000):
r v r
v
f =8µ2 +0.0025ρ 2 (A4)
where µ is the magma viscosity. The presence of bubbles in the magma causes viscosity to change as a function of gas fraction and shear (e.g., Pal 2003), but these complex changes cannot be fully evaluated a model that uses depth-averaged quantities. Thus, following Mastin and Ghiorso (2000), we use the pure melt viscosity in Equ. A4 (Hess and Dingwell 1996). When bubbles are in equilibrium with the liquid, the solubility law gives the weight fraction x of water remaining in the liquid (e.g., Woods 1995):
P
x=κ (A5)
with Henry’s constant κ = 3.44×10⁻⁶ kg0.5 m0.5 s-1 determined from the best-fit parameters of
the second-order polynomial regression of our experimental set in equilibrium (Table 1). The difference with the value determined by Mangan and Sisson (2000) for the same PCD rhyolite (4.15×10⁻⁶) is mainly due to the form of the regression equation they used (non-zero intercept second order polynomial regression). The mixture density ρ is calculated using the perfect gas law:
(
)
l(
)
l g RT P M ρ α − + α = ρ α − + αρ = ρ 1 1 (A6)Where ρl is the liquid density, ρg is the gas density, α its volume fraction, M is the water
molecular weight (18×10-3 kg mol-1), T is the mixture temperature, and R is the universal gas constant (8.3144 J mole-1 °K-1). Combining the derivative of Equ. A6 with Equs. A1-A3 leads to:
1 2 2 1 − −α −ρ − −ρ α = RT M v f g RT MP v dz d dz dP l (A7)
The evolution of pressure in the conduit is thus controlled by the degassing rate dα/dz, which has to be determined for each experimentally determined regime: equilibrium, slow growth, and fast growth. In the equilibrium regime, the gas volume fraction αequ (Fig. 6) is calculated from
the difference between the maximum amount of water that can be dissolved in the magma at a given pressure P and the original water content at the initial pressure P0:
β + β = α MP
equ with β=RTρlκ
(
P0 − P)
(A8)The derivative of Equ. A8 gives the equilibrium-degassing rate:
(
)
2 2 − β + − β − = α P MP M dz dP dz d equ (A9)The slow growth regime is a linear function of α and P (Fig. 5; see Table 3 for empirical constant value): dz dP A dz d z slow = α (A10)
In the fast growth regime, ∆α is given by the linear regression for each decompression rate (Fig. 5): dz dP A dz d s = α ∆ ) ( (A11) where As varies in function of the decompression rate according to:
2 2 b dt dP a As = + (A12)
Hence the derivative of α with depth becomes:
dz dP A dz d dz d s equ fast − α = α (A13)
Note the differential form of Equ. A10 allows a melt to reach atmospheric pressure super-saturated. We also need to determine the boundaries between each regime of degassing.
Experimental data (Fig. 3) show that the critical decompression rate between the equilibrium and the slow growth regimes varies little between high and low pressure, so we used a unique median value of 0.15 MPa s-1. The boundary between the slow growth and the fast growth regimes is reached when the difference between the disequilibrium (α) and the equilibrium (αequ) porosities
∆α is greater than a critical value ∆αcr (Fig. 6). The relation between ∆αcr and the decompression
rate is given by the regression:
1 1ln ) ln( b dt dP a cr + = α ∆ (A14)
Experimental data were used for the regression when available and interpolated between the slow and fast growth curves when no data point fell on ∆αcr (Figs. 5 and A1). The nonlinear form
of Equ. A14 has been preferred over a linear form to ensure a realistic (asymptotic) behavior of the critical porosity at large decompression rates. In disequilibrium degassing, the melt viscosity is calculated from the water content at Pright (Equ. A5, Fig. 6), because the amount of water in
bubbles at a given pressure corresponds to the equivalent equilibrium value αright. Pright is
(
α +1)
(
− 0)
=0 κρ+
α TR P P
MPright right l right right (A15)
The degassing behavior of Equ. A7 is thus given by (dα/dz)equ (Equ. A9) if dP/dt<0.15 MPa s-1;
(dα/dz)slow (Equ. A10) if dP/dt>0.15 MPa s-1 and α>αcr; and (dα/dz)fast (Equ. A13) if dP/dt>0.15
MPa s-1 and α>αcr with the porosity α being calculated from the previous distance step. Equ. A7
is solved using a fourth-order Runge-Kutta algorithm with a constant distance step of 0.5 m below 50 vol.% porosity and 0.05 m above.
Figure Captions
Figure 1 Schematic cross-section of the capsules used in the experimental setup. Rhyolite cores were hydrated for 5 days at high pressure and temperature (left). In closed degassing conditions, samples were decompressed after hydration (center). Open degassing conditions were created by reloading the samples in a new capsule with an anhydrous powder (right) and reheating/pressurizing the capsule before decompression.
Figure 2 Reflected light microphotograph of the upper 2 mm of run G318 (Table 2). Bubbles are deformed because the melt has been squeezed up in the capsule headspace by
volumetric expansion. Note that this type of extrusion occurs in both open and closed degassing conditions. This open degassing sample illustrates the catalyzing effect of shear on coalescence. Note that the large, coalesced bubbles are restricted to the upper half of the photograph, where the shear was highest.
Figure 3 Porosity as a function of quench pressure for variable decompressions rates. Dashed lines indicate disequilibrium degassing over a given pressure interval, and solid lines indicate equilibrium degassing over the interval. The equilibrium degassing porosity curve is calculated from Equ. A8 (see Appendix for details). Error bars are omitted when smaller than the symbol size.
Figure 4 Porosity as a function of quench pressure for a constant decompression rate of 0.5 MPa s-1. The imposed rate forces disequilibrium degassing, as illustrated by the deviation of the sample porosities from the equilibrium curve (Equ. A8 in the Appendix). Note that runs with high porosities are back to equilibrium. Error bars are omitted when smaller than the symbol size.
Figure 5 Porosity deviation from equilibrium degassing (∆α) for various linear decompression rates. The y-axis corresponds to the degree of super-saturation and dashed lines to the regressions used in the model. Regressions were carried out using the linearity of the slow growth regime and the assumption that super-saturation vanishes at atmospheric pressure (see text). Error bars are omitted when smaller than the symbol size.
Figure 6 Schematic representation of magma degassing as seen in this study. The different symbols define the variables used in the description of disequilibrium degassing runs and in the conduit flow model. α and P are the respective porosity and pressure at the point of interest, αequ is the equilibrium porosity at a given P, ∆α is the difference
between αequ and α, αright and Pequ are the respective equilibrium porosity and pressure
at a given α, and ∆αcr is the critical super-saturation that delimits the fast and slow
growth regimes.
Figure 7 Microphotographs of thin sections in reflected light showing decompression runs with open-degassing conditions. a. Linear decompression rate of 0.025 MPa s-1. Bubble coalescence is responsible for the textural change occurring between 40 and 30 MPa. b. Linear decompression rate of 0.5 MPa s-1. Note that coalescence occurs
progressively because of the faster decompression.
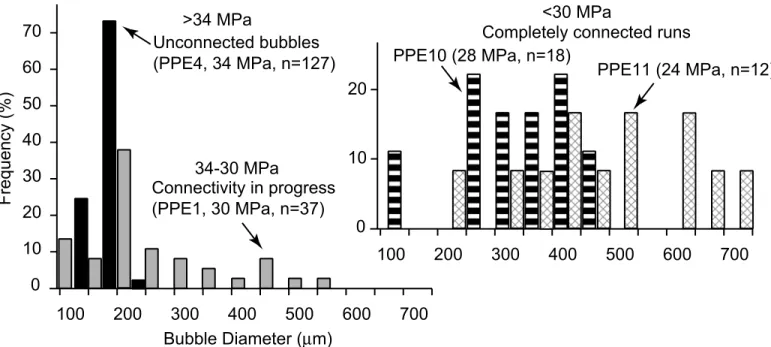
Figure 8 Bubble size distributions (BSD) of open degassing experiments showing the effects of coalescence. a. Coalescence from inception (PPE4) to in-progress (PPE1) to
completion (PPE10) at low decompression rate (0.025 MPa s-1). Note the few changes induced by further decompression after complete connection (PPE11), and the low bubble count of connected samples due to large bubbles. b. Open degassing conditions
produce broader distributions (G300, 0.5 MPa s-1, median diameter = 77 µm, σ = 25, BND = 11×105 cm-3) than closed degassing conditions (ABG30, 0.5 MPa s-1, median diameter = 60 µm, σ = 11, BND = 35×105 cm-3). c. Coalescence creates large bubbles
and produces a distribution that mostly fits a power-law (G327, 0.5 MPa s-1).
Figure 9 Coalescence start and completion in function of the quench pressure. Also shown are time estimates to complete connectivity for various decompression rates.
Figure 10 Typical bubble pair shortly before coalescence. Note the planar shape of the thin separation wall between the bubbles (G303, Table 2).
Figure 11 Comparison of pressure-depth variations of 1D conduit flow simulations with and without equilibrium degassing. The solid line represents equilibrium degassing, the stippled line is disequilibrium degassing, the thick line is the lithostatic pressure gradient, and stars are the loci of fragmentation for each run. As the magma rises in steady state (i.e., with a fixed mass flux) along the volcanic conduit, its porosity increases, and the run is stopped when the magma reaches fragmentation at a fixed porosity of 64 vol.%. In the equilibrium run, the combined effect of decreasing porosity and increasing viscosity as the magma rises causes an important deviation from lithostatic pressure. Disequilibrium degassing greatly reduces this deviation and, as a result, fragmentation occurs 1 km higher in the conduit. Zones where particular regimes of bubble growth (slow and fast) occur are also mentioned on the
disequilibrium curve. Initial conditions are the same for both runs: P0 = 150 MPa, ρl =
Figure 12 The effect of magma initial ascent rate on the transition between effusive and
explosive eruption. Values of the x-axis correspond to the time since the beginning of magma ascent, whereas the y-axis is the magma pressure. Labels next to each curve give the initial ascent rate of the magma, so that each curve gives the pressure of a batch of magma as a function of elapsed time since its release from depth at that initial ascent rate. Bubble connectivity occurs at 43 vol.% porosity (32 MPa in equilibrium degassing) and is complete after 180 s. Completion of connectivity before 64 vol.% porosity allows the gas to escape from the magma and leads to an effusive eruption, whereas incomplete connectivity at 64 vol.% porosity leads to magma fragmentation because gas remains in the melt. Note that a small change in the initial ascent rate (i.e. mass flux because of the steady state condition) controls the effusive/explosive
transition. Initial conditions for all curves are: P0 = 150 MPa, ρl = 2154 kg m-3, T =
825 °C, and R = 10 m.
Figure A1 Nonlinear regression of ∆αcr (maximum porosity deviation from equilibrium
degassing) in function of the decompression rate. Circles are data from Gardner et al. (1999) and squares are data from this study.
References
Alidibirov M, Dingwell, DB (2000) Three fragmentation mechanisms for highly viscous magma under rapid decompression, J Volcanol Geotherm Res 100:413-421
Barclay J, Riley DS, Sparks RSJ (1995) Analytical models for bubbles growth during decompression of high viscosity magmas, Bull Volcanol 57:422-431
Blower JD (2001) Factors controlling permeability-porosity relationships in magma, Bull Volcanol 63:497-504
Blower JD, Keating JP, Mader HM, Phillips JC (2001) Inferring volcanic degassing processes from vesicle size distributions, Geophys Res Let 28:347-350
Dobran F (1992) Nonequilibrium flow in volcanic conduits and application to the eruptions of Mt. St. Helens on May, 18, 1980, and Vesuvius in AD 79, J Volcanol Geotherm Res 49:285-311
Eichelberger JC, Carrigan CR, Westrich HR, Price RH (1986) Non-explosive silicic volcanism, Nature 323:598-602
Epel’baum MB, Babashov IV, Salova TP (1973) Surface tension of felsic melt at high temperature and pressures, Geokhimiya 3:461-464.
Gaonac'h H, Lovejoy S, Stix S, Scherzter D (1996) A scaling growth model for bubbles in basaltic lava flows, Earth Planet Sci Lett: 139:395-409
Gardner JE, Thomas RME, Jaupart C, Tait S (1996) Fragmentation of magma during Plinian volcanic eruptions, Bull Volcanol 58:144-162
Gardner JE, Hilton M, Carroll MR (1999) Experimental constraints on degassing of magmas: isothermal bubble growth during continuous decompression from high pressure, Earth Planet Sci Lett 168:201-218
Gardner JE, Hilton M, Carroll MR (2000) Bubble growth in highly viscous silicate melts during continuous decompression from high pressure, Geochim Cosmochim Acta 64:1473-1483 Hess K-U, Dingwell DB (1996) Viscosities of hydrous leucogranitic melts: A non-Arrhenian
Hurwitz S, Navon O (1994) Bubble nucleation in rhyolitic melts: Experiments at high pressure, temperature, and water content, Earth Planet Sci Lett 122:267-280
Jaupart C, Allegre C (1991) Gas content, eruption rate and instabilities of eruption regime in silicic volcanoes, Earth Planet Sci Lett 102:413-429
Klug C, Cashman KV (1996) Permeability development in vesiculating magmas: implications for fragmentation, Bull Volcanol 58:87-100
Larsen JF, Gardner JE (2000) Bubble-bubble interactions in rhyolitic melts: applications to the evolution of bubble size distributions, Earth Planet Sci Lett 180:201-214
Lyakhovsky V, Hurwitz S, Navon O (1996) Bubble growth in rhyolitic melts: experimental and numerical investigation, Bull Volcanol 58:19-32
Mangan M, Sisson T (2000) Delayed, disequilibrium degassing in rhyolite magma:
decompression experiments and implications for explosive volcanism, Earth Planet Sci Lett 183:441-455
Mastin LG, Ghiorso MS (2000) A numerical program for steady-state flow of magma-gas mixtures through vertical eruptive conduits, Open-File Report of the USGS, pp 1-53
Melnik OE (2000) Dynamics of two-phase conduit flow of high-viscosity gas-saturated magma: large variations of sustained explosive eruption intensity, Bull Volcanol 62:153-170
Navon O, Lyakhovsky V (1998) Vesiculation processes in silicic magmas, in: Gilbert JS, Sparks RSJ (eds), The physics of explosive volcanic eruptions, Geol Soc Spec Pub, London, 145:27-50
Pal R (2003) Rheological behavior of bubble-bearing magmas, Earth Planet Sci Lett 207:165-179
Papale P, Dobran F (1993) Modeling of the ascent of magma during the Plinian eruption of Vesuvius in AD79, J Volcanol Geotherm Res 55:101-132
Papale P (1999) Strain-induced magma fragmentation in explosive eruptions, Nature 397:425-428
Proussevitch AA, Sahagian DL (1998) Dynamics and energetics of bubble growth in magmas: Analytical formulation and numerical modeling, J Geophys Res 103:18223-18251
Proussevitch AA, Sahagian DL, Anderson AT (1993a) Dynamics of diffusive bubble growth in magmas: Isothermal case, J Geophys Res 98:22283-22307
Proussevitch AA, Sahagian DL, Kutolin AT (1993b) Stability of foams in silicate melts, J Volcanol Geotherm Res 59:161 178
Sparks RSJ (1978) The dynamics of bubble formation and growth in magmas: a review and analysis, J Volcanol Geotherm Res 3:1-37
Sparks RSJ, Barclay J, Jaupart C, Mader HM, Phillips JC (1994) Physical aspects of magma degassing I. Experimental and theoretical constraints on vesiculation, in: Carroll MR, Holloway JR (eds) Volatiles in magmas, Rev Mineralogy 30:413-445
Stasiuk MV, Barclay J, Carroll MR, Jaupart C, Ratte JC, Sparks RSJ, Tait SR (1996) Degassing during magma ascent in the Mule Creek vent (USA), Bull Volcanol 58:117-130
Toramaru A (1989) Vesiculation process and bubble size distributions in ascending magmas with constant velocities, J Geophys Res 94:17523-17542
Toramaru A (1995) Numerical study of nucleation and growth of bubbles in viscous magmas, J Geophys Res 100:1913-1931
Westrich HR, Eichelberger JC (1994) Gas transport and bubble collapse in rhyolitic magma: an experimental approach, Bull Volcanol 56:447-458
Wilson L (1980) Relationships between pressure, volatile content and ejecta velocity in three types of volcanic explosion, J Volcanol Geotherm Res 8:297-313
Woods AW (1995) The dynamics of explosive volcanic eruptions, Rev Geophysics 33:495-530 Yoshida S, Koyaguchi T (1999) A new regime of volcanic eruption due to the relative motion
between liquid and gas, J Volcanol Geotherm Res 89:303-315
Zhang Y, Stopler E, Wasserburg G (1991) Diffusion of water in rhyolitic glasses, Geochim. Cosmochim. Acta 55:441-456.
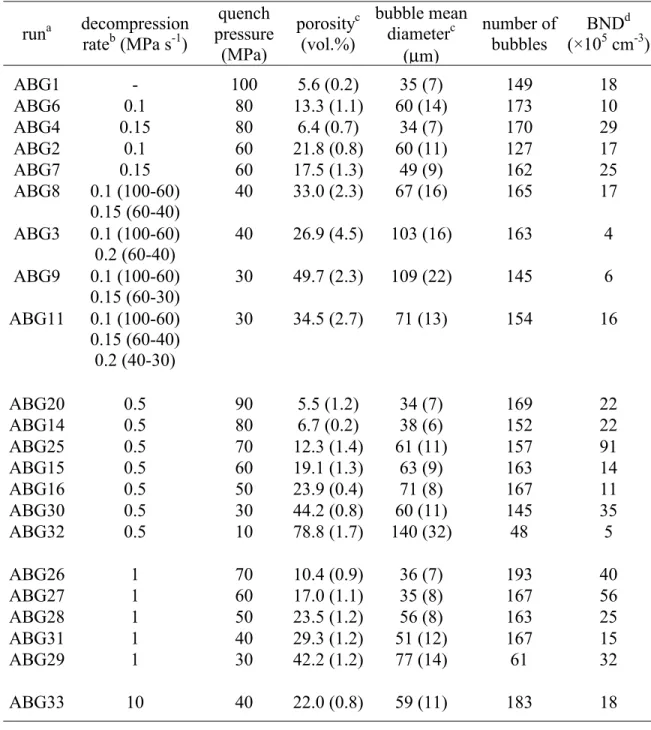
Table 1: Experimental conditions for closed degassing experiments runa decompression rateb (MPa s-1) quench pressure (MPa) porosityc (vol.%) bubble mean diameterc (µm) number of bubbles BNDd (×105 cm-3) ABG1 - 100 5.6 (0.2) 35 (7) 149 18 ABG6 0.1 80 13.3 (1.1) 60 (14) 173 10 ABG4 0.15 80 6.4 (0.7) 34 (7) 170 29 ABG2 0.1 60 21.8 (0.8) 60 (11) 127 17 ABG7 0.15 60 17.5 (1.3) 49 (9) 162 25 ABG8 0.1 (100-60) 0.15 (60-40) 40 33.0 (2.3) 67 (16) 165 17 ABG3 0.1 (100-60) 0.2 (60-40) 40 26.9 (4.5) 103 (16) 163 4 ABG9 0.1 (100-60) 0.15 (60-30) 30 49.7 (2.3) 109 (22) 145 6 ABG11 0.1 (100-60) 0.15 (60-40) 0.2 (40-30) 30 34.5 (2.7) 71 (13) 154 16 ABG20 0.5 90 5.5 (1.2) 34 (7) 169 22 ABG14 0.5 80 6.7 (0.2) 38 (6) 152 22 ABG25 0.5 70 12.3 (1.4) 61 (11) 157 91 ABG15 0.5 60 19.1 (1.3) 63 (9) 163 14 ABG16 0.5 50 23.9 (0.4) 71 (8) 167 11 ABG30 0.5 30 44.2 (0.8) 60 (11) 145 35 ABG32 0.5 10 78.8 (1.7) 140 (32) 48 5 ABG26 1 70 10.4 (0.9) 36 (7) 193 40 ABG27 1 60 17.0 (1.1) 35 (8) 167 56 ABG28 1 50 23.5 (1.2) 56 (8) 163 25 ABG31 1 40 29.3 (1.2) 51 (12) 167 15 ABG29 1 30 42.2 (1.2) 77 (14) 61 32 ABG33 10 40 22.0 (0.8) 59 (11) 183 18
a All runs were hydrated at 825 °C for 5 days.
b When applicable, decompression rates are given with the corresponding pressure ranges in
parenthesis.
c Porosities and bubble mean diameters are given with ± 1 σ in parenthesis. d BND are bubble number densities.
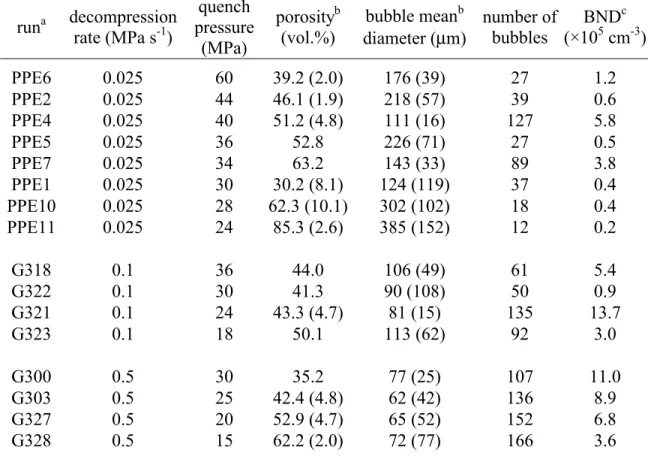
Table 2: Experimental conditions for open degassing experiments runa decompression rate (MPa s-1) quench pressure (MPa) porosityb (vol.%) bubble meanb
diameter (µm) number of bubbles
BNDc (×105 cm-3) PPE6 0.025 60 39.2 (2.0) 176 (39) 27 1.2 PPE2 0.025 44 46.1 (1.9) 218 (57) 39 0.6 PPE4 0.025 40 51.2 (4.8) 111 (16) 127 5.8 PPE5 0.025 36 52.8 226 (71) 27 0.5 PPE7 0.025 34 63.2 143 (33) 89 3.8 PPE1 0.025 30 30.2 (8.1) 124 (119) 37 0.4 PPE10 0.025 28 62.3 (10.1) 302 (102) 18 0.4 PPE11 0.025 24 85.3 (2.6) 385 (152) 12 0.2 G318 0.1 36 44.0 106 (49) 61 5.4 G322 0.1 30 41.3 90 (108) 50 0.9 G321 0.1 24 43.3 (4.7) 81 (15) 135 13.7 G323 0.1 18 50.1 113 (62) 92 3.0 G300 0.5 30 35.2 77 (25) 107 11.0 G303 0.5 25 42.4 (4.8) 62 (42) 136 8.9 G327 0.5 20 52.9 (4.7) 65 (52) 152 6.8 G328 0.5 15 62.2 (2.0) 72 (77) 166 3.6
a All runs were hydrated at 825 °C for 5 days.
b When available, porosities and bubble mean diameters are given with ± 1 σ in parenthesis. c BND are bubble number densities.
Table 3: Empirical constants used to assess disequilibrium degassing
Az R2 a1 b1 R2 a2 b2 R2
this study -5.3×10⁻⁶ 0.73 0.256 1.567 0.95 2.36×10⁻¹¹ 6.46×10⁻¹⁰ 0.99 this study &
Gardner et al. (2000)
hydrated rhyolite sample powder (anhydrous rhyolite or MgO) crimp FIGURE 1 hydrated rhyolite sample 5 mm
CLOSED DEGASSING OPEN DEGASSING
dry rhyolite sample water 5 days 825 °C 150 MPa decompression decompression capsule reloading head space welded ends
300 µm Up
20 40 60 80 100 120 140 0 10 20 30 40 50 60 70 80 0.15 0.15 0.1 0.1 0.2 0.2 0.15 0.15 Equilibrium rates (MPa s-1) Disequilibrium rates (MPa s-1) equilibrium curve Pressure (MPa) Porosity (vol.%) Figure 3
20 40 60 80 100 120 140 Pressure (MPa) 0 10 20 30 40 50 60 70 80 Porosity (vol.%)
Constant decompression rate (0.5 MPa s-1)