HAL Id: insu-03131969
https://hal-insu.archives-ouvertes.fr/insu-03131969
Submitted on 4 Feb 2021
HAL is a multi-disciplinary open access
archive for the deposit and dissemination of
sci-entific research documents, whether they are
pub-lished or not. The documents may come from
teaching and research institutions in France or
abroad, or from public or private research centers.
L’archive ouverte pluridisciplinaire HAL, est
destinée au dépôt et à la diffusion de documents
scientifiques de niveau recherche, publiés ou non,
émanant des établissements d’enseignement et de
recherche français ou étrangers, des laboratoires
publics ou privés.
1. Spatial and temporal evolution of the optical
thickness of the Pinatubo aerosol cloud in the northern
hemisphere from a network of ship-borne and stationary
lidars
S. Avdyushin, G. Tulinov, M. Ivanov, B. Kuzmenko, I. Mezhuev, Bruno Nardi,
Alain Hauchecorne, Marie-Lise Chanin
To cite this version:
S. Avdyushin, G. Tulinov, M. Ivanov, B. Kuzmenko, I. Mezhuev, et al.. 1. Spatial and temporal
evolution of the optical thickness of the Pinatubo aerosol cloud in the northern hemisphere from a
network of ship-borne and stationary lidars. Geophysical Research Letters, American Geophysical
Union, 1993, 20 (18), pp.1963-1966. �10.1029/93GL00485�. �insu-03131969�
GEOPHYSICAL
RESEARCH
LETTERS, VOL. 20, NO.18, PAGES 1963-1966,
SEPTEMBER
15, 1993
1. SPATIAL AND TEMPORAL EVOLUTION OF THE OPTICAL THICKNESS OF THE PINA•BO AEROSOL CLOUD IN THE NORTHERN HEMISPHERE FROM A NETWORK OF SHIP-BORNE AND
STATIONARY LIDARS
S.I. Avdyushin, G.F. Tulinov, M.S. Ivanov, B.N. Kuzmenko, I.R. Mezhuev
Federov Institute of Applied Geophysics, Moscow, Russia
B. Nardi I , A. Hauchecorne, M.-L. Chanin
Centre National de la Recherche Scientifique/Service D'Aeronomie, France
Abstract. The vertical profiles of the extinction coefficient
and the total optical thickness of the Pinatubo aerosol layer
obtained from a network of 5 Rayleigh-Mie lidars are
presented here. Three ship-borne lidars (PROFESSOR ZUBOV t,
PROFESSOR VIZE*, HENRI POINCARE*) and two fixed lidar
stations (OHP* and CEL*) are operated respectively by the
Roscomhydromet*, of Russia and of the Service d'Aeronomie
du CNRS* of France. The measurements presented are in the altitude range 15-35 km. They were obtained between July
1991 - April 1992 and cover 8øS-60øN latitude and 80øW-6øE
longitude. This represents extensive coverage of the western
sector of the northern hemisphere, which is partly coincident
with UARS satellite coverage. Optical depths of up to 0.2
were observed and maximum extinction coefficient values of
0.0g km -1 were obtained at 24 km and 18øN latitude.
Introduction
Since the eruptions of Mount Pinatubo between 12-16 June
1991, it has been an important concern to characterize the
aerosol cloud that resulted from this eruption, since the
presence of aerosols has a large effect on remote sounding
measurements and on the chemistry and radiative budget of the
lower stratosphere. We present here the optical thickness and
extinction measurements, taken over a ten month period in
equatorial and northern midlatitudes with a network of Russian
and French lidars. These data give a good indication of the
vertical, horizontal and temporal morphology of the Pinatubo
cloud and could be used to validate or correct UARS data. Instrumentation
The lidar network consists of five Rayleigh-Mie lidars
operating in the wavelength range, 532-589 nm. Two Russian
lidars stations operated by the Roscomhydromet are on-board
the ships PROFESSOR ZUBOV and PROFESSOR VIZE. Three
French lidar stations operated by CNRS are located at the
Observatory of Haute-Provence (OHP: 44øN, 6øE), at the
Centre d'Essai des Landes at Biscarosse (CEL: 44øN, IøW) and on-board the military ship HENRI POINCARI• based at Brest (herein referred to as LIMA).
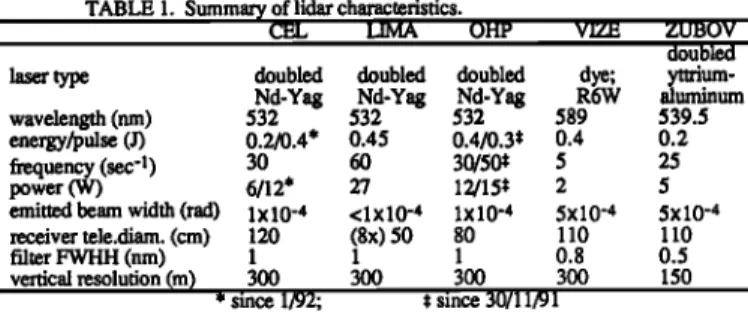
The three French lidar stations have been described in previous publications [Chanin and Hauchecorne, 1991;
Hauchecorne et al., 1991, 1992], so their description here will
be limited to the tabulated summary in Table 1. However, it
should be pointed out here that a significant difference exists in
the receiver configurations of the OHP and CEL lidar stations.
OHP uses two independent receiving telescopes for the two
channels corresponding to the low and high altitude ranges of
1Visiting research fellow from The University of Michigan Space
Physics Research Laboratory, Ann Arbor.
Copyright 1993 by the American Geophysical Union.
Paper number 93GL00485 0094-8534/93/93GL-00485503.00
the measurements, whereas CEL uses one telescope in conjunction with a beam splitter which is sensitive to polarization angle of the Rayleigh backscattered component of photons. The OHP lidar configuration is therefore more
ideally suited for the measurements presented in this paper.
The Roscomhydromet ship-borne lidar station on-board
PROFESSOR ZUBOV operates on a 539.5 nm wavelength,
using a doubled yttrium aluminum laser, which emits 0.2 J/pulse at 25 Hz. The pulse counting system has a 1 gs
resolution corresponding to an altitude resolution of 150
meters. The transmitting telescope produces a beam of width
5x10 4 rad. The diameter of the parabolic mirror of the
receiving telescope is 110 cm, with a focal length of 300 cm.
To minimize the background photons, an interference filter is
placed in front of the detector with a bandpass width of 0.5 nm
FWHH (full width at half height).
The Roscomhydromet ship-borne lidar station on-board
PROFESSOR VIZE uses a dye laser with an R6W active element
and operates at 589 rim. It emits 0.4 J/pulse at 5 Hz. The
pulse counting system has an effective 2 gs resolution (300
meter altitude resolution). The transmitting and receiving
telescopes have the same characteristics as those of the ZUBOV
lidar, and the interference filter has a bandpass width of 0.8
nm FWHH. These characteristics are summarized in Table 1. Measurements
AnalysD
The extinction coefficient ct, is calculated with expression:
a(z) = (1)
where the aerosol backscatter to extinction ratio in the brackets
is a measurable quantity. The value used throughout the
calculations was a constant value of 0.04 sr '•, which corresponds to the 532 nm wavelength at 20 km after a major volcanic eruption. In fact the aerosol backscatter to extinction ratio can vary with aerosol content [Jgger and Hofmann, 1991]
and is also expected to be variable with altitude, especially
after a large volcanic eruption [Deshler et al., 1992; Thomason and Osborn, 1992]. The value chosen is roughly twice as large as expected under normal, aerosol-free conditions. The
ratio was assumed to be constant in time because the post-
eruption conditions were essentially present for the bulk of this data-set, certainly for the interesting part of it. It was assumed
TABLE 1. Summar• of lidar characteristics.
CEL LIMA OHP V-IZE ZUBOV doubled
laser type doubled doubled doubled dye; yttrium- Nd-Yag Nd-Yag Nd-Yag R6W aluminum wavelength (rim) 532 532 532 589 539.5 energy/pulse (J) 0.2/0.4* 0.45 0.4/0.3* 0.4 0.2
frequency (see 'l) 30 60 30/50* 5 25
power (W) 6/12' 27 12/15' 2 5
emitted beam width (rad) lX10-4 <lX10-4 lX10-4 5X10⁻⁴ 5X10⁻⁴
receiver tele.diam. (cm) 120 (8x) 50 80 110 110
filter FWHH (nm) 1 1 1 0.8 0.5
vertical resolution (m) 300 300 300 300 150
* since 1/92; , since 30/11/91
1964 Avdyushin et al.' Pinatubo Aerosols from Lidar Network -100 -80 -60 -40 -20 0 20 40 60 ... .:...:: ... ... ...
...
... .... ...
• " "• :• • • Lidar: • 0 ... ( -.•-• ... • ... •-...•- .... ß CEL/0HP (532nm) FO: /
/
-2o ' , ' I ' • ' :, ' :l ' I ' "i •' / © -100 -80 -60 -40 -20 0 20 40 60 Longitude (deg)Fig. 1. Path of the 3 ships, PROFESSOR ZUBOV, PROFESSOR
VIZE and HENRI POINCARE (LIMA) am shown on a Mercator
projection along with the locations of the fixed stations, CEL,
OHP and FRA.
constant with altitude because applicable measurements of this
constant are highly limited. [•aer is the scattering coefficient of
the Mie scattering from aerosols, obtained from,
[l,,,(z)
= (SR(z)- 1).
[1,,,
(z)
(2)
where SR(z) is the scattering ratio obtained from the lidar
measurements
[Nardi
et al., this
issue]
and
13R,y
is the Rayleigh
backscattering coefficient at 532 nrn, 5.7x10 -32 m2sr 4. The
wavelength dependence of the Rayleigh scattering cross
section is accounted for in the VIZE data (589 nm) with a correction factor of (589-4/532 -4 = 0.666). The optical
thickness given at 15 km altitude is calculated as,
'qSkm
= l:•sc•(z)
dz
ß(3)
Data-set
The paths of the three ships, ZUBOV, VIZE and LIMA,
during the period of measurements are summarized in Figure 1. The locations of the fixed stations, CEL and OHP are shown as asterisks.
The ZUBOV lidar made measurements during 48 nights
within the 73 day period between l 1-July-1991 and 21-
September- 1991. During the measurement sequence, the ship
,,..:
40 I JUL91
- 21SEP91
ZUBOV-51 539
nm,
40
Lat,tude
--J o o 200 210 220 230 240 250 260
l
F-: Optical Thickness I I t ! I I 200 210 220 230 240 250 260 35 .-.... Extinction [1/km] E 30 ABOVE 0060 ._• 0050,0 060 0.040- OO50 (],) o 030 - o 040 'tD 25 .-, . 0025 0.030 :D • o.o2o- 0025 • • 0.0•5- O020 • ,,l oo.',o- oo15 <[ 20 •:' '• o. oo• - o ooo1- 0.005 I BELOW o,om 192 202 212 222 232 242 252 262Time (day)- 1991
Fig. 2. The ZUBOV extinction coefficient, measured at 539 nm
is shown as a function of time and altitude. Markers are placed on the abscissa above and below the map to indicate where data is available. The line plots above show the total optical depth at 15 km and the latitude position of the ship, respectively.
• •o
...26JAN92-
20FEB92
VIZE-58
:,;' ; ....589
•o Lat,tude• ' 0 03 275 30,0 325 310 37• 40.0 425 4.50 475 500 03 . . Ttmkness
Oøø +
,•, ,,',
.... ,,,,• ,,,, .... , ,,,•,.oo
275 300 32b •.0 375 400 425 450 47,5 35 ---'-- Extinction [1/km] E 30 ABOVE 00•0 • 0.05o- 0060 0.040- 0050 (].) 0O30- 0.040 • 25 ._ o025 - 0o3o :23 0.020- 0•02õ • O,Ot5- 0020 '--' oolo- o.o•<[ 20
I
00o,3-
oreo
I oom- 0005 I BELOW 26 31 36 41 46 51Time (day) - 1992
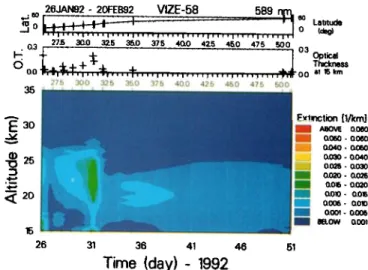
Fig. 3. The VIZE extinction coefficient, measured at 589 nm is
shown as a function of latitude and altitude with the same
format as in Figure 2.
followed a triangular route from 40 ø latitude in the Atlantic Ocean, toward Cuban waters and down to 10 ø latitude, toward
the west coast of Africa and finally northward toward the
northwestern coast of Spain. A large fraction of the data are
confined to the 8øN-22øN latitude range. The extinction coefficient and optical thickness obtained on this path are plotted in Figure 2 along with the latitude position of the ship. The VIZE lidar made measurements during 20 nights within the 26 day period between 26-January-1992 and 20-February- 1992. During the measurement sequence, the ship followed a northward route from the south-Atlantic, toward the northwestern coast of Spain and back to St. Petersburg. Data were obtained between latitudes 8øS-34øN and 56øN-60øN,
separated by a 15 day gap. The extinction coefficient and
optical thickness are plotted in Figure 3.
The LIMA lidar made measurements during 26 nights
within the 198 day period between 3-June-1991 and 17- December-1991. During the measurement sequence, the ship
made a round trip from the northwest of France to the mid-
Atlantic, in the latitude region 38øN-49øN. The extinction coefficient and optical thickness are plotted in Figure 4.
The two stationary ground-based lidar stations have been
running in an operational mode: OHP since 1978 and CEL
since 1986. We have isolated the data since July 1991, two
04JUN91 - 21DEC91 LIMA 532 nm
' • ' ' (deg)
O O0
, ' I•
' l! , , , , ! , , , , , . , , , , ,,., , , , -,,
, , , O0
a!
I5
km
17,5 200 225 250 275 300 325 350 3,5 ... Ex tinchon [1/km] E 30 ABOVE 0020 v 0,018- 0020 v 0.015- 0.018 (D oo•. 0.015 -(D 25 omo- o. ot3 • 00o8- oolo • 0006- ooo8 +"""' 0,004- 0006 • 20 o. oo• - 00o4 II oom- 0oo2 m BELOW 0001 15 152 202 252 302 352Time (day)- 1991
Fig. 4. The LIMA extinction coefficient, measured at 532 nm
is shown as a function of time and altitude with the same
Avdyushin et al.' Pinatubo Aerosols from Lidar Network 1965
6JUL91 - 8JUL92 CEL [44øN,1øW] 532 nm
oo I1• .... ,,•, , ... 200 250 300 350 400 450 5(X::) [560 35 Optical Thickness •1ower boundary Extinction [1/km] • 30 I ^•ovE 0020 ._• 0 018.0 020 v , 00•6. 0018 (D 0013 00•5 '1• 25 omo. oo13 • . 0•8 00• ß • I o•- o• • t 0004 - 0• • 20 • o•- o• o•2 15 183 243 303 363 423 483 543
1991 Time(day) 1992
Fig. 5. The CEL extinction coefficient, measured at 532 nm is
shown as a function of time and altitude. Black masks
suppress regions where no data are available over extended
periods or altitude ranges. Note that the optical depth plot above indicates the optical depth at the lowest available
altitude, not necessarily 15 km.
weeks after the Pinatubo eruptions of 12-16 June, which also
correspond to the times where ship-borne data are available.
Extensive data available for June show no signs of aerosols
and are not reported here. The lidar station at CEL obtained
measurements during 81 nights within the 369 day period
between 6-July-1991 and 8-July-1992. The extinction
coefficient and optical thickness are plotted in Figure 5. The
lidar station at OHP obtained measurements during 149 nights
within the 416 day period between 1-July-1991 and 19- August-1992. The extinction coefficient and optical thickness
are plotted in Figure 6.
In all of these figures the altitude dependent extinction
coefficient is shown as a function of time, with the total optical
thickness (down to 15 km) plotted overhead. The abscissa is
given in the day of the year; in the jump from 1991 to 1992 the
day numbers continue to increase from 366 upwards. It is
important to note that markers are placed on the abscissa above
and below the map to indicate nights where data are available.
Black masks are placed over the larger areas where no data are
available to avoid misinterpretation of structure artificially
introduced by the interpolation. Note that the color scale used
with the CEL, OHP and LIMA plots is different from that used
with the Russian data because much lower extinction values
were obtained at midlatitudes.
1JUL91 19AUG92 OHP[44øN 6øE] 532 nm
L
Thickness
O0 ',•:• .... 2• 260 3• 350 4• 4• 600 •50 Ex tinction [1/km] t;:: 30 AaOV• oo2o ..• ocrl8.0O20 v 0Ol6- 0018 (:D 0 0;3 - 00• '1• 25 • oo•. oo13 • i 00o8- oolo .-•_ f o•x•- • I ooo4- oooe oooi. o002 •- i•LOW 0001 15 183 243 303 363 423 483 543 5981991 T•me(day) 1992
Fig. 6. The OHP extinction coefficient, measured at 532 nm
is shown as a function of time and altitude with the same
format as in Figure 5.
Comparison
Individual profiles are compared where a reasonable degree
of coincidence occurs, that is where existing measurements are
within less than 1000 km and 24 hours of each other. In this
data-set, coincidence occurred only for the stationary sites,
CEL and OHP, as well as with a lidar facility stationed at Frascati, Italy (FRA: 41.8øN, 12.7øE) [Gobbi et al., 1992].
The ship-borne measurements given here covered specific
regions in the Atlantic Ocean and therefore coincided neither
with the stationary sites nor with each other.
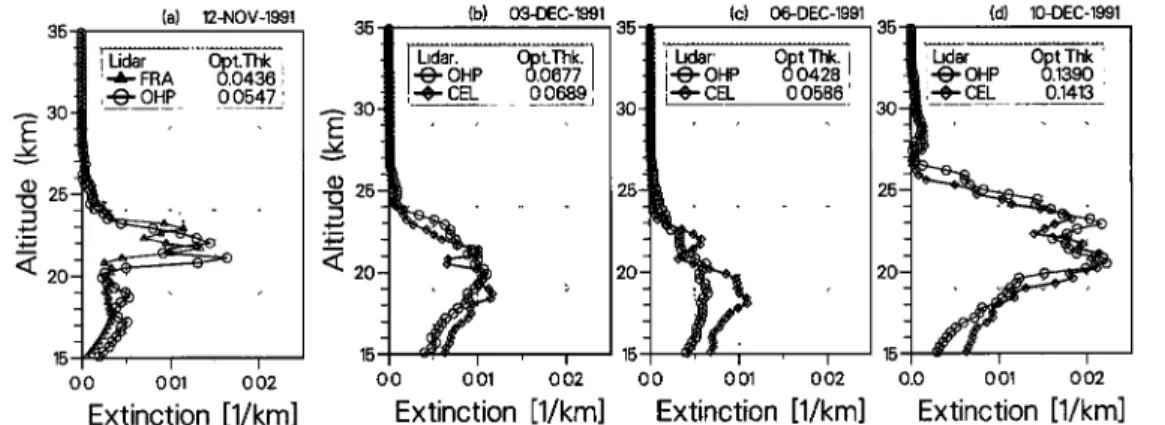
Figure 7 shows a comparison of several individual extinction coefficient profiles between the various stationary
sites. Extinction coefficients for Frascati were calculated using
the scattering ratio profiles given in Gobbi et al. [ 1992] and
were compared with OHP measurements (Figure 7a). The
vertical structure and the magnitude of the extinction coefficient are very similar, with a slight difference in peak
altitude of the layer. In the 3 part sequence of Figure 7(b-d),
extinction coefficients from the OHP and CEL lidar stations
are compared for 3 nights within an 8 day period. On any
given night a difference in the fine vertical structure of the extinction coefficient is observed between stations, however the total optical thicknesses above 15.1 km are comparable. The first plot (b) shows an aerosol feature centered at 20 km, while the last plot (d) shows a significantly stronger double
peaked
feature
with extinction
coefficients
reaching
0.02 km
-]
at 21 and 23 kms. Both plots show a high level of similarity
(a) 12-NOV-1991 (b) 03-DEC-1991 (c) 06-DEC-1991 (d) 10-DEC-1991
35-•, .... 135 • : . : : 135
35 j Li•lar:
ß •FRA"' 6pt.
0.0436 ITl•k.
I J I i Li•lar:
J I•OHP' •pt.T•k.
0.0677 J I j I•OHP'1 I'l'
Li•ar:
= 6pt.T•k.
O.O428Jj 'J •Li•ar:
I '•OHP- dpt.Tffk.
O.1390:"'
•,v v
...
...
...
...
...
...
...
I
15-
15 ...
• 15 ...
• 15
•
0.0 0.01 0.02 0.0 0.01 0.02 0.0 0.01 0.02 0.0 0.01 0.02
Extinction
[1/km]
Extinction
[1/km] Extinction
[1/kin] Extinction
[Vkm]
Fig. 7. The extinction
coefficient
profile at 532 nm are stations
atOHP and
CEL (44øN,
løW). The distance
between
comp•ed
(a) between
the lidars
of Frascati
(41.8øN,
12.7øE) lid• stmions
in •1 cases
shown
is approximately
600 km •e
and OHP (44øN, 6øE). Similar comparisons are shown for 3 total optical thicknesses above 15.1 km are indicated in the profiles within an 8 day period (b), (c), (d) between the lid• legend boxes.
1966 Avdyushin et al.: Pinatubo Aerosols from Lidar Network between the aerosols over two stations (<2% difference in
optical depth). However in the plot (c), both the vertical
structure and the optical depth show a greater disparity (25%
difference in optical depth). It is probable that the boundary of
a strong aerosol cloud is passing overhead in (c), causing the
difference over the 2 stations in this transition stage.
It is also of benefit to compare optical depths obtained by
ZUBOV at the lower latitudes with independent measurements
made with different techniques. Optical depths were obtained by Valero et al. [1992] using airborne radiometer
measurements of the solar radiative flux within the wavelength
range 380-1064 nm. His values of optical depth at 500 nm of
0.15 - 0.3 in the latitude range 20øN-10øN respectively, are
slightly higher than the ZUBOV optical depths at 532 nm of 0.05 - 0.2 in the same latitude range. However this difference can be attributed, at least in part, to the wavelength difference of the measurements; the optical depth is expected to decrease at higher wavelengths in this spectral region.
Discussion
The data show that there is a great deal of variability in the
structure of the aerosol cloud. However, it can be generally
stated that the extinction coefficients indicate presence of
aerosols primarily in the altitude range of 17-25 km, though
they have on occasion been measured as high as 32 km.
Comparison of the generally low latitude measurements of
ZUBOV and VIZE with those at the midlatitude region of OHP,
CEL, LIMA shows that at low latitudes there is a presence of a
strong high altitude cloud at 24 km as well as a weaker low altitude cloud at 17 km, whereas at midlatitudes there is the
persistent presence of only the lower altitude cloud near and
below 20 km with weaker, higher altitude features that pass
through sporadically.
At low latitudes (equatorward of 40øN, primarily between
8øN-22øN) the mean optical depth was 0.1 and reached values
of almost 0.2 on a regular, nearly periodic basis. The
maximum extinction coefficient was 0.08 km 4 at 23-24 km
measured by ZUBOV in July 1991 (day 217).
At midlatitudes (40øN-44øN), the first evidence of aerosols
appeared in early July at altitudes of 15-17 km, in agreement
with Gobbi et al. [ 1992], with measured extinction coefficients
of 0.013 km 4 at OHP (day 183) and 0.0024 km 4 at CEL (day
188). The first clear evidence of elevated aerosol
concentrations above 18 km appeared at CEL and LIMA on
21-September-1991 (day 264), with extinction values of
0.0025 km 4. High extinction levels at this altitude were first
detected at all three midlatitude sites during the second week of
October (days 280-286), when extinction coefficients of up to
0.017 km 4 were measured at CEL. On average, the optical
depth at midlatitudes was near 0.05. However on one occasion (December 8-11; days 342-5), both CEL and OHP
measured high optical depth values of up to 0.125 with peak
extinction coefficients of 0.021 km 4 at 23 km (CEL). On this
same occasion, higher than normal extinction values (up to
0.001 km 4) were measured at record high altitudes (near 30
km) by all three midlatitude sites.
The data at CEL in the 6 month period after January 1992
have been normalized to the mean OHP measurements of the
same period because low extinction values at the CEL station
resulted from a polarization effect introduced into the detected
signal by the beam splitter. Though there is some evidence of
periodic behavior in OHP, CEL and LIMA data, it is by far much less pronounced than for the lower latitude data of
ZUBOV, which is further studied in the follow-up article [Nardi
et al., this issue]. This means that aerosol features detected are
probably aerosols that have broken off from the main low
latitude cloud and that pass through the field-of-view of the
midlatitude lidars one time on their way to higher latitudes.
Care should be used in interpreting the data because it is not
always available at evenly spaced intervals. One can see that in
the measurements of CEL, OHP and LIMA, significantly long
data gaps may exist. One consequence of this is that certain
aerosol features may be missing in the data presentation.
The data presented here shows clearly, the advantage of
having a network of ground-based and ship-borne lidar
facilities to obtain the medium and long term behavior of the
aerosol cloud on a global basis.
Acknowledgements. The contribution to this work by B.
Nardi was supported by the NSF Program for Long and
Medium Term Research at Foreign Centers of Excellence;
grant number INT/9101978 to the University of Michigan.
The authors wish to thank the anonymous reviewers as well as
A. Sarkissian for their helpful comments.
References
Avdyushin, S.I., G.F. Tulinov, M.S. Ivanov, B.N.
Kuzmenko, I.R. Mezhuev, Y.P. Dudoladov, Lidar
observations of Pinatubo eruption products in the Atlantic
stratosphere from PROFESSOR ZtmOV and PROFESSOR VIZE
research ships. Report of the Academy of Science of Russia [in press, 1992].
Chanin, M.-L., A. Hauchecorne, Lidar study of the structure
and dynamics of the middle atmosphere, Indian J. Radio
Sp. Sci, • 1-11, 1991.
Deshler, T., D.J. Hofmann, B.J. Johnson, W.R. Rozier,
Balloonborne measurements of the Pinatubo aerosol size
distribution and volatility at Laramie, Wyoming during the
summer of 1991, Geophys. Res. Lett., 19, 199-202, 1992.
Gobbi, G.P., F. Congeduti, A. Adriani, Early stratospheric
effects of the Pinatubo eruptions, Geophys. Res. Lett., 19,
997-1000, 1992.
Hauchecorne, A., M.-L. Chanin, P. Keckhut, Climatology
and trends of the middle atmospheric temperature (33-87
km) as seen by Rayleigh lidar over the south of France, J. Geophys Res., 96, 15297-15309, 1991.
Hauchecorne, A., M.-L. Chanin, P. Keckhut, D.
Nedeljkovic, LIDAR monitoring of the temperature in the
middle and lower atmosphere, Appl. Phys. B, Photo-
physics and Laser Chemistry, B55, 29-34, 1992.
J•iger, H., D. Hofmann, Midlatitude lidar backscatter to mass,
area, and extinction conversion model based on in situ
aerosol measurements from 1980 to 1987, Appl. Opt., 30,
127-138, 1991.
Nardi, B., M.-L. Chanin, A. Hauchecorne, S.I. Avdyushin,
G.F. Tulinov, M.S. Ivanov, B.N. Kuzmenko, I.R. Mezhuev, 2. Morphology and dynamics of the pinatubo
aerosol layer in the northern hemisphere as detected from a
ship-borne lidar, Geophys. Res. Lett., [this issue].
Thomason, L.W., M.T. Osborn, Lidar conversion parameters
derived from SAGE II extinction measurements, Geophys.
Res. Lett., 19, 1655-1658, 1992.
Valero, F.P.J., P. Pilewskie, Latitudinal survey of spectral optical depths of the Pinatubo volcanic cloud_derived particle sizes, columnar mass loadings, and effects on
planetary albedo, Geophys. Res. Lett., 19, 163-166, 1992.
Weinmann, J.A., Derivation of atmospheric extinction
profiles and wind speed over the ocean from satellite-borne
lidar, Appl. Opt., 27, 3994-4001, 1988.
S. I. Avdyushin, M. S. Ivanov, B. N. Kuzmenko, I. R. Mezhuev, G. F. Tulinov, Federov Institute of Applied
Geophysics, Rostokinskaya st. 9, 129226 Moscow, Russia.
M.-L. Chanin, A. Hauchecorne, B. Nardi, Service
D'A6ronomie, Centre National de la Recherche Scientifique,
B.P. N o. 3, 91371 Verri•res le Buisson CEDEX, France.
(Received: 24 August 1992;
revised: 16 December 1992;