Design and Process Solutions for Decreasing Vendor Defects
byMichael Joyce
B.S. Industrial Engineering & Operations Research University of California, Berkeley, 2006
Submitted to the MIT Sloan School of Management and the Engineering Systems Division in Partial Fulfillment of the Requirements for the Degrees of
Master of Business Administration and
Master of Science in Engineering Systems
AFcN
eI
MASSACHUSETTS INST TUTE
In conjunction with the Leaders for Global Operations Program at the OF TECHNOLOGY
Massachusetts Institute of Technology
MAY 3 0
20
June 2013
© 2013 Michael Joyce. All rights reserved.
D. ARIES
The author hereby grants permission to reproduce and to distribute publicly paper and electronic copies ofthis thesis document in whole or in part in any medium now or hereafter created.
Signature of Author Certified by Certified by Certified by Accepted by Accepted by
Engineering Systems Divi s "MIT Sloan School of Management May 10, 2013
Roy Welsch, Thesis Supervisor Professor of Statistics and Management Science and Engineering Systems MIT Sloan School of Management
Qi D. Van Eikema Hommes, Thesis Supervisor Research Associate, Engineering Systems Division
#2''
Don Rosenfield, Thesis ReaderSenior Lecturer, MIT Sloan School of Management
Oli de Weck, Chair, Engineering Systems Education Committee Professor of Aeronautics and Astronautics and Engineering Systems Engineering Systems Division
Maura Herson, Directok MIT Sloan MBA Program MIT Sloan School of Management
This page intentionally left blank.
Michael
Joyce
Page 2Software and Process Solutions for Decreasing Vendor Defects
byMichael Joyce
Submitted to the MIT Sloan School of Management and the Engineering Systems Division on May 10, 2013 in Partial Fulfillment of the Requirements for the Degrees of Master of Business Administration and
Master of Science in Engineering Systems
Abstract
Why do some new initiatives fail while others succeed? This thesis attempts to answer this complex question by investigating the failure of a defect tracking initiative at Amazon and examining how a reintroduction of the process succeeded.
Amazon is a very complex and dynamic organization that has both a corporate headquarters as well as a regional fulfillment centers. In distributed organizations like this, successfully implementing network-wide process improvements can be critical to the success of the business. Consequently, Amazon is constantly attempting to roll-out new improvement efforts. Unfortunately, some of these initiatives fail to reach their full potential.
Common suggestions for the failure of initiatives include lack of management support, poor technology, limited communication, or lack of vision. This thesis argues that while these suggestions are valid and important when designing a process, these alone cannot by themselves show whether the initiative is destined for success or doomed to failure. To better understand the success rate of the initiative, one must do a deep dive into the incentive structure, motivations, and perceptions of all stakeholders involved in a new process.
In 2010, Amazon introduced a defect tracking tool. Adoption grew during the first five months, but declined rapidly during the second half of the year. In 2012, 1 reintroduced the same defect tracking tool but made a number of minor changes to the process. Over the course of 2012, the project resulted in nearly 300,000 defects and nearly one million dollars in vendor chargebacks. More than 50,000 defects were filed in the month of December alone, compared to less than 4,000 in the month January.
Approximately 1000 people used the tool at more than 30 different sites.
This thesis illustrates how system dynamics modeling of the Amazon defect tracking process can be an effective tool for a more complete understanding of adoption or abandonment rates. At a broader level, this thesis discusses methods for designing new processes or modifying existing ones so they are more likely to succeed.
Thesis Supervisor: Roy E. Welsch
Title: Professor of Statistics and Management Science and Engineering Systems Thesis Supervisor: Qi D. Van Eikema Hommes
Title: Research Associate, Engineering Systems Division
This page intentionally left blank.
Michael
Joyce
Page 4Acknowledgments
The research work in this paper would not be possible without the support of many generous and intelligent people. I would like to thank my MIT advisers, Dr. Qi Hommes and Professor Roy Welsch for their hard work on this thesis. They challenged my thought process, provided external insight, and allowed me to apply my classroom knowledge to the real world.
I would also like to thank Amazon.com for its sponsorship of this project and for its continued support of the Leaders for Global Operations program. Special thanks go to Laura Kaegenbein, Erin McGraw, Maneesh Jyoti, Bill Campbell, Wendy Tse, and Bijal Metha as their time, mentorship, and suggestions on the defect tracking process were critical to the success of the project. I would like also to acknowledge the Leaders for Global Operations Program for its support of this work.
Finally, I would like to thank my parents and brother for their continued support. Their phone calls and encouraging messages brightened my day and helped me get through these past two years.
Page 5 Michael Joyce
This page intentionally left blank.
Michael
Joyce
Table of Contents
Abstract ... 3
A cknow ledgm ents...5
Table of Contents ... 7
List of Figures ... 9
1 Introduction...10
1.1 Project M otivation...10
1.2 Problem Statem ent ... 11
1.3 Project Goals ... 11
1.4 Thesis Overview ... 12
2 Introduction to Am azon.com ... ... 12
2.1 Am azon.com Supply Chain... 14
2.1.1 Supplier M anagem ent at Am azon.com ... 15
2.2 ACmazon.com FC Operations... 15
2.2.1 Inbound Operations...16
2.2.2 H istory of the Defect Tracking Initiative ... 17
3 Literature Review ... 18
3.1 The Four Contradictions...18
3.2 Reengineering Revolution...19
3.3 M cK insey 7S Fram ew ork...20
3.4 Brief Review of System Dynam ics...21
3.4.1 Stock and Flow Diagram s ... 21
3.4.2 Causal Loops ... 21
3.4.3 D elays...22
4 Problem Analysis ... 23
4.1 Defect Tracking Process Overview ... 23
4.1.1 Failure M ode #1: M anagem ent Pressure... 26
4.1.2 Failure M ode #2: Delays in Supplier Behavior Changes ... 27
4.1.3 Failure M ode #3: Software G litches... 28
4.1.4 Failure M ode #4: Hardware Problem s ... 30
4.1.5 Failure M ode #5: M isaligned Incentive Structures ... 31
4.1.6 Failure M ode #6: Conflict w ith other Initiatives... 32
4.1.7 Failure M ode #7: M isinform ation... 33
4.2 Sum m ary of Failure M odes... 33
5 Solutions...34
5.1 M ethodology/Im plem entation Approach ... 34
5.1.1 Attacking Failure M ode #1: M anagem ent Pressure ... 34
5.1.2 Attacking Failure Mode #2: Delays in Supplier Behavior Changes ... 36
5.1.3 Attacking Failure M ode #3: Software Glitches... 38
5.1.4 Attacking Failure M ode #4: Hardw are Problem s... 39
5.1.5 Attacking Failure M ode #5: M isaligned Incentive Structure ... 41
5.1.6 Attacking Failure M ode #6: Conflict w ith other Initiative... 46
5.1.7 A ttacking Failure M ode #7: M isinform ation ... 47
5.1.8 Other Changes ... 47
5.2 D iscussion of Results ... 48
5.2.1 Defect Tracking...4...48
5.2.2 V endor Chargebacks ... 51
6 Recom m endations & Conclusions...53
6.1 Process Flexibility ...-... 53
6.2 Partial Solutions W ork ... 54
6.3 Incentive Structures...55 6.4 Supplier Evaluations... 56 6.5 Supplier Reactions ... 57 6.6 Further Study...58 7 References...- ---..- -.. -... ---... 60 Michael Joyce
List of Figures
Figure 1. Amazon Virtuous Cycle...13
Figure 2. Amazon Revenue Trend [4,5,6]... 13
Figure 3. Amazon Net Income Trend [4,5,6]... 14
Figure 4. Dock, Receive, and Problem Solve Diagram... 16
Figure 5. Stock-Flow Diagram ... 21
Figure 6. Causal Loop Diagram ... 22
Figure 7. Causal Loop Diagram ... 23
Figure 8. Defect Tracking Process Overview... 24
Figure 9. Increase in Time per Task...25
Figure 10. M anagement Pressure ... 26
Figure 11. Delays in Behavior Changes... 28
Figure 12. Impact of Software Glitches on Process ... 29
Figure 13. Impact of Hardware Problems ... 30
Figure 14. Attacking M anagement Pressure ... 35
Figure 15. Attacking Delays in Supplier Behavior Changes... 37
Figure 16. Site Chargeback M etrics...38
Figure 17. Attacking Software Glitches... 39
Figure 18. Attacking Hardware Problems ... 41
Figure 19. Tracking Defects - Initial Roll-out ... 42
Figure 20. Tracking Defects - Re-introduction... 43
Figure 21. Regional Director M etrics #1... 44
Figure 22. Regional Director M etrics #2... 45
Figure 23. 2012 Defects Tracked ... 49
Figure 24. Comparison of six key defects and all other defects... 50
Figure 25. Defect Tracking Vendor Chargebacks 2010-2012... 53
Figure 26. S-shaped Learning Curve [10]... 55
Figure 27. Defect Tracking Vendor Chargebacks 2010-2012... 58
Figure 27. W eek over W eek Defect Trend... 59
Figure 29. W eek over W eek Defect Trend... 59
1
Introduction
The purpose of this thesis is to identify methods for implementing large-scale improvement initiatives across a network of sites. The research project was done as part of an internship at
Amazon.com from February 2012 to August 2012 in conjunction with the Leaders for Global Operations program at the Massachusetts Institute of Technology. This thesis is a result of this internship and the collaboration between Amazon.com and MIT faculty.
1.1 Project Motivation
Jeff Bezos, Amazon.com's founder and CEO built the company to be "Earth's most customer centric company" [1]. As a consequence, Amazon.com strives to provide both a diversity of products and low prices to its customers. This has led to a proliferation in the number of suppliers to Amazon.com and has increased the complexity of the process that brings products from its suppliers into Amazon's
fulfillment centers. From time to time, the shipment from suppliers may have mistakes including missing barcodes or expired product. Consequently, the amount of time fixing incoming product that does not meet Amazon specifications has continued to increase while the standard processes (pick, pack, receive, etc.) have seen improvement in rates. By gathering information about the defects from suppliers, Amazon.com would be able to both improve vendor management as well as receive remuneration for these defects in the form of vendor chargebacks.
In 2010, a defect tracking initiative was rolled out across the Amazon fulfillment network in an effort to both better understand and correct this problem. Despite strong adoption initially, within only a few months, usage of the tool plummeted. By early 2012, usage of the defect tracking had almost stopped entirely and vendor chargebacks were all but non-existent.
This thesis examines the reasons as to why the initial roll-out of the defect tracking software failed and then highlights the changes made for the re-introduction of the tool in 2012. Specifically, it identifies potential failure modes of the original roll-out through the use of system dynamics modeling, game theory, and qualitative interviews and shows how these potential failure modes were corrected in the 2012 roll-out.
Michael
Joyce
Page 101.2 Problem Statement
Large-scale vendor management can be extremely complicated but it is important to do it right for financial and business purposes. Supplier management at Amazon was hindered by the lack of defect data. Suppliers are managed by teams based at Amazon.com's headquarters in Seattle, WA. These teams have limited visibility into product defects that suppliers send to Amazon fulfillment centers. This was suboptimal as it failed to take into account the true landed cost of bringing a product into an Amazon fulfillment center and does not account for variations and ability of suppliers to adhere to Amazon shipment requirements. By gathering data about the frequency, type, and cost of defects from suppliers, vendor managers could be better equipped to understand the quality of different suppliers and for certain defects and Amazon would be able to recoup the additional burden of these defects. Furthermore, improving vendor management had the potential to increase the speed and reduce the costs associated with bringing product into a fulfillment center.
Amazon recognized these issues and developed a defect tracking process to capture relevant supplier defect data. However, only a few months after the process was introduced, adoption rates plummeted leading to the eventual abandonment of defect tracking. Although the reasons for defect tracking appear clear and universally supportable, the initiative failed as a result of incentive
misalignment, misinformation, pressure from management, delays in the process, conflicting processes hardware problems, and software bugs.
1.3
Project Goals
Despite an impressive track record of growth and process improvements at Amazon, there are still significant opportunities that can have a major impact on Amazon's bottom line. This thesis indicates how one initiative - defect tracking - can be modified in order to improve results. The goal of this project is to help Amazon identify why the initial push to use defect tracking software failed at Amazon and search for solutions for these problems. This will include analysis of the initial process and an examination of the results of the reintroduction of the defects tracking tool. It will also look at the implications this data has on vendor management at Amazon and how these efforts can be applied more generally across industries. These findings are intended to help understand methodologies and practices that will ultimately lead to better initiative introductions at large organizations.
1.4 Thesis Overview
This thesis document is organized as follows: Chapter 2: Introduction to Amazon.com
This section has a discussion of general background of Amazon.com and their current supply chain. It discusses the inbound process at Amazon and general vendor management policies. Chapter 3: Literature Review
This section reviews ways for improving the design of processes including system dynamics. Chapter 4: Problem Analysis
This section analyses the potential failure modes for the defect tracking process using system dynamics modeling and qualitative interviews.
Chapter 5: Solutions
This section describes the ways in which the reintroduction of the defect tracking process attempted to resolve the various failure modes. It also discusses the results of the new initiative. Chapter 6: Recommendations and Conclusions
This section lays out recommendations for maintaining and expanding the defect tracking initiative as well as how the thesis findings can be applied more broadly to other organizations.
2
Introduction to Amazon.com
Amazon.com has transformed the retail industry by providing unparalleled selection, low prices, and outstanding customer service. With product recommendations from Amazon.com and customer reviews from users, consumers can easily determine the best product for their needs. In addition, new
innovations, including Amazon Prime, Amazon Fresh, and Amazon Locker, have improved the customer experience. As a result, Amazon.com has experienced dramatic growth. In 1994, Jeff Bezos founded Amazon and began working in his garage. Today, Amazon has more than 80,000 employees and has a market capitalization of over $120B [2].
Amazon attributes much of this growth to the virtuous cycle or Amazon's flywheel [3][Figure 1]. The internal loop in the diagram can be explained as follows. As selection on Amazon.om increases, it improves the customer experience. This leads to greater online traffic which draws more sellers to Amazon. This in turn leads to additional selection further improving the customer experience. This
Michael
Joyce
Page 12continual cycle drives growth, leading to economies of scale (i.e. a lower cost structure) which reduces prices further improving the customer experience and driving growth. Amazon has to date done a great job and their revenue results illustrate this flywheel in effect.
Seleck n
Figure 1. Amazon Virtuous Cycle
From a very modest beginning, Amazon's revenue has almost exponentially grown over the last decade reaching over $60B in 2012 [Figure 2]. Despite the US recession in 2008 and 2009, Amazon continues to show year-over-year revenue growth.
Figure 2. Amazon Revenue Trend [4,5,6]
Michael Joyce Page 13
Amazon.com Revenue
(in millions) $70,000 $60,000 $50,000 $40,000 $30,000 E Net Sales $20,000 $10,0001 $0 -H . LAt rW oo o0 a~ 0 4 m Iic Ln w r- 00 Oi 0 -4 rN On O) 0) Oy) 0) 0 0 0 0 0 0 0 0 0 0 q-4 V-4 r-r-4 v-4 v-4 v-4 v-4 C4 "N (N4 r-4C r (N -4 r-N (N 4 r4 r4 C4 "NHowever, despite the increases in revenue, profits have been more varied. After eight straight years of profits, Amazon's net income was negative in 2012.
Figure 3. Amazon Net Income Trend [4,5,61
The purpose of this project is help lower the overall cost structure by eliminating unneeded costs from the inbound process. This will help lower the overall cost structure leading to either net profit increase, a decrease in prices for consumers, or both.
2.1 Amazon.com Supply Chain
Amazon.com's supply chain can be compared to the hub and spoke model. For North American operations, Amazon's headquarters is in Seattle, WA with fulfillment centers located throughout the United States and Canada. Physical operations (receive, pick, pack, and ship) are done at each of the fulfillment centers while the majority of planning (forecasting, transportation, etc.) is done at
headquarters.
In the Amazon network, the two most common types of fulfillment centers are sortable and non-sortable. Sortable fulfillment centers handle the majority of smaller items that can be lifted by associates and shipped in standardized boxes. Non-sortable fulfillment centers handle larger and heavier items including odd-shaped items like televisions. The reason for this distinction is primarily to facilitate processing and shipment of product. For example, the resources needed to ship a 60" television may be Michael Joyce
MIT LGO Thesis
Page 14
Amazon.com Net Income
(in millions) $1,500 $1,000 $500 $0 ($500) ($1,000) ($1,500) ($2,000) E Net Income
very different from what is required for a textbook. Although sortable and non-sortable facilities make up the majority of the network, there are a few other fulfillment centers including replenishment centers. At replenishment centers, larger shipments from carriers are broken down into smaller groups and then sent to sortable or non-sortable facilities accordingly.
2.1.1 Supplier Management at Amazon.com
In the early days of Amazon.com, Amazon was heavily reliant on suppliers. As shown through Amazon's flywheel in Figure 1, Amazon needed suppliers to improve selection, thereby improving the customer experience and driving growth. This reliance on suppliers led Amazon to treat its suppliers
similar to how it treats its customers. Supplier policies were very favorable which enticed companies to sell on Amazon, benefiting both Amazon and the supplier.
However, as Amazon has grown it has gained significant buyer power as it now can provide both volume and growth for many suppliers. Despite this increase in relative power, Amazon has been slow to make major changes with its suppliers. For example, most suppliers send units in packaging that is more
suited for brick-and-mortar stores than for ecommerce although Amazon is working with many suppliers to resolve this.
2.2
Amazon.com FC Operations
The majority of operations within sortable and non-sortable fulfillment centers are broken down into two categories: inbound and outbound. Inbound is commonly referred to as anything having to do with getting the product into a storage place within the building. This includes receive and stow
processes. Outbound operations refer to taking a product from a location within the facility and shipping it to the customer. This includes the pick, pack, and ship processes.
Management at a fulfillment center is generally organized into five distinct levels. The general manager has full responsibility for the building. Directly below him or her are several senior operations managers. These senior operations managers focus on specific areas (i.e. inbound or outbound). Senior operations managers oversee operations managers who in turn look after specific shifts. In each shift, there are area managers assigned to specific areas (receive, stow, pick, pack, and ship). Each area manager then oversees a number of associates who directly work to accomplish the specific tasks.
2.2.1 Inbound Operations
Inbound Operations generally consists of two steps: receive and stow. The receive process can be further broken down into three groupings: dock, receive, and problem solve. When a product enters the building from a truck, associates in the dock area bring out the item and prepare the item to be received. This may include opening boxes, removing some packing materials, sorting the items based on size, or moving the product to receive. Receivers then pick up the product, scan the product into the Amazon system, and put the item in containers so it can be stowed. The problem solve station handles everything that does not follow the standard process. Problem solvers handle problems from both the dock stations (i.e. a box shipped to the wrong warehouse) as well as from receivers (missing barcodes, expired product, etc.).
Receive Dock
r -
~ AI
C)
Figure 4. Dock, Receive, and Problem Solve Diagram
The three groups are measured on progress very differently. Receivers have a specific rate target
(units per time measure) and are measured against this target and given support, coaching, or other help
when this target is not met. Associates on the dock are measured at a less granular level, focusing on the
number of trucks that have been unloaded and the number of shipments that have been brought into the
Michael Joyce
MIT LGO Thesis
Page 16Y
- 0 ON I"
000
P
I" $*Abuilding. Problem solvers are not measured on a numeric rate basis. They are given coaching or additional support when the backlog of problem solves begins to grow significantly.
Data collection among the three groups is also very different. Significant data about the rate, volume, and size of product exists for the receive group and dock team. However, very limited information exists for the problem solve group.
Over the past several years, while receivers have been exhibiting better performance on a rate basis, labor expenditures on problem solvers is growing. Labor hours for problem solvers have grown disproportionally with total volume, increasing by 27% per unit from 2010 to early 2012.
2.2.2 History of the Defect Tracking Initiative
In late 2009 and early 2010, a defect tracking software was developed and implemented across the Amazon fulfillment network. This tracking software was intended to bridge many of the gaps discussed above as well as help with vendor management. The web based software was deployed across all Amazon sites globally. More than 100 different defects could be recorded through the system and vendor chargebacks were implemented for two key defects.
The defect tracking tool was used by two types of associates: receivers and problem solvers. Whenever receivers encountered a problem (i.e. a missing barcode, expired product, etc.) he or she was expected to enter or scan in available information about the item. This information could include the purchase order number, shipment number, item barcode, and quantity. The receiver would then input this item into a barcode tagged container which would later be retrieved by the problem solver. When the problem solver scanned this container, the information input by the receivers was retrieved by the system. The problem solver would then use this information combined with the item to identify and correct the defect so that it could be properly received.
The defect tracking software implemented throughout the Amazon fulfillment center network reaching peak usage in June 2010. However, there were a number of unintended consequences to the process including:
" Management pressure
e Delays in supplier behavior changes " Software glitches
e Hardware problems
e Misaligned incentive structure e Conflict with other initiatives e Misinformation
These ultimately led to abandonment of the process at most sites by the end of 2010. The problem analysis and solution section of this thesis will provide a more detailed description of these possible reasons for abandonment of the tool.
3
Literature Review
A study into the literature highlights that there have been numerous articles and frameworks
created to help explain why processes fail. This section discusses a few of the more popular frameworks and how they might apply to Amazon's defect tracking process.
3.1
The Four Contradictions
In the article, "Why Operations Programs Fail", Robert Kausaf highlights four areas where plans become unclear and ultimately fail [7].
1. "Does the improvement plan issue a clear and communicated strategy that provides a context for
making tradeoffs, determining priorities, and joining departments in a common mission?" In this question, Kausaf shows that while communication or vision statements are often listed as reasons for failure, one must go deeper. It is not enough to provide a broad vision, but rather highlight in what contexts the improvement plan should be followed or adjusted and how priorities should be set. He argues that better planning can lead to better allocation towards strategic priorities leading to the success of improvement initiatives.
2. "Are Management's Actions Consistent with Its New Goals? Has Management Fully Appreciated and Committed Itself to Those Goals?" Lack of management support is often identified as a key issue, but Kausaf points out that management's actions may contradict or appear to contradict management's words. When this occurs, employees are more likely to assume that the actions of management reflect their intentions and as such focus on what they perceive to be important. This can be unfortunate as in many cases, the actions of management
Michael Joyce Page 18
(also known as management style) have been ingrained over many years and cannot be easily changed.
3. "Do Incentives Conflict with the Program Goal?" Incentives are key to human behavior and in many operations examples, employees act rationally based on their incentives. However, these problems can be extremely difficult to correct as both management and workers can be tied to certain performance metrics.
4. "Are Reporting Relationships and Organizational Structure Consistent with Production Imperatives?" In companies with larger groups, reporting relationships can become very important to the success of an improvement project. In a comparison of a product versus a process organization, Kausaf shows that the organization should assess its goals and align its organization accordingly. This may be less relevant at smaller companies, but highlights the need for interconnectivity between groups.
Although these questions spell out major issues that need to be addressed, it can be very difficult to assess these questions prior to implementation of the improvement process. How can process
designers know whether management's actions are consistent with the new goal, prior to its introduction? Consequently, this process is useful at examining why processes fail but it may be more challenging to use for process design.
3.2
Reengineering Revolution
In the Reengineering Revolution, Hammer and Stanton argue that business process reengineering failures can be attributed to the following ten factors [8].
1. High-level managerial misunderstanding of business process re-engineering 2. Re-engineering where it cannot fit
3. Spending too much time analyzing existing processes 4. Lack of leadership
5. Timidity in redesign
6. From new process design to implementation 7. Re-engineering slowly
8. Place some aspects of the business off-limits 9. Adoption of conventional implementation style
10. Ignoring the concerns of employees.
While a large list of potential factors, this list appears to miss many key factors including the culture, incentive structure, and organizational structure. Additionally, these factors can be exceedingly difficult to measure and design for. For example, a lack of leadership can mean a number of things and could almost always be attributed to a process improvement failure. Does a leader need to openly
articulate support? Should the leader be actively involved in the initiative? Should the leader promote or compensate employees based on their performance with the initiative? While the list is interesting and points to some key areas to focus, the factors are vague and can be too broadly defined.
3.3 McKinsey
7S
Framework
While not specific to process improvements, Thomas J. Peters and Robert H. Waterman developed a 7S model that helps to analyze how well an organization is situated to achieve its desired results. The 7-S framework, commonly known as the McKinsey 7-S, identifies three "hard" elements, strategy, structure, and systems, and four "soft" elements, shared values, skills, style, and staff [9].
The hard elements are primarily objects that can be more easily controlled by management. Strategy is managements' plan to build and maintain a competitive advantage. Structure refers to the both the reporting structure of an organization and how units relate to each other. Systems are the processes and routines employed by the organization to complete work. This includes the daily tasks of employees, hiring and promotion, and information systems [9].
The soft elements have more to do with the culture and intangible aspects of the organization. Shared Values are the main beliefs held by employees and the strength of these beliefs. Skills are the capabilities that the employees or the organization as a whole bring. Style refers to the general
management style of an organization as well as its overall effectiveness. Finally, staff is the number of people and the different specializations represented by the team [9].
Despite considerable popularity, one of the key gaps to the McKinsey 7-S framework is that it requires one to be able to objectively effectively describe all seven elements. This can be extremely difficult and consequently there may be major gaps in the analysis.
Michael Joyce Page 20
3.4 Brief Review of System Dynamics
To help understand the methodology and implementation section of this thesis, a brief introduction to system dynamics modeling is included here.
3.4.1 Stock and Flow Diagrams
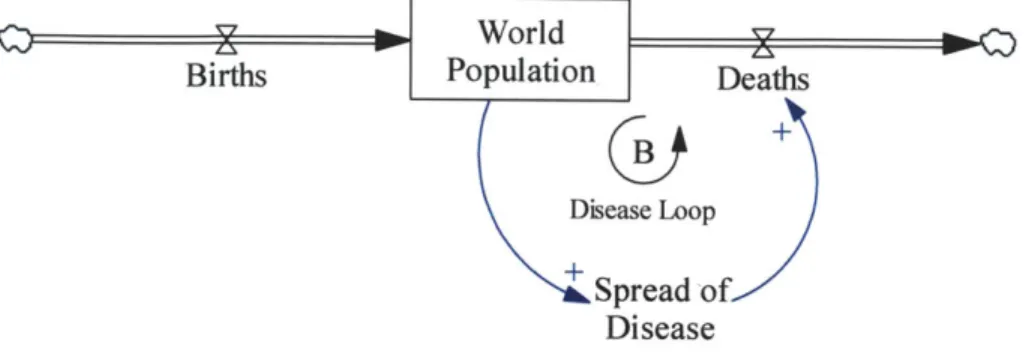
Consider the simple example of modeling the world population. This can be represented using a stock and flow diagram. In this example, there are two flows and one stock. There is an inflow to the population shown as the birth rate and an outflow from the population shown as death rate. The stock in this example is the world population shown in a box in the following figure. Both flows have units of
people/time while the world population would have units of people.
O
E
B-
World
g.
Births Population Deaths
Figure 5. Stock-Flow Diagram
3.4.2 Causal Loops
The stock and flow diagram can be built upon using causal loops. Consider the idea that as the world population grows so does the spread of disease. This is represented by an arrow between world population and spread of disease. As this is a positive effect (an increase in population leads to an
increase in the spread of disease), there is a positive sign on the arrow. Similarly, the spread of disease increases the likelihood of death, shown through the arrow from spread of disease to death rate. This loop is considered a balancing loop and is represented by the B with counter-clock wise arrow labeled Disease Loop. It is a balancing loop because as the world population grows, the spread of disease also grows and so does the death rate. With an increasing death rate, the world population declines, bringing it more in balance.
Births
Figure 6. Causal Loop Diagram
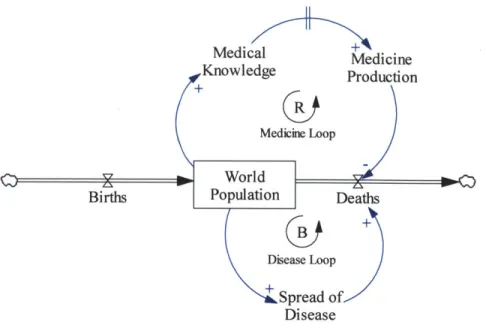
3.4.3 Delays
Causal loops can be adjusted for delays. For example, we could argue that as the world population grows, our knowledge about medicine also grows. This is represented as an arrow with a positive sign from world population to Medical Knowledge. As we gain knowledge about medicine, we begin to produce medicine shown as an arrow from medical knowledge to medicine production. On this arrow, there are two parallel lines indicating a delay. This means that there is a time delay between when we gain medical knowledge and when we produce medicine. Eventually, the medicine production leads to a lower death rate as indicated by the arrow with the negative sign. This loop is considered a
reinforcing loop because as the world population grows, the medicinal knowledge and medicine
production grow leading to a lower death rate furthering the growth of the population. This is represented by the R symbol with counterclockwise arrow labeled as Medicine Loop.
Michael Joyce
Medical Medicine
:nowledge Production
Births Population Deaths
B +
Disease Loop
+ Spread of Disease
Figure 7. Causal Loop Diagram
4 Problem Analysis
To understand why the initial roll-out of the defect tracking software had failed and to develop a better process for defect tracking, system dynamics modeling was used to identify potential failure modes. These failure modes are derived from the perspective of the associate, or the end-user of the tool. Failure modes caused by management or corporate structure are also addressed, but not explicitly shown using system dynamics modeling.
These models were developed through observation at various Amazon facilities and interviews with associates and management. The interviews were taken over a six month period with individuals at various levels in the organization. The key findings from these interviews and observations have been summarized as failure modes and are addressed in this section.
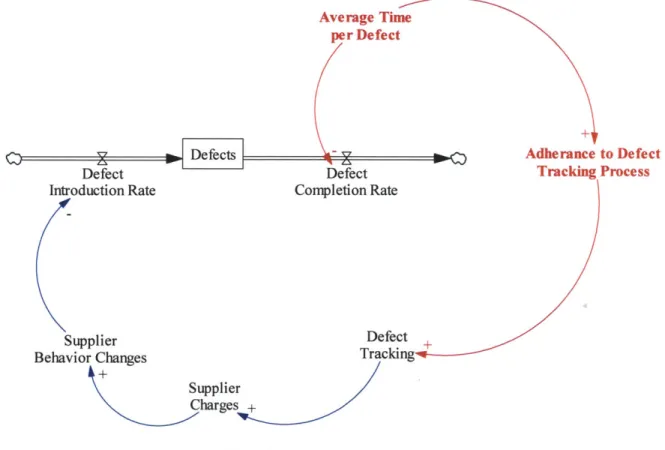
4.1 Defect Tracking Process Overview
As Amazon grew both its supplier base and volume, a key need was identified in the inbound process. Labor hours for problem solvers, the associates who dealt with defects from suppliers, were
increasing disproportionately with volume increases. This suggested that as Amazon had increased scale, there were now either more defects or more time-consuming defects entering the fulfillment centers.
The argument for defect tracking was logical from both the perspective of management and the end-user associates. With defect tracking, Amazon could charge suppliers for specific defects. These charges would eventually lead suppliers to improve their own processes in order to prevent the
chargebacks. This in turn, would decrease the amount of incoming defects from suppliers. This had two major benefits to Amazon: Amazon would have to spend less time/workers fixing these defects (leading to a lower cost per unit) and there would be fewer defects that would ultimately reach the customer.
Defects
Defect Defect
Introduction Rate Completion Rate
Supplier Behavior Defect
Changes Trackng
Supplier Charges +
Figure 8. Defect Tracking Process Overview
However, this process had several unintended consequences. First, using the defect tracking tool took additional time. For example, consider a product that came in without a barcode. Before the defect tracking tool was introduced, associates would use any available information (PO, item title, etc.) to identify the product and associate with a specific supplier. Then, the associate would print out the
corresponding barcode and affix it to the item before the item was received. With the new defect tracking process, not only did the prior steps needed to be completed, but also, all relevant information (PO, Item #, Shipping Identifier, Quantity, etc.) needed to be inputted. Furthermore, a defect type needed to be specified and a picture of the missing barcode needed to be taken. This led to increases in the amount of
Michael Joyce Page 24
time required to fix a defect, decreasing the defect completion rate. A time study performed at one sortable site noted that the time spent by associates to resolve defects increased by approximately 80% when the defect tracking system was implemented. In the model below, as the average time per defect increases, it decreases the defect completion rate. However, the more time spent per defect, the better the adherence to the defect tracking process.
Average Time per Defect Defect Introduction Rate Defe Completio Supplier Behavior Changes Supplier C harges + Adherance to Defect ct Tracking Process n Rate Defect + Tracking+
Figure 9. Increase in Time per Task
This increase in average time for the defect tracking process was described as the number one reason as to why the defect tracking process failed. In the re-introduction of the process, very little was done to reduce the time spent by associates. However, the adoption rate and sustainability of the process was drastically improved in the re-introduction of the process. The following sections will expand upon this system dynamic model in order to explain potential failure modes for the process.
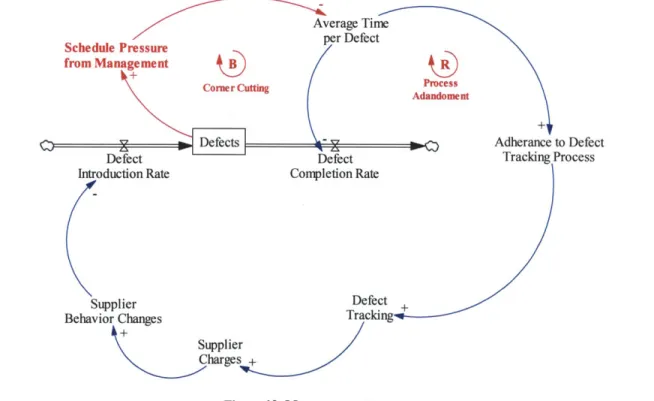
4.1.1 Failure Mode #1: Management Pressure
As the defect completion rate decreases, the stock of defects rises slowly. Managers may see this accumulation of defects and as a result put more pressure on problem solvers to finish the work faster. This may lead associates to decrease the time spent per defect, leading to lower adherence of the defect tracking process.
This causes two different types of loops to form. First, when defects rise, management applies schedule pressure so the average time per defect drops. This "corner cutting" leads to a faster rate of resolving defects, reducing the amount in the system creating a balancing loop. Management may notice this immediate decrease in defects and wrongly assume that putting additional pressure on employees works. Without an intervening force to tell associates that they are missing the defect tracking, associates believe that defect tracking is secondary to resolving the defects.
However, management pressure also creates a reinforcing loop known as "process abandonment". As defects rise, mangers increase the amount of pressure on employees. Employees then decrease the amount of time spent on each defect, leading to lower adherence of the defect tracking process. With lower defect tracking, fewer suppliers are charged and poor supplier behaviors are not changed (or worse reinforced), leading to even more defects.
Average Time Schedule Pressure
from Management
Corner Cutting Adoens
Defects Adherance to Defect
Defect Defect Tracking Process
Introduction Rate Completion Rate
Supplier Defect +
Behavior Changes Tracking
Supplier Charges +
Figure 10. Management Pressure
Michael Joyce Page 26
Although all the managers I spoke with insisted that they never put additional pressure on their problem solvers to finish work faster than was possible, many problem solvers argued the contrary. In some cases, there may have been a misinterpretation of management's actions. Regardless, many problem solvers believed that management wanted associates to resolve the defects as fast as possible, even if that meant temporarily or permanently abandoning the defect tracking process.
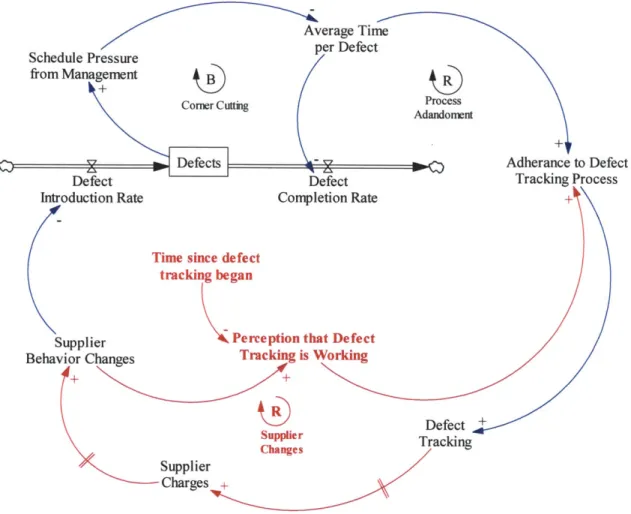
4.1.2 Failure Mode #2: Delays in Supplier Behavior Changes
In addition to changes in the defect completion rate, delays between when a defect is tracked to when the suppliers change their behavior can cause management to lose faith in the process. When a defect is tracked, it generally takes several weeks before a supplier is charged for the defect. Moreover, it often takes months and sometimes years before a supplier who is being charged decides to consciously make a change to their process in order to reduce the defects they are sending to Amazon. This is
extremely problematic as management often loses faith in the process before a supplier makes a change to its process. From the management perspective, the defect tracking system is taking additional resources but giving nothing in return. Because management and associates have no visibility into supplier charges or planned behavior changes, they may conclude that the process is broken and decide to stop using the new defect tracking tool.
In an ideal world, as the suppliers behavior changes, perception that the defect tracking is
working would also increase, leading to better adoption of the defect tracking process. This would lead to more defect tracking, supplier charges, and even more behavior changes from suppliers. This leads to a reinforcing loop that facilitates defect tracking. The delays complicate this though and can cause perception that the defect tracking process is not working, leading to abandonment of the process.
AeaeTime:
Schedule Pressure De
from Management GBR
Corner CuAd o n
Defects Adherance to Defect
Defect Defect Tracking Process
Introduction Rate Completion Rate +
Time since defect tracking began
Supplier Perception that Defect
Behavior Changes Tracking is Working
+Defect + Supplier Tracking Changes Supplier Charges +
Figure 11. Delays in Behavior Changes
Although not listed as the primary reason for not using the defect tracking process, a few associates and managers claimed that nothing they did seemed to have any impact. The brought up narrative cases of how they logged fifty or more defects from the same supplier in one shipment, only to see the next shipment have the same error. This destroyed confidence in the initiative and led many associates and managers to wonder why they should track the defects if nothing was going to change.
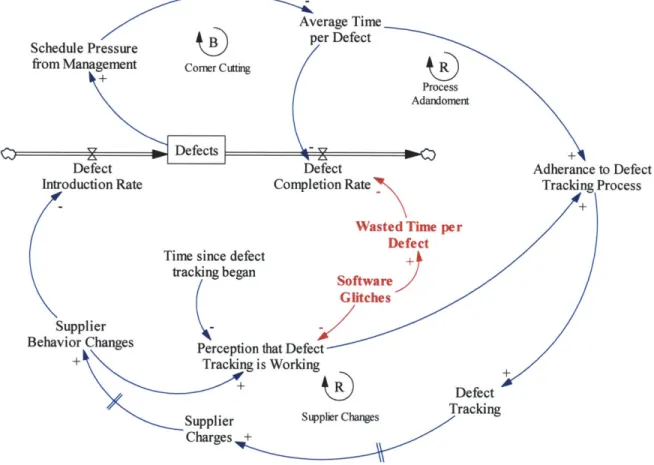
4.1.3 Failure Mode #3: Software Glitches
Glitches in the defect tracking software may lead to two outcomes that threaten failure of the defect tracking process. First, software glitches lead to a perception that the entire defect tracking initiative is not working. This leads to lower adherence to the new process, causing fewer defects to be
Michael Joyce Page 28
tracked. As a result, there are no chargebacks and suppliers do not adjust their behavior, leading to a higher defect introduction rate.
Additionally, software defects increase the amount of non-valued added time spent by associates. This lowers his or her ability to correct defects quickly, leading to an increase in the stock of defects. This exacerbates the pressure from management to complete tasks sooner and eventually leads to both less time spent on each defect and lower adherence to the defect tracking process.
Schedule Pressure
from Management Comer Cutting
Adandoment
Defect Introduction Rate
Time since defect tracking began
Defect Completion Rate
Wasted Time per Defect Software Glitches + Defect Supplier Changes
Figure 12. Impact of Software Glitches on Process
Software problems were commonly cited as a major issue in the introduction of the defect tracking process. In 2012, the software failed to correctly capture the defect in the vast majority of cases. Some of these software issues were easily apparent as red error messages came across the screen.
However, in other cases, the software glitches were near impossible to identify for associates. While some problem solvers saw no error messages, bugs in the back end of the system cause the defects not to be captured.
Michael Joyce Page 29
4.1.4 Failure Mode #4: Hardware Problems
One of the initial requirements to implementing the defect tracking process was the purchase of a network camera. The camera was required for taking pictures which would be used in the event of a dispute with vendors about the defect. The supplier management team agreed to implement vendor chargebacks, but only with pictures to help prove. The camera required was expensive and came directly out of the budget of fulfillment centers. This alone led many sites to purchase hardware below the optimal amount for budgetary reasons. Consequently, without enough cameras, there was a decrease in the adherence to the tracking process and fewer defects tracked.
Additionally, the specified camera frequently broke down leading to wasted time. This down time limited the defect completion rate and compounded the management pressure issue leading to further decreases in defect tracking.
Average Time
Schedule Pressure Process
from Management Corner Cuting Adandoent
Hardware Requirement
Hardware
Defects Spendin +
Defect Defect - Adherance to Defect
Introduction Rate Completion Rate + Tracki Process
.Hardware+
Failures
Wasted Time per
Defect +
Time since defect +
tracking began Software
Glitches
Supplier
-Behavior Changes Perception that Defect
+ Tracking is Working
Defect +
Tracking Supplier Supplier Changes
Charges +
Figure 13. Impact of Hardware Problems
Many users complained about the hardware and did not understand why a different camera option could not be used. In talking with security personnel, some suggested that alternate cameras like
webcams and digital cameras were more likely to be stolen. Additionally, these cameras could be easily
Michael
Joyce
Page 30configured to send pictures or video over the internet and were not preferred. Despite this stance from some security officers, the majority of sites had webcams, digital cameras, or both.
4.1.5 Failure Mode #5: Misaligned Incentive Structures
At Amazon, the vendor chargeback team is located in corporate but is organizationally separate from both the fulfillment centers and the supplier management team. This organization has led to a misalignment of the incentive structure which is described in detail below.
Several of the managers at the fulfillment centers questioned whether his or her site would see any direct compensation for defect tracking. Their argument was that defect tracking takes additional time and resources. These were not planned for in the original budget and therefore will put management
at risk of not meeting financial targets. Furthermore, as defect tracking can lead directly to vendor chargebacks, management at some sites argued that a certain percent of those chargebacks should return to the fulfillment center.
This argument, while in some sense valid, does not take into account the complexities and inherent differences between fulfillment centers. Because sites often handled different products, sites were likely to experience a very different makeup of defects. As a result, vendor chargebacks were
different for various sites so simply using a percent would lead to major differences in compensation. For example, consider a site that receives a pallet of expired chocolate compared to a site that receives a
single book with a missing barcode. In each case, there is only one defect and capturing it would take approximately the same amount of time, however the chargeback to the vendor for the pallet of expired chocolate would be substantially higher than the chargeback for the book missing a barcode. Moreover,
since sites do not directly pay for the products entering their facilities, it may not make sense to compensate based on the defects associated with these products.
Despite these concerns, management's argument highlights a misaligned incentive structure. Sites that do not encourage defect tracking will be able to "resolve" defects faster, appearing to be more productive. However, this is a local optimum as if every site stopped defect tracking, the defects from suppliers would not only continue but also likely increase. From a network perspective, if all sites were to track defects, the benefits would far outweigh loses. Reimbursement through vendor chargebacks would more than compensate for the increase in labor and over the long term, suppliers would change
their behavior leading to fewer defects. From a site-level perspective though, there is an incentive to skip defect tracking in order to stick to budget and appear more productive.
In addition to the misaligned incentive structure at the fulfillment centers, there was also a misaligned incentive structure for supplier managers. Supplier managers at Amazon were responsible for forging a relationship with vendors to benefit both parties. This involved agreeing on prices, payment terms, and deliveries. Newly introduced vendor chargebacks had the potential to weaken or even
dismantle relationships. While Amazon reserved the right to charge for aberrations to the contract, these new charges threatened certain relationships. Vendor chargebacks, although automated, generally
increased the workload on the individuals as they needed to both explain and work with suppliers whenever chargebacks were introduced. While supplier defects put an incredible strain on fulfillment centers, since there was very limited data about the most common defects, many supplier managers were
shielded from this issue.
Therefore, it was not in the best individual interests of the managers to encourage vendor
chargebacks through defect tracking. Again, while defect tracking and vendor chargebacks was expected to be beneficial for Amazon in the long-run, the different shareholders had short-term incentives that directly conflicted with defect tracking.
4.1.6 Failure Mode #6: Conflict with other Initiatives
In addition to the misaligned incentive structure, at approximately the same time as the defect tracking initiative was implemented, an initiative to standardize the work across Amazon was introduced.
This initiative attempted to define the specific tasks of each grouping of associate (i.e. receivers, problem solvers, packers, etc.). As part of this initiative, it was determined that the responsibility of the receivers was to receive product and problem solvers were simply intended to solve issues for the receivers.
While simplistic and easy to remember, this interpretation now conflicted with the defect tracking process. As mentioned previously, the defect tracking process involved two types of associates
-receivers and problem solvers. In the defect tracking process, when a receiver came across a defect, he or she was supposed to input available information into the system and then put the item in a scanned container. The problem solver would then pick up the container and retrieve all of the information provided by the receiver. The problem solver would then use this information to resolve the defect and complete the tracking.
Michael Joyce Page 32
With the new interpretation of standard work for receivers, inputting defect information for problem solvers was no longer needed. When receivers encountered a defective item, their job was simply to pass on the item to the problem solvers. Inputting information about the product was not considered to be receiving. Consequently, many sites determined that defect tracking and standard work were mutually exclusive initiatives. As the standard work initiative became more pervasive, a number of sites abandoned the defect tracking process.
4.1.7 Failure Mode #7: Misinformation
In addition to the failure modes discussed, interviews suggested that there was one other reason that many sites decided to stop using the defect tracking software - misinformation. While some potential users were unaware of the defect tracking tool's existence, a much larger number knew about it but mentioned that it was not effective for a variety of incorrect reasons.
In particular, there were a variety of opinions about vendor chargebacks. Some interviewees claimed that the defect tracking software never charged suppliers for defects and as such it was a waste of time for anyone to use it. However, most interviewees believed that it did chargeback suppliers but at an almost insignificant amount. A number of people suggested that the labor cost for inputting information
in the defect tracking system outweighed the amount returned by vendors. Estimates for the amount of vendor chargebacks generally ranged from 1/1 0 0 0 0th to 1/2 0th of the actual amount. One manger cited the
low chargebacks as the primary reason for instructing his employees to stop using the defect tracking tool. Despite discussing the matter with more than a hundred people at various levels in the fulfillment centers, not one was able to correctly describe vendor chargebacks. This difference between reality and perception of vendor chargebacks ultimately contributed to sites not using the defect tracking software.
4.2
Summary of Failure Modes
The seven potential failure modes (management pressure, delays in supplier behavior changes, software glitches, hardware problems, misaligned incentives, conflict with other initiatives, and misinformation) are not intended to represent a comprehensive list of reasons as to why the process ceased to be used. However, this analysis supports the argument that they are the primary reasons for failure. In addition to the discussed factors, there were a number of other factors considered including employee turnover, process ignorance, and software ease of use. A full examination of the organization,
defect tracking process, and software were combined with qualitative interviews to determine these potential failure modes. These seven failure modes do provide areas for potential process improvement which is examined in the next section.
5
Solutions
In this section, various methods for attacking the seven failure modes discussed in the previous section will be presented.
5.1
Methodology/Implementation Approach
Over a period of six months, I used my analysis to pilot and deploy a new process across the Amazon North American network. My approach was simply to attack the various failure modes discussed and work to implement process changes that eliminated or weakened the potential failure modes. My responses to failure modes were not implemented in order, but are organized to provide
symmetry to the failure modes presented in the prior section. During the pilot phase, the majority of my time was spent in various Amazon fulfillment centers where I was able to implement my changes. I evaluated the effectiveness of these changes by gathering data about how the process was being followed over the next few weeks and made adjustment to the process if necessary.
5.1.1 Attacking Failure Mode #1: Management Pressure
One of the first things evident in the analysis of the process was that a process would fail if area managers were not engaged and committed to the process. This is most evident in the modeling of failure mode #1 - management pressure. I attacked this problem in two ways - education and focused defect tracking. First, one of the reasons management began to put pressure on associates was that their internal
expectations about the number of defects was still tied to the old process with no defect tracking. To help remedy this issue, I worked with managers at the pilot sites to ensure that they understood that the defect tracking would result in a slower rate for problem solvers. Using the time study analysis, I suggested that
they allot almost double the amount of time for defects that were being tracked.
Michael Joyce Page 34
While this may have solved the part of the issue, the education alone would have led to other problems. Most sites simply did not have the budget for twice the amount of problem solving labor and would have been extremely resistant if I had only mentioned this. However, to counter for the fact that the defect tracking took so long, I asked sites to only track six specific defects. These defects were determined based on two factors: cost to Amazon and frequency. The costs were estimated based on the time it took to resolve the defect (time studies enumerated this) as well as any other associated costs. For example, the cost of expired products comprised the cost of tracking and resolving the defect, the disposal of the defective product, and the cost to reorder and receive the item. Relative frequency was estimated based on observation at various fulfillment centers, data from the prior roll-out of the tracking process, and interviews with warehouse workers.
Since only six defects were being tracked, the overall defect completion rate was less impacted and more importantly, the perception that this change would have on the problem solve hours was severely reduced. Limiting the impact on the defect completion rate combined with the education for management about the impact of defect tracking helped to mitigate schedule pressure from management.
Education about time of process Average Time t o sSchedulePressure eper Defect Pocass
Expected # of Defects from Management Comer Cutting Adandoment Hardware
+ Requirement
Hardware
Defects Spendink_ +
De Dec e- Adherance to Defect
Defect Defect
rciPoes
Introduction Rate # of Defects Co letion Rate +Trackin Process
Tracked Hardware +
Wasted Time per Failures Defect
Time since defect
tracking began Software
Glitches
Supplier
-Behavior Changes Perception that Defect
+ Tracking is Working
+
Defect + Tracking Charges +
Figure 14. Attacking Management Pressure
5.1.2 Attacking Failure Mode #2: Delays in Supplier Behavior Changes
As illustrated in failure mode #2, actually changing the behavior of suppliers took a considerable amount of time. This was due to the time lags inherent in the system. First, there was a delay between when the supplier shipped the order and when the defect was tracked by Amazon. Furthermore, there are delays between when a defect is tracked and when a supplier is actually charged for that defect and even longer delays between when suppliers were charged and when their behavior changed to minimize the frequency of that defect.
However, because of these time delays, there often was a perception that the defect tracking system was not working. To minimize the impact of this and to engage associates, I developed site chargeback metrics that showed the number of defects tracked and more importantly the amount of vendor
chargebacks attributable to a specific site. This along with education about how suppliers were often slow to change in spite of real chargebacks helped to minimize concerns that the defect tracking systems was not working. This led to a reinforcing loop as sites worked to improve their metrics. Despite the delay between defect tracking and supplier charges, the metrics significantly increased the perception of the tool as both associates and managers could see how much they charged vendors.
Moreover, the site specific metrics now allowed management to identify defect trends. It was possible to see which vendors contributed the most defects, which defects occurred most frequently, and which associates were tracking the most defects. This gave management both more ability to effectively manage the defect tracking process and more confidence that the system was working. This led to increased adherence to the defect tracking process throughout sites.
Michael
Joyce
Page 36Education about time of process Expected # of Defects # of Defects Ietion R Timie Fect t Process Hrwr AadretRequirement Hardware spendiAdherance to Defect
ate Hardware Tracking Process
Hardwre 1+
\
Irackcu
Wasted Time per Defect
Time since defect D
tracking began Software
Glitches
Site Chargeback Defect
Supplier Changes Metrics Tracking
Supplier +
Charges
Figure 15. Attacking Delays in Supplier Behavior Changes
An example of the site chargeback metrics is shown in the figure below. Using drop down menus, both managers and associates were able to visually see site-specific trends on usage, picture taking, and chargeback dollars. A detail page included all defects filed with associate logins so managers could provide coaching to not filing defects. This information was available to most people for the first time
and provided an incentive and feedback mechanism for continued compliance.
The Excel-based reporting tool also highlighted areas for improvement. For example, defects that were filed without pictures but required a picture for vendor chargebacks were highlighted in red so management could identify the missed opportunities. By providing all North American sites in one location, managers of the different sites were able to compare their progress with similar fulfillment centers.
Michael
Joyce
Page 371
2
Defects by Week
$ Chargebacks
3
4 DefetType ALL
5 skte ALL__
7 Year 20I101 L eet
1ini0Defects -S$Chargebacks
tu l
Aa/fctursn wVeek to-date Defects -Minimum Target
1 Prior W eekDefects N
13 Prior Five Week Avg
14
0
"S
%V "\
Figure 16. Site Chargeback Metrics
5.1.3 Attacking Failure Mode #3: Software Glitches
For the majority of 2010 and 2011, the defect tracking software was characterized by a number of software glitches. By early 2012, the defect tracking tool was no longer functional as almost every defect submitted resulted in an error. With a significant push, the software team and I diagnosed, tested, and fixed the most severe software glitches in the system. Despite this, because of the relative age of the system, minor software glitches continued to be uncovered month after month. Even after fixing certain issues, it appeared that these bugs had an instant degradation in the confidence of problem solvers who used the software.
Instead of focusing purely on minimizing these software bugs, I worked with the software team to implement a number of software improvements. These enhancements were able to significantly reduce the amount of wasted time spent on defect tracking. One such example included reducing the amount of information required to submit a defect. Instead of requiring associates to input all information including shipment id, purchase order number, quantity, and amazon standard identification number, the system was modified to eliminate information that could be found elsewhere. For example, if the purchase order was linked to a specific shipment id, users would no longer need to input this information as the shipment id could be identified using the purchase order.
In addition to small time savings for associates, the gradual introduction of software improvements built significant confidence that the defect tracking systems was useful. As software improvements began to take longer, a software wiki page was introduced to highlight which
enhancements had already been made to the system and when additional improvements would go into
Michael Joyce Page 38
![Figure 2. Amazon Revenue Trend [4,5,6]](https://thumb-eu.123doks.com/thumbv2/123doknet/14681274.559311/13.918.196.706.628.926/figure-amazon-revenue-trend.webp)