HAL Id: hal-00301982
https://hal.archives-ouvertes.fr/hal-00301982
Submitted on 17 Jul 2006HAL is a multi-disciplinary open access
archive for the deposit and dissemination of sci-entific research documents, whether they are pub-lished or not. The documents may come from teaching and research institutions in France or abroad, or from public or private research centers.
L’archive ouverte pluridisciplinaire HAL, est destinée au dépôt et à la diffusion de documents scientifiques de niveau recherche, publiés ou non, émanant des établissements d’enseignement et de recherche français ou étrangers, des laboratoires publics ou privés.
Direct measurement of particle formation and growth
from the oxidation of biogenic emissions
T. M. Vanreken, J. P. Greenberg, P. C. Harley, A. B. Guenther, J. N. Smith
To cite this version:
T. M. Vanreken, J. P. Greenberg, P. C. Harley, A. B. Guenther, J. N. Smith. Direct measurement of particle formation and growth from the oxidation of biogenic emissions. Atmospheric Chemistry and Physics Discussions, European Geosciences Union, 2006, 6 (4), pp.6587-6612. �hal-00301982�
ACPD
6, 6587–6612, 2006 Formation and growth of biogenic aerosols T. M. VanReken et al. Title Page Abstract Introduction Conclusions References Tables Figures J I J I Back CloseFull Screen / Esc
Printer-friendly Version Interactive Discussion
EGU Atmos. Chem. Phys. Discuss., 6, 6587–6612, 2006
www.atmos-chem-phys-discuss.net/6/6587/2006/ © Author(s) 2006. This work is licensed
under a Creative Commons License.
Atmospheric Chemistry and Physics Discussions
Direct measurement of particle formation
and growth from the oxidation of biogenic
emissions
T. M. VanReken1, J. P. Greenberg2, P. C. Harley2, A. B. Guenther2, and J. N. Smith2
1
Advanced Study Program, National Center for Atmospheric Research, Boulder, CO, USA
2
Atmospheric Chemistry Division, National Center for Atmospheric Research, Boulder, CO, USA
Received: 23 May 2006 – Accepted: 27 May 2006 – Published: 17 July 2006 Correspondence to: T. M. VanReken ([email protected])
ACPD
6, 6587–6612, 2006 Formation and growth of biogenic aerosols T. M. VanReken et al. Title Page Abstract Introduction Conclusions References Tables Figures J I J I Back CloseFull Screen / Esc
Printer-friendly Version Interactive Discussion
EGU
Abstract
A new facility has been developed to investigate the formation of new particles from the oxidation of volatile organic compounds emitted from vegetation. The facility consists of a biogenic emissions enclosure, an aerosol growth chamber, and the associated instrumentation. Using the facility, new particle formation events have been induced
5
through the reaction of ozone with three different precursor gas mixtures: an α-pinene test mixture and the emissions of Holm oak (Quercus ilex ) and loblolly pine (Pinus taeda). The results demonstrate the variability between species in their potential to form new aerosol products. The emissions of Q. ilex resulted in fewer particles than did α-pinene, although the concentration of monoterpenes was roughly equal in both
10
experiments before the addition of ozone. Conversely, the oxidation of P. taeda emis-sions led to the formation of more particles than either of the other two gas mixtures, despite a lower initial terpenoid concentration. These variations can be attributed to differences in the speciation of the vegetative emissions with respect to the α-pinene mixture and to each other. Specifically, the presence of β-pinene and other
slower-15
reacting monoterpenes inhibited particle formation in the Q. ilex experiment, while the presence of sesquiterpenes, including β-caryophyllene, in the emissions of P. taeda were the likely cause of the more intense particle formation events observed during that experiment.
1 Introduction
20
Biogenic secondary organic aerosols (SOA) are thought to be a significant contributor to total aerosol mass globally, and are likely to be the dominant source of particulate matter in some remote continental areas (Andreae and Crutzen, 1997; Griffin et al., 1999a). As such, they are likely to have significant impacts on the Earth’s radiative balance, both on global and regional scales. Like other aerosols, SOA can scatter or
25
Ad-ACPD
6, 6587–6612, 2006 Formation and growth of biogenic aerosols T. M. VanReken et al. Title Page Abstract Introduction Conclusions References Tables Figures J I J I Back CloseFull Screen / Esc
Printer-friendly Version Interactive Discussion
EGU ditionally, biogenic SOA can modify cloud properties through its potential contribution
to the population of cloud condensation nuclei (CCN). These modifications to cloud properties can in various ways also affect the fate of incoming solar radiation and are known as the “indirect aerosol effects”. In the most recent assessment by the Intergov-ernmental Panel on Climate Change (2001), these aerosol effects were classified as
5
having only a “Very Low” level of scientific understanding. Improving our understanding of the role of aerosols in the climate system requires first a greater knowledge of the mechanisms leading to aerosol formation in the atmosphere. Despite extensive ongo-ing research, there is still much to learn about the processes leadongo-ing to the formation of biogenic SOA (Kanakidou et al., 2004). Only recently are models being developed that
10
attempt to predict the formation and growth of biogenic SOA under ambient conditions (e.g., Boy et al., 2006). The robustness of such models has not yet been demonstrated, nor are they yet able to adequately forecast the physical and chemical properties of the resulting aerosol. Such a predictive capability is necessary in order to effectively incor-porate biogenic SOA into the larger-scale models used to study regional air quality and
15
global climate change.
Secondary organic aerosol is formed when volatile organic compounds (VOCs), ei-ther biogenic or anthropogenic in origin, are oxidized in the atmosphere to form less volatile products. Some fraction of the oxidized material partitions to the particle phase, either by condensing onto the pre-existing aerosol or by forming new particles.
Sys-20
tematic field observations have proven valuable in establishing what classes of biogenic compounds are most likely to be precursors of SOA and under what conditions parti-cle formation events are likely to occur (Kulmala et al., 2004, and references therein). Notably, however, field observations have also highlighted gaps in our understanding of biogenic emissions and their subsequent fate. For example, researchers studying a
25
forested site in the Sierra Nevada mountains in California have concluded that an addi-tional, undetermined, class of reactive biogenic VOCs must exist in the forest canopy, based on unexplained loss of ozone (Goldstein et al., 2004) and the presence of excess oxidized VOCs (Holzinger et al., 2005).
ACPD
6, 6587–6612, 2006 Formation and growth of biogenic aerosols T. M. VanReken et al. Title Page Abstract Introduction Conclusions References Tables Figures J I J I Back CloseFull Screen / Esc
Printer-friendly Version Interactive Discussion
EGU Laboratory studies of SOA formation from known biogenic precursors are
comple-mentary to field observations. For this reason the oxidation of biogenic VOCs has been studied in aerosol growth chambers for many years. Yu et al. (1999) characterized the gaseous and particulate products of monoterpene ozonolysis, and more recent stud-ies have determined the potential for this class of biogenic compounds to oxidize to
5
condensable products under a wide variety of conditions (e.g., Bonn and Moortgat, 2002). Other laboratory studies have recently investigated the aerosol-forming poten-tial of other biogenic compounds, including isoprene and the sesquiterpenes. Griffin et al. (1999a, b) found that sesquiterpene oxidation resulted in significantly higher aerosol yields (17–67%) than did monoterpenes (2–23%), making sesquiterpenes a significant
10
contributor to biogenic SOA despite very low atmospheric concentrations. Claeys et al. (2004) and Kroll et al. (2005) have recently demonstrated that biogenic SOA also forms via the oxidation of isoprene; yields in these experiments were quite low (∼3%), but isoprene accounts for ∼50% of the global burden of non-methane hydrocarbons, making it a significant contributor even at such low yields.
15
These chamber studies generally focus on characterizing the dependence of aerosol formation on various process variables, and therefore are designed to isolate those variables to the degree possible. This usually results in a considerable simplification of the system as compared to the ambient atmosphere. Usually, only a single organic compound is used in any given experiment, and only a single oxidizing compound.
20
Scavenging compounds are frequently used to consume any competing oxidants that might be formed during the experiments. These procedures are necessary for experi-ments whose goal is to characterize SOA formation pathways. However, because the mechanisms for aerosol formation from biogenic VOCs are complex and highly non-linear, it is uncertain to what degree the dependencies observed in chamber studies
25
can be extrapolated to conditions more closely resembling the complexity of the ambi-ent atmosphere. Studies exploring this complexity are also important for three reasons: 1) they serve as verification that the results of more idealized studies are comparable to what is observed under more realistic conditions; 2) they provide more immediate, “big
ACPD
6, 6587–6612, 2006 Formation and growth of biogenic aerosols T. M. VanReken et al. Title Page Abstract Introduction Conclusions References Tables Figures J I J I Back CloseFull Screen / Esc
Printer-friendly Version Interactive Discussion
EGU picture” answers to the needs of the climate modeling community, in this case by
char-acterizing the aerosol production capability of different plant species without requiring detailed knowledge of the emitted compounds; and 3) they are potentially very useful for finding and characterizing the unidentified compounds required by the analyses of Goldstein et al. (2004).
5
Two recent studies have addressed these types of questions by using direct biogenic emissions as the precursor for aerosol formation rather than a single compound. Mc-Figgans et al. (2004) formed new particles by exposing the emissions of Laminaria macroalgae to elevated ozone concentrations. These particles were very similar in morphology and composition to particles generated via the oxidation of diiodomethane
10
(CH2I2) and molecular iodine (I2). Joutsensaari et al. (2005) observed a new particle formation event when specimens of white cabbage (Brassica oleracea) were placed in an environmental chamber and exposed to ozone. They found particle formation rates similar to those observed in field studies, but that their observed aerosol growth rate was much greater. In the latter study, VOC concentrations were increased by exposing
15
the plants to methyl jasmonate, a signaling compound that induces terpenoid emis-sions. The current study takes a similar approach to that of Joutsensaari et al. (2005), but without any artificial enhancement of VOC emissions. A facility has been developed to explore the potential of emissions from different plant species to form SOA under at-mospherically relevant conditions. Using this facility, new particles were formed via the
20
ozonolysis of three gas mixtures: a dilute mixture of α-pinene in air, emissions from a Holm oak (Quercus ilex ) specimen, and emissions from a loblolly pine (Pinus taeda) specimen.
ACPD
6, 6587–6612, 2006 Formation and growth of biogenic aerosols T. M. VanReken et al. Title Page Abstract Introduction Conclusions References Tables Figures J I J I Back CloseFull Screen / Esc
Printer-friendly Version Interactive Discussion
EGU
2 Experimental system
2.1 Facility description
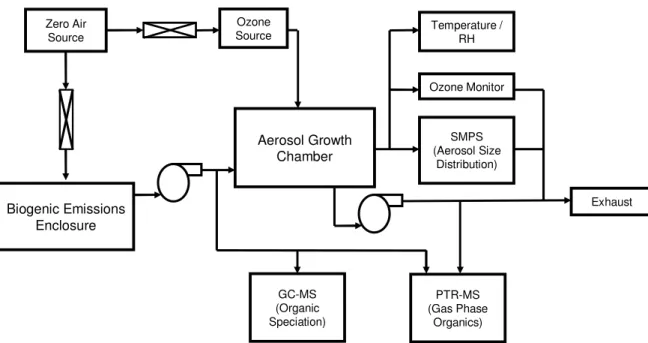
The new facility assembled for this study (Fig. 1) consists primarily of an aerosol growth chamber and a biogenic emissions enclosure. The aerosol growth chamber is a ∼1.5 m3bag made of 0.00200FEP Teflon film suspended in a steel enclosure. The
5
enclosure protects the bag and prevents light exposure. Reactants enter the chamber and samples are withdrawn through two manifolds at opposite sides of the chamber. The manifolds each include four access ports, one of which has been enlarged for mounting a temperature and relative humidity probe (Vaisala Model HMP50). The rest are drilled to allow standard 1400tubing to be press-fit into the port.
10
The biogenic emissions enclosure can be customized to meet the needs of individual experiments. For this study, an enclosure was chosen that has a volume of 10 liters and is designed to collect the emissions from a living plant specimen roughly the size of a small tree branch. It consists of a cylinder of 0.00400Teflon sheeting, sealed at one end to a1400Teflon plate. This plate supports the enclosure and serves as a manifold through
15
which air passes into and out of the enclosure. The opposite end of the enclosure is wrapped around the base of the branch as tightly as is practical to minimize leaks without damaging the plant. A 1000 W quartz-halogen high intensity discharge lamp suspended over the enclosure provided ∼700 µmol m−2 s−1 photosynthetically active radiation during a 12–13 h photoperiod, ensuring stable photosynthetic activity and
20
VOC emissions. The proximity of the lamp to the biogenic emissions enclosure is estimated to increase the temperature inside the enclosure by ∼5 K relative to the aerosol growth chamber and the rest of the laboratory.
In contrast with most chamber studies of aerosol formation and growth, a constant flow through the system was maintained during these experiments. Both the aerosol
25
growth chamber and the biogenic emissions enclosure were supplied with air from a Pure Air Generator (Aadco Model 737). This generator was used to keep the system at positive pressure so that any leaks were from the system to the surrounding room,
ACPD
6, 6587–6612, 2006 Formation and growth of biogenic aerosols T. M. VanReken et al. Title Page Abstract Introduction Conclusions References Tables Figures J I J I Back CloseFull Screen / Esc
Printer-friendly Version Interactive Discussion
EGU rather than vice versa. As indicated in Fig. 1, the aerosol growth chamber is fed via
two lines. The first arrives to the chamber directly from the pure air generator; an ultraviolet ozonizer was present in this line whose intensity could be adjusted to control the concentration of ozone entering the aerosol growth chamber. The flow rate of this stream was controlled using a rotometer and checked prior to each experiment using
5
a bubble flow meter (Gilibrator, Gilian Instrument Corp.). The second stream entering the aerosol growth chamber was supplied from the biogenic emissions enclosure. This flow was controlled with a needle valve and checked with a bubble flow meter prior to each experiment. A diaphragm pump was required to transfer air from the biogenic enclosure to the growth chamber; tests with an empty branch enclosure demonstrated
10
that the pump generated few particles (<2 cm−3), and those generated were at the high end of the measured size range (>200 nm).
2.2 Sampling instrumentation
The primary goal of these experiments was to determine whether new particle forma-tion can occur readily from the oxidaforma-tion of biogenic emissions. This required
mon-15
itoring reactant concentrations entering and exiting the aerosol growth chamber and the aerosol size distribution leaving the chamber. Ozone concentrations were mea-sured using a 2B Technologies Model 202 ozone monitor, which had a time resolution of 5 s. Biogenic VOC concentrations were monitored with a proton-transfer-reaction mass spectrometer (PTR-MS) constructed in house at NCAR (Hanson et al., 2002),
20
based on a technique first developed by Lindinger et al. (1998). The proton transfer reaction is a very soft ionization technique, so that the fragmentation of large organic molecules is minimized. This gives the PTR-MS increased sensitivity to VOCs such as monoterpenes and sesquiterpenes, but makes it difficult to differentiate samples of the same molecular mass. Thus, while the instrument can discriminate between
monoter-25
penes and sesquiterpenes, α-pinene and β-pinene cannot be distinguished. During these experiments, the PTR-MS was operated exclusively in selected ion mode. With a time resolution of 10 s, ions were monitored with mass-to-charge ratios (m/z)
con-ACPD
6, 6587–6612, 2006 Formation and growth of biogenic aerosols T. M. VanReken et al. Title Page Abstract Introduction Conclusions References Tables Figures J I J I Back CloseFull Screen / Esc
Printer-friendly Version Interactive Discussion
EGU sistent with monoterpenes (m/z=81, 137) and sesquiterpenes (m/z=205). Ions for
potential reaction products from the ozonolysis of these species were not monitored in this study. Data from both the ozone monitor and the PTR-MS were averaged over two minutes to reduce the statistical variability. With both instruments, switching between the input and output sampling streams was done manually, and output concentrations
5
were monitored most of the time. When sampling the output flow from the chamber, the sample was taken downstream of the purge pump.
In order to obtain more detailed speciation of the VOCs emitted by the plant spec-imens, samples of the gas mixture leaving the biogenic emissions chamber were an-alyzed using gas chromatography-mass spectrometry (GC-MS). Using a small
flow-10
controlled pump (Pocket Pump 210, SKC, Eighty-Four, PA) samples of approximately 6 liters were collected onto solid adsorbent cartridges containing Tenax GR (Supelco, Bellefonte, PA). Cartridges were thermally desorbed and analyzed by GC-MS using the methodology previously described by Greenberg et al. (1999).
Aerosol size distributions over a diameter range of 10–200 nm were measured
ev-15
ery four minutes using a scanning mobility particle sizer (SMPS), consisting of a long-column differential mobility analyzer (DMA) in series with a condensation particle counter (CPC, TSI Model 3020). The polydisperse and monodisperse aerosol flows in the DMA were maintained at 1.1 lpm, and the sheath and excess flows were kept at 10 lpm with a recirculating blower. The CPC required 0.3 lpm of the monodisperse flow;
20
the remaining 0.8 lpm was discarded. 2.3 Wall loss analysis
An important factor to consider in any chamber study is the effect of losses to the walls on the VOC concentrations, and, more importantly here, on the aerosol size distribu-tion. To characterize the wall losses for aerosols in the new aerosol growth chamber,
25
an experiment was performed during which a stable, polydisperse ammonium sulfate aerosol was fed to the chamber and the particle size distribution exiting the chamber was monitored continuously for several hours (using the SMPS system described in
ACPD
6, 6587–6612, 2006 Formation and growth of biogenic aerosols T. M. VanReken et al. Title Page Abstract Introduction Conclusions References Tables Figures J I J I Back CloseFull Screen / Esc
Printer-friendly Version Interactive Discussion
EGU Sect. 2.2). The flow conditions were identical to the particle formation experiments.
Af-ter ∼4 h the particle size distribution had stabilized, corresponding to the approximate residence time in the growth chamber. The average size distributions for the aerosols entering and exiting the growth chamber at equilibrium are presented in Fig. 2a.
These data were used to obtain a size-dependent wall loss coefficient, β(dp), defined
5
by Fuchs (1964) as d n(dp, t)
d t = −β · n(dp, t) (1)
where n(dp, t) is the particle size distribution function in the chamber at time t. To obtain β(dp) from the data obtained in the wall loss experiment, the aerosol cham-ber was modeled as a continuous stirred-tank reactor (Levenspiel, 1972). Under this
10 assumption, β(dp)= Q V · n0(dp) n(dp) ! (2)
where Q is the flow rate into the aerosol growth chamber, V is the volume of the cham-ber, and n0(dp) is the particle size distribution function entering the chamber. The measured values of β(dp) from this analysis are presented in Fig. 2b, and are in good
15
agreement with the theory developed by Crump and Seinfeld (1981). They were used to correct the size distributions measured during the biogenic aerosol experiments. 2.4 Experimental design
As was noted above, the facility used in this study operates with air passing continu-ously through the system. In preparation for each experiment, clean, particle-free air
20
was flushed through the aerosol growth chamber for several hours, until there were no particles observed in air exiting the chamber. At that time the biogenic VOCs were added by passing air from the biogenic emissions enclosure to the aerosol growth chamber at a rate of 1.3 lpm. A second flow of particle-free “zero” air continued to be
ACPD
6, 6587–6612, 2006 Formation and growth of biogenic aerosols T. M. VanReken et al. Title Page Abstract Introduction Conclusions References Tables Figures J I J I Back CloseFull Screen / Esc
Printer-friendly Version Interactive Discussion
EGU supplied to the growth chamber at a rate of 5.5 lpm. These flow rates correspond to a
residence time inside the aerosol growth chamber of approximately four hours. Simul-taneously, sample flows totaling 5.5 lpm were removed from the chamber. This total includes 1.1 lpm required by the SMPS system, 0.4 lpm required by the ozone moni-tor, and a 4.0 lpm purge flow vented to the building exhaust system. The purge flow
5
was controlled using a critical orifice upstream of a vacuum pump, and was included in the system primarily to keep the residence time of the chamber in the desired range. As was noted above, the chamber was intentionally over-pressured, so that any leaks would be from the chamber into the laboratory rather than in the opposite direction.
When the VOC concentration in the growth chamber reached ∼80% of its input
con-10
centration, the ozone addition was initiated by turning on the ultraviolet ozonizer in line with the 5.5 lpm input flow. After a brief warm-up period, the ozonizer consistently fed ozone to the aerosol chamber at a concentration of 50 ppb during each experi-ment (this concentration, and all other reported input concentrations, take into account the extra dilution caused by mixing the two input flows). Neither the temperature nor
15
the relative humidity was controlled actively during this study. The laboratory in which the experiments were conducted was temperature-controlled, thereby maintaining the temperature in the aerosol growth chamber at ∼298 K during the day; the temperature decreased by ∼1.5 K each night. The “zero” air produced by the pure air generator was quite dry, but the humidity in the aerosol growth chamber fluctuated by several percent
20
due to the plants’ transpiration cycles.
Three experiments were performed for this study, one using an α-pinene gas mix-ture as the VOC source, one using a Holm oak specimen (Q. ilex ), and one using a loblolly pine specimen (P. taeda). The experiment with α-pinene was included primarily to provide a baseline for comparison with the other studies, and to confirm that particle
25
formation would be observed under conditions where events have occurred in earlier studies (e.g., by VanReken et al., 2005). For this experiment only, the biogenic emis-sions enclosure was replaced with a dilution system that mixed an 840 ppb α-pinene calibration standard with zero air to obtain an α-pinene concentration of 6 ppb entering
ACPD
6, 6587–6612, 2006 Formation and growth of biogenic aerosols T. M. VanReken et al. Title Page Abstract Introduction Conclusions References Tables Figures J I J I Back CloseFull Screen / Esc
Printer-friendly Version Interactive Discussion
EGU the aerosol growth chamber. Except for replacing the biogenic emissions enclosure,
this experiment was performed using the same methodology as the two experiments using plant specimens. However, it was not possible to control the magnitude of in-coming VOC concentrations as closely during the plant experiments, or to keep those concentrations constant over time.
5
The first plant specimen examined in the study was the evergreen oak, Q. ilex. This species was chosen because it is a major forest component in Spain, Portugal and other Mediterranean countries and because it has very high rates of monoterpene emission that are quite sensitive to the level of ambient radiation (Staudt and Seufert, 1995). The emitted monoterpenes from Q. ilex are predominantly α-pinene, β-pinene,
10
sabinene, myrcene and limonene with minor contributions from α-thujene, camphene, γ-terpinene, p-cymene, β-ocimene and linalool. There is considerable intraspecific variability (Staudt et al., 2001).
The emissions source for the second biogenic experiment was a loblolly pine sapling (P. taeda). This species was chosen because of its prevalence in the southeastern
15
United States and because it is known to have substantial emissions of sesquiterpenes as well as monoterpenes (Stroud et al., 2005). The emission rates of monoterpenes from P. taeda are lower than from Q. ilex (Karl et al., 2005). Less is known about the light dependence of VOC emissions from P. taeda compared with Q. ilex. While its emissions of monoterpenes are not thought to be strongly light dependent, there is
20
some evidence that sesquiterpenes emissions from P. taeda are at least partly light dependent (P. Harley, unpublished data). Hansen and Seufert (2003) have shown that sesquiterpene emissions can be light dependent, using emissions measurements from orange tree specimens. Certain sesquiterpenes emitted by needles of loblolly pine, including β-caryophyllene, are more reactive with ozone than are monoterpenes
25
and their oxidation products are less volatile (Griffin et al., 1999b). Thus, it has been proposed that sesquiterpenes emitted by conifers play a direct role in the formation of new particles in boreal regions (Bonn and Moortgat, 2003).
ACPD
6, 6587–6612, 2006 Formation and growth of biogenic aerosols T. M. VanReken et al. Title Page Abstract Introduction Conclusions References Tables Figures J I J I Back CloseFull Screen / Esc
Printer-friendly Version Interactive Discussion
EGU
3 Results
3.1 α-Pinene
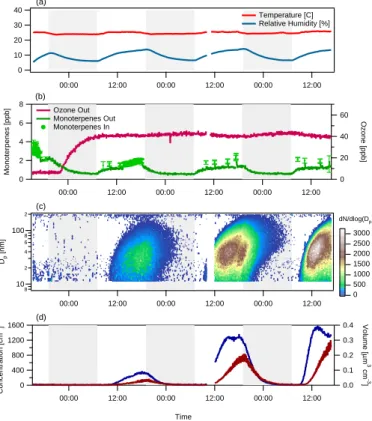
The results of the α-pinene experiment are presented in Fig. 3. During the experi-ment, the temperature remained at 298±1 K, and the relative humidity remained below 10% (Fig. 3a). The concentration of the monoterpene source at the entrance to the
5
aerosol growth chamber was maintained at 6 ppb by diluting an α-pinene calibration gas to the desired concentration (see Sect. 2.4). At steady state, the monoterpene and ozone concentrations leaving the aerosol growth chamber were 3 ppb and 46 ppb, respectively (Fig. 3b).
Approximately three hours after the initial addition of ozone, a particle formation
10
event occurred (Fig. 3c–d). The total particle concentration exiting the chamber in-creased for three hours until reaching a maximum of 450 cm−3, at which point the mode of the size distribution was ∼50 nm. The particle number concentration then decreased steadily for nine hours, with no clear trend in the mode diameter, before beginning to increase again. Over the subsequent three hours the concentration again increased to
15
400 cm−3, with the mode diameter remaining near 50 nm. While the particle number concentration peaked three hours after the initial onset of the particle formation event, the total aerosol volume continued to increase for an additional six hours (Fig. 3d). Indeed, no decrease in aerosol volume was observed until the largest particles grew beyond the range measured by the SMPS. The volume began to increase again as the
20
particle number concentration increased starting at ∼05:00 UTC. The experiment was stopped 18 h after its start.
The oscillatory behavior observed in the particle formation processes during the α-pinene experiment is characteristic of a continuous-flow system with a steady source of condensable material. It has been observed and explained previously (Badger and
25
Dryden, 1939; McGraw and Saunders, 1984). The behavior can be understood by con-sidering the competition for condensable material between the growth of pre-existing particles and the formation of new particles. At the start of the experiment, there was
ACPD
6, 6587–6612, 2006 Formation and growth of biogenic aerosols T. M. VanReken et al. Title Page Abstract Introduction Conclusions References Tables Figures J I J I Back CloseFull Screen / Esc
Printer-friendly Version Interactive Discussion
EGU no significant sink for the condensable material, so new particle formation was favored.
For three hours the available surface area remained low enough the new particles con-tinued to be formed, and hence the number concentration concon-tinued to increase. After those three hours however, the condensational sink became large enough that parti-cle formation was no longer favored. Material continued to condense (and hence the
5
aerosol volume continued to increase), but few new particles were formed. During this period, particles continued to be removed from the system, by removal to the sampling system and via wall losses. Eventually, the available condensational sink decreased enough that particle formation again began to occur, and the number concentration again increased. In this system, the aerosol volume should remain constant once it
10
reached its equilibrium level. This behavior was not observed during this experiment, though this was likely due to an insufficient measurement range for the SMPS. While it cannot be confirmed with the available data, it is likely that the maximum volume reached at ∼02:00 was the equilibrium volume for the system, and the subsequent decrease was due to the uncounted particles beyond the measurement range of the
15
SMPS.
3.2 Holm oak (Quercus ilex )
Figure 4 shows results of the Q. ilex experiment. The time series plots begin approx-imately two hours after the initial addition of ozone to the system, but before any new particle formation occurred. The temperature inside the chamber behaved as in the
20
α-pinene experiment, remaining at 298±1 K, with slightly cooler temperatures at night when the lab was empty (grey shading in Fig. 4 indicates the period during which the plant was not illuminated). The relative humidity in the chamber varied with the tran-spiration cycle of the plant specimen; it was 18±2% during the day and decreased to ∼14% at night. Measurements on the second day indicated that the monoterpene
25
concentration entering the aerosol growth chamber was 9 ppb. Though no measure-ments of the input monoterpene concentrations were made overnight (when the plant was not illuminated), the results of Staudt and Seufert (1995) and the rapid decline
ACPD
6, 6587–6612, 2006 Formation and growth of biogenic aerosols T. M. VanReken et al. Title Page Abstract Introduction Conclusions References Tables Figures J I J I Back CloseFull Screen / Esc
Printer-friendly Version Interactive Discussion
EGU of the output monoterpene concentration support the assumption that the nighttime
emissions of monoterpenes were near zero. GC-MS analysis showed that terpenoid emissions from the Q. ilex specimen used for this experiment were dominated by α-pinene, β-α-pinene, and sabinene and that camphene and α-thujene were also present in measurable quantities; these results were in agreement with the earlier work of
5
Staudt and Seufert (1995). The monoterpene concentration leaving the aerosol growth chamber fluctuated with the plant’s light exposure as well, dropping to almost zero overnight before increasing back to ∼5 ppb the next day. Ozone varied inversely to the monoterpene concentration, reaching a maximum of 48 ppb overnight, but decreasing to ∼44 ppb as the VOC emissions increased again during the day.
10
Two particle formation events were observed during the Q. ilex experiment (Fig. 4c– d). The first occurred at ∼15:00 local time, approximately three hours after the initial addition of ozone. The number of particles formed was small relative to the α-pinene experiment; the maximum particle concentration during the first event was ∼50 cm−3. At the end of the photoperiod (at 19:00 local time), when the plant specimen
presum-15
ably stopped emitting monoterpenes, the particle concentration immediately began to decrease. It was nearly zero by midnight. The monoterpene concentration began to increase again soon after the light was restored at 06:00 the next morning, and three hours later the second particle formation event began. This event reached a maximum particle concentration of 60 cm−3, and the mode diameter for both events was ∼40 nm.
20
The experiment was terminated at 17:00, making the duration of the Q. ilex experiment 25 h total.
3.3 Loblolly pine (Pinus taeda)
The data from the P. taeda experiment are presented in Fig. 5. The duration of the P. taeda experiment was much longer than the previous experiments. It lasted 74 h,
25
which allowed several day/night cycles to be observed. The temperature and relative humidity inside the aerosol growth chamber behaved as they had during the Q. ilex experiment (Fig. 5a). The temperature oscillated between ∼297 K at night and ∼299 K
ACPD
6, 6587–6612, 2006 Formation and growth of biogenic aerosols T. M. VanReken et al. Title Page Abstract Introduction Conclusions References Tables Figures J I J I Back CloseFull Screen / Esc
Printer-friendly Version Interactive Discussion
EGU during the day, while the relative humidity moved from ∼5% each night to ∼15% during
the day, in response to the plant specimen’s transpiration cycle.
During this experiment, ozone was first added to the growth chamber during the night. VOC emissions were lower during this period, due to the temperature decrease associated with the darkened bag and to the presumed reduction in light dependent
5
sesquiterpenes. Both monoterpene (Fig. 5b) and sesquiterpene (Fig. 6) emissions were observed from the specimen. A cartridge collected during the second day of the experiment and analyzed using GC-MS indicated that the monoterpenes emitted in-cluded α-pinene, β-pinene, limonene, ocimene, myrcene, and camphene. Also emitted were the sesquiterpenes β-caryophyllene and humulene. From the input and output
10
monoterpene concentrations in Fig. 5b, it can be inferred that the monoterpene emis-sions increased each morning to ∼1 ppb, and then more gradually increased to ∼2 ppb over the rest of the day.
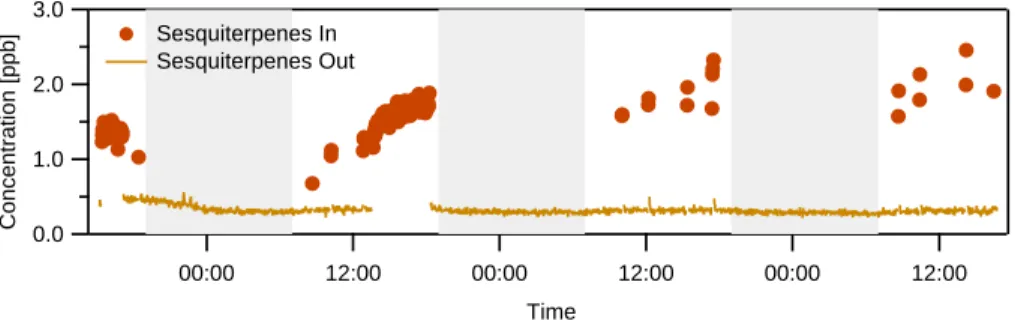
The same trends observed in the monoterpene emissions can be seen in the sesquiterpene emissions also. Figure 6 shows the sesquiterpene signal from the
PTR-15
MS. As with the monoterpenes, the limited data indicates that the sesquiterpene con-centration increases to ∼2 ppb over the course of the day. It reacts completely within the aerosol growth chamber; the output concentration remains at the background noise threshold throughout the experiment. It should be noted that these sesquiterpene con-centrations are more highly uncertain than the reported monoterpene concon-centrations:
20
the sensitivity of the instrument to sesquiterpenes has not been determined, so the conversion from normalized counts to concentration must be estimated. The consid-erations involved in this estimation were described by Greenberg et al. (2006), and the result has an uncertainty of roughly a factor of two. No sesquiterpene signal was observed during either the α-pinene or the Q. ilex experiment.
25
Even with the contribution from sesquiterpenes included, the total terpenoid concen-tration was only about half of that measured during the other two experiments. Despite this, particle formation events occurred during each of the three days of the P. taeda experiment. Moreover, on two of the days, the magnitude of the formation event was
ACPD
6, 6587–6612, 2006 Formation and growth of biogenic aerosols T. M. VanReken et al. Title Page Abstract Introduction Conclusions References Tables Figures J I J I Back CloseFull Screen / Esc
Printer-friendly Version Interactive Discussion
EGU greater than those observed during the previous experiments. The maximum particle
concentrations for the three days were 300, 1200, and 1400 cm−3, respectively. In each case the particle formation began three hours after the branch was illuminated (which coincided approximately with the small temperature increase in the aerosol growth chamber). On the first two days, the mode diameter when the particle concentration
5
reached its maximum was 40 nm. The event was somewhat more intense on the fi-nal day, when the mode diameter reached 50 nm, and the peak particle concentration occurred earlier in the day.
As in the Q. ilex experiment, the formation cycle terminated each night when the light turned off and the temperature decreased, thereby reducing the VOC emissions.
10
At that point, the aerosol concentration decreased steadily throughout the evening and the growth chamber was essentially free of particles by the next morning. However, on the latter two days of the P. taeda experiment, the peak particle concentration occurred several hours before the experiment was terminated. In fact, on the second day, there was evidence of a second, distinct particle formation event occurring in late afternoon
15
(cf. Fig. 5c). These results suggest that, as in the α-pinene experiment, the condensa-tional sink periodically dominated particle formation to the degree that particles were being removed from the system faster than they were being formed.
4 Discussion
The experiments described here emphasize the variability inherent in new particle
for-20
mation from biogenic sources. When exposed to similar conditions in terms of tem-perature, relative humidity, and ozone, the oxidation of Q. ilex emissions resulted in far less new particle formation than did a smaller concentration of pure α-pinene. The oxidation of P. taeda emissions resulted in more particles than either, despite signifi-cantly lower terpenoid concentrations. The monoterpene concentrations entering the
25
aerosol growth chamber during these experiments were much lower than those used in most chamber studies, and approached those encountered in the ambient atmosphere
ACPD
6, 6587–6612, 2006 Formation and growth of biogenic aerosols T. M. VanReken et al. Title Page Abstract Introduction Conclusions References Tables Figures J I J I Back CloseFull Screen / Esc
Printer-friendly Version Interactive Discussion
EGU surrounding canopies dominated by P. taeda (Stroud et al., 2005) or Q. ilex (Schween
et al., 1997).
From the results available here, it is not possible to determine conclusively the mech-anism leading to the formation of new particles. In general, however, the data agree with earlier studies. While it is somewhat surprising that there was such a large di
ffer-5
ence in the amount of aerosol produced during the Q. ilex experiment when compared with α-pinene, a likely explanation is found in the composition of the Q. ilex emissions. According to the GC-MS analysis, α-pinene accounted for only ∼40% of the monoter-penes emitted from Q. ilex. Another 40% was β-pinene, and the previously mentioned compounds accounted for the rest. β-pinene is known to react much more slowly than
10
α-pinene (Griffin et al., 1999b), and given the relatively short residence time in the growth chamber, only a small fraction of the β-pinene would have reacted. This would of course lead to the formation of less condensable material, which is consistent with the observed smaller particle formation event. At the opposite extreme, the large parti-cle formation events observed during the P. taeda experiment are consistent with rapid
15
reaction of sesquiterpenes to condensable products, which may contribute directly to the nucleation process, as suggested by Bonn and Moortgat (2003).
However, not all of the observed behavior can be explained. For example, it is un-clear why during the P. taeda experiment there was such variation in the magnitude of the particle formation event under seemingly similar experimental conditions. It is
pos-20
sible that the composition of the biogenic emissions changed from one day to the next. Another possibility is that some gas species in addition to those observed during the study contributed to the particle formation event and varied during the experiment. Fu-ture studies will measure additional trace gas properties in effort to better characterize the system.
25
This study has demonstrated the ability to form aerosol directly from biogenic emis-sions under conditions that approach the ambient atmosphere. As had been expected, the magnitude of the particle formation event varied considerably between the species examined here. The facility developed for this work will be a valuable tool for
examin-ACPD
6, 6587–6612, 2006 Formation and growth of biogenic aerosols T. M. VanReken et al. Title Page Abstract Introduction Conclusions References Tables Figures J I J I Back CloseFull Screen / Esc
Printer-friendly Version Interactive Discussion
EGU ing the mechanisms leading to new particle formation from biogenic sources, and for
characterizing the properties of aerosols resulting from such formation events.
Acknowledgements. The National Center for Atmospheric Research is sponsored by the
Na-tional Science Foundation. Support for this work at NCAR was provided by the Advanced Study Program and the Opportunity Fund.
5
References
Andreae, M. O. and Crutzen, P. J.: Atmospheric aerosols: biogeochemical sources and role in atmospheric chemistry, Science, 276(5315), 1052–1058, 1997.
Badger, E. H. M. and Dryden, I. G. C.: The formation of gum particles in coal-gas, Trans. Faraday Soc., 35, 607–628, 1939.
10
Bonn, B. and Moortgat, G. K.: New particle formation during α- and β-pinene oxidation by O3, OH, and NO3, and the influence of water vapour: particle size distribution studies, Atmos. Chem. Phys., 2, 183–196, 2002.
Bonn, B. and Moortgat, G. K.: Sesquiterpene ozonolysis: origin of atmospheric new particle formation from biogenic hydrocarbons, Geophys. Res. Lett., 30(11), 1585,
15
doi:10.1029/2003GL017000, 2003.
Boy, M., Hellmuth, O., Korhonen, H., Nillson, D., ReVelle, D., Turnipseed, A., Arnold, F., and Kulmala, M.: MALTE model to predict new aerosol formation in the lower troposphere, Atmos. Chem. Phys. Discuss., 6, 3465–3512, 2006.
Claeys, M., Graham, B., Vas, G., Wang, W., Vermeylen, R., Pashynska, V., Cafmeyer, J.,
20
Guyon, P., Andreae, M. O., Artaxo, P., and Maenhaut, W.: Formation of secondary organic aerosol through photooxidation of isoprene, Science, 303(5661), 1173–1176, 2004.
Crump, J. G. and Seinfeld, J. H.: Turbulent deposition and gravitational sedimentation of an aerosol in a vessel of arbitrary shape, J. Aerosol Sci., 12, 405–415, 1981.
Fuch, M. A.: The Mechanics of Aerosols, Pergamon Press, New York, 1964.
25
Goldstein, A. H., McKay, M., Kurpius, M. R., Schade, G. W., Lee, A., Holzinger, R., and Rasmussen, R.: Forest thinning experiment confirms ozone deposition to forest canopy is dominated by reaction with biogenic VOC, Geophys. Res. Lett., 31(L22106), doi:10.1029/2004GL021259, 2004.
ACPD
6, 6587–6612, 2006 Formation and growth of biogenic aerosols T. M. VanReken et al. Title Page Abstract Introduction Conclusions References Tables Figures J I J I Back CloseFull Screen / Esc
Printer-friendly Version Interactive Discussion
EGU
Greenberg, J. P., Guenther, A., Zimmerman, P., Baugh, W., Geron, C., Davis, K., Helmig, D., and Klinger, L. F.: Tethered balloon measurements of biogenic VOCs in the atmospheric boundary layer, Atmos. Environ., 33(6), 855–867, 1999.
Greenberg, J. P., Friedi, H., Guenther, A. B., Hanson, D., Harley, P., and Karl, T.: Volatile organic emission fro the distillation and pyroloysis of vegetation, Atmos. Chem. Phys., 6,
5
81–91, 2006.
Griffin, R. J., Cocker, D. R., Seinfeld, J. H., and Dabdub, D.: Estimate of global atmospheric organic aerosol from oxidation of biogenic hydrocarbons, Geophys. Res. Lett., 26(17), 2721– 2724, 1999a.
Griffin, R. J., Cocker, D. R., Flagan, R. C., and Seinfeld, J. H.: Organic aerosol formation from
10
the oxidation of biogenic hydrocarbons, J. Geophys. Res., 104(D3), 3555–3567, 1999b. Hansen, U. and Seufert, G.: Temperature and light dependence of beta-caryophyllene emission
rates, J. Geophys. Res., 108(D24), 4801, doi:10.1029/2003JD003853, 2003.
Hanson, D., Greenberg, J. P., Henry, B., and Kosciuch, E.: Proton transfer reaction mass spectroscopy at high drift tube pressure, Int. J. Mass Spec., 23(1–3), 507–518, 2002.
15
Holzinger, R., Lee, A., Paw U, K. T., and Goldstein, A. H.: Observations of oxidation products above a forest imply biogenic emissions of very reactive compounds, Atmos. Chem. Phys., 5, 67–75, 2005.
Intergovernmental Panel on Climate Change (IPCC): Climate Change: The Scientific Basis, Cambridge University Press, UK, 2001.
20
Joutsensaari, J., Loivam ¨aki, M., Vuorinen, T., Miettinen, P., Nerg, A.-M., Holopainen, J. K., and Laaksonen, A.: Nanoparticle formation by ozonolysis of inducible plant volatiles, Atmos. Chem. Phys., 5, 1489–1495, 2005.
Kanakidou, M., Seinfeld, J. H., Pandis, S. N., Barnes, I., Dentener, F. J., Facchini, M. C., Van Dingenen, R., Ervens, B., Nenes, A., Nielsen, C. J., Swietlicki, E., Putaud, J. P., Balkanski,
25
Y., Fuzzi, S., Horth, J., Moortgat, G. K., Winterhalter, R., Myhre, C. E. L., Tsigaridis, K., Vignati, E., Stephanou, E. G., and Wilson, J.: Organic aerosol and global climate modelling: a review, Atmos. Chem. Phys., 5, 1053–1123, 2005.
Karl, T., Harley, P., Guenther, A., Rasmussen, R., Baker, B., Jardine, K., and Nemitz, E.: The bi-directional exchange of oxygenated VOCs between a loblolly pine (Pinus taeda) plantation
30
and the atmosphere, Atmos. Chem. Phys., 5, 3015–3031, 2005.
Kroll, J. H., Ng, N. L., Murphy, S. M., Flagan, R. C., and Seinfeld, J. H.: Secondary organic aerosol formation from isoprene photooxidation under high-NOx conditions, Geophys. Res.
ACPD
6, 6587–6612, 2006 Formation and growth of biogenic aerosols T. M. VanReken et al. Title Page Abstract Introduction Conclusions References Tables Figures J I J I Back CloseFull Screen / Esc
Printer-friendly Version Interactive Discussion
EGU
Lett., 32(L18808), doi:10.1029/2005GL023637, 2005.
Kulmala, M., Vehkam ¨aki, H., Pet ¨aj ¨a, T., Dal Maso, M., Lauri, A., Kerminen, V.-M., Birmili, W., and McMurry, P. H.: Formation and growth rates of ultrafine atmospheric particles: a review of observations, J. Aerosol Sci., 35(2), 143–176, 2004.
Levenspiel, O.: Chemical Reaction Engineering, John Wiley & Sons, New York, 1972.
5
Lindinger, W., Hansel, A., and Jordan, A.: On-line monitoring of volatile organic compounds at pptv levels by means of proton-transfer-reaction mass spectrometry (PTR-MS) – medical applications, food control and environmental research, Int. J. Mass Spectrom., 173(3), 191– 241, 1998.
McFiggans, G., Coe, H., Burgess, R., Allan, J., Cubison, M., Alfarra, M. R., Saunders, R.,
Saiz-10
Lopez, A., Plane, J. M. C., Wevill, D. J., Carpenter, L. J., Rickard, A. R., and Monks, P. S.: Direct evidence for coastal iodine particles from Laminaria macroalgae- linkage to emissions of molecular iodine, Atmos. Chem. Phys., 4, 701–713, 2004.
McGraw, R. and Saunders, J. H.: A condensation feedback mechanism for oscillatory nucle-ation and growth, Aerosol Sci. Technol., 3(4), 367–380, 1984.
15
Schween, J. H., Dlugi, R., Hewitt, C. N., and Foster, P.: Determination and accuracy of VOC-fluxes above the pine/oak forest at Castelporziano, Atmos. Environ., 31 199–215, 1997. Staudt, M., Mandl, N., Joffre, R., and Rambal, S.: Intraspecific variability of monoterpene
composition emitted by Quercus ilex leaves, Canadian Journal of Forest Research, 31(1), 174–180, 2001.
20
Staudt, M. and Seufert, G.: Light-dependent emission of monoterpenes by Holm oak (Quercus ilex L.), Naturwissenschaften, 82(2), 89–92,1995.
Stroud, C., Makar, P., Karl, T., Guenther, A., Geron, C., Turnipseed, A., Nemitz, E., Baker, B., Potosnak, M., and Fuentes, J. D.: Role of canopy-scale photochemistry in modifying biogenic-atmosphere exchange of reactive terpene species: results from the CELTIC field
25
study, J. Geophys. Res., 110, D17303, doi:10.1029/2005JD005775, 2005.
VanReken, T. M., Ng, N. L., Flagan, R. C., and Seinfeld, J. H.: Cloud condensation nucleus activation properties of biogenic secondary organic aerosol, J. Geophys. Res., 110, D07206, doi:10.1029/2004JD005465, 2005.
Yu, J. Z., Cocker, D. R., Griffin, R. J., Flagan, R. C., and Seinfeld, J. H.: Gas-phase ozone
30
oxidation of monoterpenes: gaseous and particulate products, J. Atmos. Chem., 34(2), 207– 258, 1999.
ACPD
6, 6587–6612, 2006 Formation and growth of biogenic aerosols T. M. VanReken et al. Title Page Abstract Introduction Conclusions References Tables Figures J I J I Back CloseFull Screen / Esc
Printer-friendly Version Interactive Discussion EGU Aerosol Growth Chamber Ozone Source PTR-MS (Gas Phase Organics) Ozone Monitor SMPS (Aerosol Size Distribution) GC-MS (Organic Speciation) Biogenic Emissions Enclosure Zero Air Source Temperature / RH Exhaust Figure 1
Fig. 1. Schematic of the experimental apparatus used in these experiments. Details of the
ACPD
6, 6587–6612, 2006 Formation and growth of biogenic aerosols T. M. VanReken et al. Title Page Abstract Introduction Conclusions References Tables Figures J I J I Back CloseFull Screen / Esc
Printer-friendly Version Interactive Discussion EGU 2 4 6 10-4 2 4 6 10-3 2 β (s -1 ) 5 6 7 8 9 10 2 3 4 5 6 7 8 9100 2 3 4 5 Dp (nm) 2.0x10⁵ 1.5 1.0 0.5 0.0 dN/dlog(D p ) 5 6 7 8 9 10 2 3 4 5 6 7 8 9100 2 3 4 5 Figure 2
Fig. 2. Results of the wall loss characterization experiment. (a) Aerosol number size
distribu-tions entering (blue) and leaving (green) the aerosol growth chamber at steady state under the same flow conditions used throughout the study.(b) Calculated values of β(dp) for the aerosol growth chamber based on Eq. (2) and the data presented in (a).
ACPD
6, 6587–6612, 2006 Formation and growth of biogenic aerosols T. M. VanReken et al. Title Page Abstract Introduction Conclusions References Tables Figures J I J I Back CloseFull Screen / Esc
Printer-friendly Version Interactive Discussion EGU 500 400 300 200 100 0 Concentration [cm -3] 18:00 21:00 00:00 03:00 06:00 09:00 Time 0.10 0.08 0.06 0.04 0.02 0.00 Volume [ µ m 3 cm -3 ] Concentration Volume (d) 50 40 30 20 10 0 Ozone [ppb] 18:00 21:00 00:00 03:00 06:00 09:00 12 8 4 0 Monoterpenes [ppb] Monoterpenes In Monoterpenes Out Ozone Out (b) 8 10 2 4 6 8 100 2 Dp (nm) 18:00 21:00 00:00 03:00 06:00 09:00 1000 800 600 400 200 0 dN/dlog(Dp) (c) 40 30 20 10 0 18:00 21:00 00:00 03:00 06:00 09:00 Temperature [C] Relative Humidity [%] (a) Figure 3
Fig. 3. Results from the α-pinene experiment. (a) Temperature and relative humidity in the
aerosol growth chamber.(b) Gas phase concentrations entering and leaving the aerosol growth
chamber. Green dotted line is the monoterpene concentration entering the chamber, and the green solid line is the monoterpene concentration measured at the chamber exit. Solid purple line is the ozone concentration at the chamber exit.(c) Aerosol number size distribution exiting
the aerosol growth chamber. (d) Total aerosol number concentration (solid blue line), and
ACPD
6, 6587–6612, 2006 Formation and growth of biogenic aerosols T. M. VanReken et al. Title Page Abstract Introduction Conclusions References Tables Figures J I J I Back CloseFull Screen / Esc
Printer-friendly Version Interactive Discussion EGU 60 40 20 0 Concentration [cm -3] 18:00 00:00 06:00 12:00 Time 0.010 0.008 0.006 0.004 0.002 0.000 Volume [ µ m 3 cm -3 ] (d) 12 8 4 0 Monoterpenes [ppb] 18:00 00:00 06:00 12:00 60 40 20 0 Ozone [ppb] Monoterpenes In Monoterpenes Out Ozone (b) 8 10 2 4 6 8 100 2 Dp [nm] 18:00 00:00 06:00 12:00 (c) dN/dlog(D p) 250 200 150 100 50 0 40 30 20 10 0 18:00 00:00 06:00 12:00 Temperature [C] RH [%] (a) Figure 4
Fig. 4. Results of the Q. ilex experiment. Grey shading indicates the period when the light
illuminating the biogenic emissions enclosure was switched off. (a) Temperature and relative humidity as in Fig. 3a. (b) Gas phase concentrations. As in Fig. 3b, except that measured
monoterpene concentrations entering the aerosol growth chamber are presented as green squares.(c) Aerosol number size distribution exiting the aerosol growth chamber, as in Fig. 3c. (d) Total aerosol number concentration and volume, as in Fig. 3d.
ACPD
6, 6587–6612, 2006 Formation and growth of biogenic aerosols T. M. VanReken et al. Title Page Abstract Introduction Conclusions References Tables Figures J I J I Back CloseFull Screen / Esc
Printer-friendly Version Interactive Discussion EGU 40 30 20 10 0 00:00 12:00 00:00 12:00 00:00 12:00 Temperature [C] Relative Humidity [%] (a) 8 6 4 2 0 Monoterpenes [ppb] 00:00 12:00 00:00 12:00 00:00 12:00 60 40 20 0 Ozone [ppb] (b) Ozone Out Monoterpenes Out Monoterpenes In 8 10 2 4 6 8 100 2 Dp [nm] 00:00 12:00 00:00 12:00 00:00 12:00 3000 2500 2000 1500 1000 500 0 (c) dN/dlog(Dp) 1600 1200 800 400 0 Concentration [cm -3] 00:00 12:00 00:00 12:00 00:00 12:00 Time 0.4 0.3 0.2 0.1 0.0 Volume [ µ m 3 cm -3 ] (d) Figure 5
Fig. 5. Same as Fig. 4, but for the P. taeda experiment. The two-hour gap in the data was
caused by a temporary instrument malfunction. Note what appears to be a second particle formation event at ∼17:00 on the second day of the experiment (see text).
ACPD
6, 6587–6612, 2006 Formation and growth of biogenic aerosols T. M. VanReken et al. Title Page Abstract Introduction Conclusions References Tables Figures J I J I Back CloseFull Screen / Esc
Printer-friendly Version Interactive Discussion EGU 3.0 2.0 1.0 0.0 Concentration [ppb] 00:00 12:00 00:00 12:00 00:00 12:00 Time Sesquiterpenes In Sesquiterpenes Out Figure 6
Fig. 6. Sesquiterpene concentrations from the P. taeda experiment. The sensitivity of the
PTR-MS to sesquiterpenes has not been determined, so the conversion from normalized counts to concentration was estimated as described by Greenberg et al. (2006). Red circles show the VOC emissions entering the chamber. The orange solid line shows the amount of sesquiter-penes in the stream exiting the chamber, at background noise levels.