HAL Id: hal-01934264
https://hal.archives-ouvertes.fr/hal-01934264
Submitted on 25 Nov 2018HAL is a multi-disciplinary open access
archive for the deposit and dissemination of sci-entific research documents, whether they are pub-lished or not. The documents may come from teaching and research institutions in France or abroad, or from public or private research centers.
L’archive ouverte pluridisciplinaire HAL, est destinée au dépôt et à la diffusion de documents scientifiques de niveau recherche, publiés ou non, émanant des établissements d’enseignement et de recherche français ou étrangers, des laboratoires publics ou privés.
Coseismic Slip Vectors of 24 August and 30 October
2016 Earthquakes in Central Italy: Oblique Slip and
Regional Kinematic Implications
Eugenie Perouse, Lucilla Benedetti, Jules Fleury, Magali Rizza, Irene Puliti,
Jérémy Billant, Jerome van der Woerd, Nathalie Feuillet, Eric Jacques, Bruno
Pace
To cite this version:
Eugenie Perouse, Lucilla Benedetti, Jules Fleury, Magali Rizza, Irene Puliti, et al.. Coseismic Slip Vectors of 24 August and 30 October 2016 Earthquakes in Central Italy: Oblique Slip and Regional Kinematic Implications. Tectonics, American Geophysical Union (AGU), 2018, 37 (10), pp.3760-3781. �10.1029/2018TC005083�. �hal-01934264�
This article has been accepted for publication and undergone full peer review but has not been through the copyediting, typesetting, pagination and proofreading process which may lead to differences between this version and the Version of Record. Please cite this article as
Coseismic slip vectors of August 24 and October 30 2016
earthquakes in central Italy: oblique slip and regional kinematic
implications
Eugénie Perouse1, Lucilla Benedetti1,*, Jules Fleury1, Magali Rizza1, Irene Puliti2,3, ,Jeremy Billant1,4, Jerome Van der Woerd5, Nathalie Feuillet6, Eric Jacques6, Bruno Pace7
1- Aix Marseille Univ, CNRS, IRD, INRA, Coll France, CEREGE, Aix-en-Provence, France 2- Dipartimento di Fisica e Geologia, Università di Perugia, Piazza dell'Università, 00123
Perugia, Italy
3- Present address: Dipartimento di Ingegneria e Geologia InGeo, Campus Universitario, Università "G. D'Annunzio", 66100 Chieti, Italy
4-Present address : Université Côte d’Azur, CNRS, Observatoire de la Côte d’Azur, IRD, Géoazur
5- EOST-CNRS Université de Strasbourg, France 6- IPGP-CNRS, Paris, France
7- DiSPUTer, Università degli Stdi “G. d’Annunzio” Chieti-Pescara, Italy * Corresponding author: Lucilla Benedetti (benedetti@cerege.fr)
Key points:
(1) Unique dataset of high resolution georeferenced 3D point clouds of bedrock fault scarp before and after the October 30 earthquake.
(2) The near-field coseismic displacements of the Mt Vettore fault for the October 30 is quantified
(3) October 30 surface rupture results from seismic slip at depth and has thus a tectonic origin.
Abstract
After August 24 and October 30 2016 central Italy earthquakes (Mw 6.0 and 6.5, respectively), photogrammetry and geodetic survey were performed at various sites along a 6 km-long portion of the rupturing Mt Vettore fault system, providing very high resolution georeferenced 3D point clouds and imagery of the August 24 rupture and a dataset of bedrock fault scarp before/after the October 30 earthquake. The maximum coseismic displacement for both events occurs near Scoglio dell’ Aquila with an average normal dip-slip of 22 ± 4cm and 184 ± 6cm, respectively. Coseismic slip vectors, and meter-scale corrugation axis are oriented N280 ±10° on the ~N140° striking main Vettore fault involving oblique normal slip with a right-lateral component, and N205 ±10° on ~N170° fault strands implying oblique normal slip with a left-lateral component. We quantify the near-field coseismic displacements of the Mt Vettore fault for the October 30 event: the footwall has been translated horizontally by 42 ± 2cm toward the ENE and uplifted by 11 ± 2cm. The hangingwall has moved horizontally by 26 ± 2cm, toward the NW, in a direction parallel to the fault plane and subsided by 116 ± 2cm. The fault geometry and our determined surface coseismic slip vectors are mechanically compatible with a σ3= N65 ±15°. This stress regime is consistent with the October 30, 2016 focal mechanism and the relative motion between the Adriatic microplate and the Tyrrhenian coastal region. The October 30 surface rupture results from seismic slip at depth and thus has a tectonic origin.
1. Introduction
Understanding how surface rupture observations can be related to crustal deformation is key to any morphotectonic studies. Moreover geological observations of the past surface rupture are an essential component of fault-based seismic hazard analysis (e.g., Peruzza et al., 2011; Field et al., 2015; Valentini et al., 2017). Surface rupture associated with normal fault earthquakes have been scarce since the advent of modern seismology (Wallace, 1987; Caskey et al., 1996; Boncio et al., 2012). In the Mediterranean in particular, there have been very few normal fault earthquakes strong enough to be associated with unquestionable surface rupture and recent enough to be instrumentally recorded (e.g., Jackson et al., 1982; Bernard & Zollo, 1989; Pantosti et al., 1993).
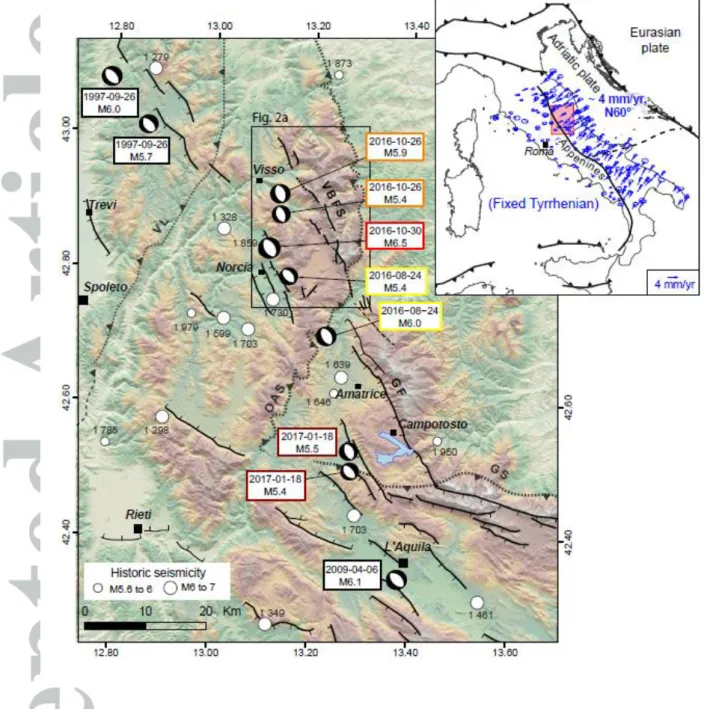
In 2016, Italy was struck by an earthquake sequence that lasted several months with 3 shocks on August 24, Mw=6.0, October 26, Mw=5.9 and October 30, Mw=6.5 (Figure 1). This sequence occurred in Central Apennines, where NW-SE striking normal fault systems are accommodating ~4 mm/yr of ENE directed extension related to the relative motion between the Adriatic microplate and the Tyrrhenian coastal region ( D’Agostino et al., 2011; D’Agostino, 2014; Devoti et al., 2017, inset Figure 1). This sequence hit the Norcia-Amatrice area, less than 20 km south of the area that was shaken during the 1997 Colfiorito earthquakes (≥ Mw6.0) and about 50 km north of L’Aquila struck in 2009 (Mw=6.1) (Figure 1). All in all, almost 60-km of faults ruptured during the 2016 sequence along the Mt Vettore-Bove fault system, partially filling a gap between the 1997 and the 2009 earthquake sequences. There was no clear foreshocks activity prior to the August 24 first event (Chiaraluce et al., 2017). All the main events of 2016 sequence are confined within the first 8 km of the upper crust and the two major events nucleated at 7-8 km depth, on N150° (±10°) striking normal fault planes, dipping 50° (±5°) westward , at the intersection with a basal structure gently dipping eastward (Chiaraluce et al., 2017).
Those earthquakes produced surface rupture mainly along the Mt Vettore fault resulting in fault scarp exhumation of almost 2 m during the October 30 event. The main rupture associated with this event is about 8-km-long and bound the main Mt Vettore fault plane (Villani et al., 2017, 2018; Civico et al., 2018). There have been, however, debate as to whether or not the observed displacement on the Mt Vettore fault that reached up to 2 m of vertical displacement after the October 30 event was related to coseismic displacement or rather surficial processes resulting from shaking and unrelated to the seismic source (e.g. Valensise et al. 2016 refering to August 24th event). The rupturing scenario, with several
events rupturing consecutively several fault segments, and the morphological expression of the surface ruptures make this earthquake sequence a unique natural laboratory to study earthquake normal fault morphological expression.
Here we aim at constraining the co-seismic slip vectors from high resolution surveying of the surface displacements triggered by the August 24 and October 30 events. Our contribution is based on photogrammetry data of the bedrock fault scarp before and after the August 24 and October 30 earthquakes at various points along the rupturing Mt Vettore fault segment. The acquired dataset allows determining the co-seismic slip vectors of August 24 and October 30 events. The near field coseismic motions of the footwall and of the hangingwall during the October 30 event are also determined with GNSS benchmarks points measured before and after this earthquake. All our observations are then compared and discussed with other sets of data both at longer time scale and at a larger spatial scale.
2. Surface ruptures and field observations
The 2016 central Italy seismic sequence started on August 24 with a Mw=6.0 mainshock located a few kilometer north of Amatrice, followed by a Mw=5.4 aftershock located 10km to the NW (Figure 1), causing 299 fatalities and heavy damages in the nearby villages. The most prominent surface ruptures were observed north of the epicentral area, along the southern portion of the Mt Vettore fault system, following a N155° alignment over an overall length of ~5km (Pucci et al., 2017). The surface ruptures, running at the base of the Mt Vettore cumulative scarp, cross cut through all morphological features such as geological beddings, unconsolidated deposits, alluvial fans and gullies, independently from lithology and topography (Pucci et al., 2017). The average observed coseismic vertical throw is 13 cm with maximal values of 25 cm located in the Scoglio dell’ Aquila area (see location on figure 2b). Southward of August 24 epicenter, sparse surface ruptures associated with less than 5 cm throw have been observed along the northern portion of the Mt. Gorzano fault (Figure 1) (Pucci et al., 2017).
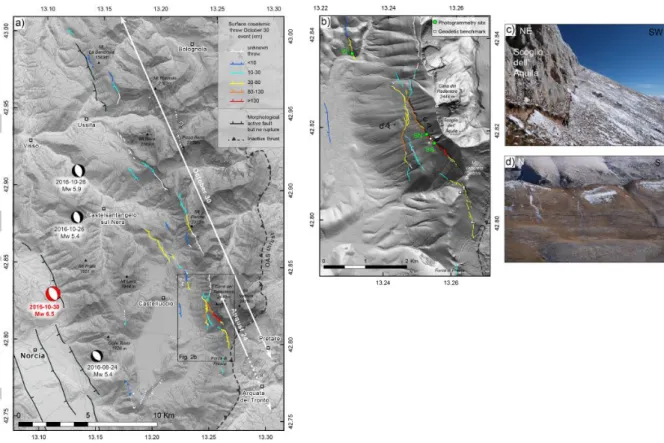
Two months later, on October 26 a Mw=5.9 event occurred 25 km north of the August 24 rupture area, near Visso (Figure 1). Diffuse surface displacements of few centimeters have been observed near Visso (Villani et al., 2017, 2018; Civico et al., 2018). On October 30, the largest shock of the sequence (Mw=6.5) occurred between the two previous events. A complete and detailed map of the surface observations has been compiled by the EMERGEO group (i.e., (Villani et al., 2017, 2018; Civico et al., 2018) and presented in detail in Figure 2a
and 2b. The surface coseismic ruptures extend from Ussita in the north to Forca di Presta in the south, roughly trending ≈ N155° for about 30 km long over a 5 km wide area (Figure 2a). In Figure 2a and 2b, the coseismic rupture is color-coded according to the vertical throw (Villani et al., 2017, 2018; Civico et al., 2018) . The vertical throw increases from NW to SE with a few centimeters in the Ussita area, 50-70 cm at the base of Mt Porche, and 80-130cm along the main Mt Vettore fault segment (Scoglio dell’ Aquila sites) (Figure 2a). The maximal coseismic throw was observed along the Mt Vettore segment for both August 24 and October 30 events.
We hereby describe the surface ruptures associated with October 30 event from south to north. It starts from the road near Forca di Presta climbing the relief toward Mt Vettoretto following a N170° trend for about 1 km. It then veers westward striking N140° over a few hundred meters. Surface ruptures are then distributed on two main branches joining at the base of the most prominent escarpment just below the Cima del Redontore peak culminating at 2448 m asl (Figure 2d). The main one runs along the limestone free face striking N140° and is associated with the most important vertical displacement (Figure 2c). The second one composed of several en-echelon segments of 10-100 m long, is N170-180° oriented and runs along the major slope break on the Mt Vettore flank. It then veers N120° when reaching the upper main branch. Others smaller segments are visible on the slope in front of the Scoglio dell Aquila main branch, dipping NE and delimiting a small graben of a few hundred meters width (Figure 2b). North of Cima del Redentore, although the Vettore fault continues northward, the rupture progressively vanishes after a few hundred meters. Lower in the topography, the rupture striking N160-170° becomes visible again when crossing Valle delle Fonti (also known as “Colli alti e bassi”, Figure 2b).
After both August 24 and October 30 events, ground-based photogrammetric surveys were performed at three sites along the fault portion associated with the most important displacements (Figure 2b). Structure-from-Motion (SfM) photogrammetry surveys of the surface rupture were performed at two sites near Scoglio dell’Aquila (SN for Scoglio north site and SS for Scoglio south site) and one site at Valle de Fonti (VF), (Figure 2b). Site SS was surveyed both before and after October 30 earthquake whereas SN and VF were only surveyed after October 30. In addition, GNSS benchmark points were placed near Scoglio dell’Aquila and Mt Vettoretto on both sides of the rupturing fault after August 24 event allowing reconstruction of the absolute fault motion during October 30 event. We hereby present the results of those high resolution acquisitions.
3. Results from photogrammetry data
3.1 Photogrammetry survey and 3D topography acquisition
Over the last decade, development in geospace technologies and terrestrial remote sensing has been very rapid. Close-range SfM-photogrammetry has become an extremely powerful tool to acquire georeferenced topographic models from simple and lightweight devices, also allowing to produce spectral orthophotographies. SfM-photogrammetry appears as an efficient tool for reconstructing earthquake offsets, tectonic structural analysis and determining surface displacement fields (e.g., Bemis et al., 2014, Johnson et al., 2014; Lucieer et al., 2014, Shervais and Kirkpatrick 2016; Billant et al., 2016; Escartin et al., 2016). The principle of SfM-photogrammetry has been reviewed largely in the literature (James & Robson, 2012; Westoby et al., 2012). Here we summarized the few main steps : (i) the acquisition of several photographs of a realworld object from different point of views; (ii) the calculation of the relative location of each photograph using the internal calibration of the camera and a bundle-ray adjustment algorithm; (iii) the dense correlation between each image pair for creating a dense 3D point cloud. This point cloud is georeferenced with Ground Control Points (GCP) in an absolute coordinate system. Many digital elevation products can then be generated, such as a DEM, along with orthophotomosaics on the desired projection plane. The quality and accuracy of the 3D model is related to several factors of the photogrammetric pipeline. The image quality is essential and depends upon the sensor, the optical lense, and also on the photographic setting. A sharp and detailed photograph is required with minimal loss of quality towards the image corners. The protocol of shooting has to include parallel overlapping pictures complemented by some oblique photographs to avoid hidden parts of the fault scarp and a few convergent photographs, focused on a textured 3D object, for proper calibration of the camera. This calibration is then used as input for external orientation of the camera. The last important point is the optimization of the external orientation using some GCPs for correcting non-linear distortion and removal of outliers in the sparse point cloud. Dense correlation can then be parametrized with more or less regularization depending of the level of smoothing aimed. In the field, we placed regularly on the fault scarp and about 1-2 m around, 10 checkerboard GCPs per site (Table S2). Each GCP was measured using a RTK-GNSS device (Trimble R8) with an accuracy of better than 3 cm (see Table S2, coordinate system used is WGS84 / UTM zone 33N). The base station was deployed at the base of the Mount Vettore, with a PDL-450 Trimble radio transmission
system. The rover was used over the benchmarks, with a radio receiver antenna for real time GNSS-corrections. The base point coordinates were derived from post-processing RINEX data using the Aquila permanent GNSS station, and the Trimble Business Center software. The distance between the two stations is 49 km. Absolute motion of the L’Aquila station (<1mm) during the October 30th earthquake with respect to our local displacements is considered negligible.
The digital camera used is a full frame Sony Alpha 7R with a CMOS sensor 7360x4912 pixels wide, equipped with a fixed focal length lens Sony 28mm f/2. The acquisition of ground photographs was performed with almost the same photographic settings (fstop:11; ISO 400; Autofocus but with keeping fixed distance camera to object) for each site independently, and stabilization device was disabled ensuring a strong camera rigidity. Photogrammetry processing was undertaken with the software Agisoft Photoscan Professional version 1.2.6. Processing parameters are given in the Supplemental material (Table S1).
The dense point clouds acquired with photogrammetry allows reconstructing the co-seismic slip vectors for October 30 at SN, SS and VF, and the coco-seismic slip vectors for August 24 at SN and SS. This will be presented in section 3.2. Reconstructed 3D meshes with texture of the bedrock fault planes also allows visualization of longer term kinematics indicators such as striations, slickensides and corrugations, that will be presented in section 3.3. Moreover, at SS, the availability of a pre- and post-October 30 point cloud allows determining the absolute 3D coseismic displacements of the footwall and the hangingwall, presented in section 3.4. Point clouds acquired at SN and SS are publicly-available through https://tls.unavco.org/projects/U-067/.
3.2 August 24 and October 30 events coseismic slip vectors
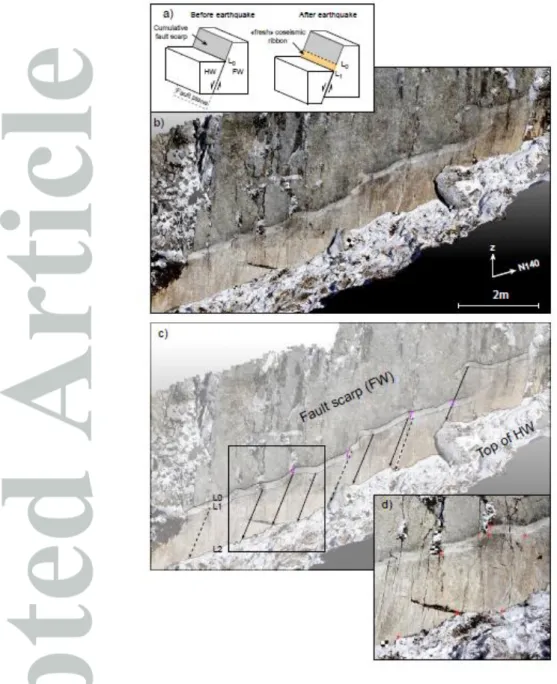
3.2.1 DeterminationDuring a normal faulting earthquake, the relative motion between the hangingwall (HW) and the footwall (FW) produces bedrock footwall exhumation at the base of the cumulative fault scarp. The freshly exposed section depicts a pale unweathered coseismic ribbon on the fault plane (Figure 3a), which represents a good geomorphic marker for deriving the 3D coseismic slip vector. The photogrammetry sites SN and SS exhibit two distinctive coseismic ribbons at the base of the fault scarp: an upper white ribbon exhumed during August 24 event and a lower yellowish ribbon, exhumed during October 30 event
(Figure 3b, Supplementary Material Figure S1). At the Valle delle Fonti site, the coseismic ribbon results from October 30 event only (Supplementary Material Figure S2).
At each site, the top and the bottom of the coseismic ribbons (lines L0 and L1 for August 24 ribbon, lines L1 and L2 for October 30 ribbon) were digitized on the point cloud (Figure 3). Marker points were then manually identified on L0, L1 and L2 to reconstruct the coseismic slip vectors at each site (purple and black vectors on Figure 3c) (see Gold et al. 2013 and Delong et al. 2015 for a similar approach). The identified marker points are typically sharp line bends and/or inflexion point curves, as shown on Figure 3d, which can be recognized before and after the earthquake on the fault plane. We could identify the location of each marker point with an error that we estimate at 2.5 cm for the sharpest marker points, and at 4 cm for marker points having a more blurred or smoothed shape (Figure 3c, 3d, Table 1). As a slip vector connects two marker points having independent uncertainties, the uncertainty associated with the slip vector length is the quadratic sum of the uncertainty of each marker point (Taylor 1997), resulting in a 4 to 6 cm error in the slip vector length (Table 1). The error in slip vector direction, which results from each marker point location uncertainty and the slip vector length, is then calculated for each slip vector (see Table 1). All the coseismic slip vectors length and direction from manual picking are plotted on Figure 4 and reported in Table 1 .
Moreover, we derive coseismic slip vectors using the Iterative Closest Point (ICP) algorithm which computes the rigid body transformation (rotation and translation) between two offset 3-dimensional shapes (Besl & McKay 1992). This algorithm has already been used to constrain coseismic deformation by using pre- and post-earthquakes point clouds (Nissen et al., 2012, 2014; Scott et al., 2018). We implemented this ICP algorithm into python script which requires a “source” and a “target” point cloud and find the rigid body transformation to match the two point clouds.
We applied global point-to-point ICP on these two point clouds, following three iterative steps: (1) For each point of the “source” point cloud, the closest neighbor point in the “target” point cloud is identified. (2) We compute the rigid body transformation (a translation and a rotation) that minimizes distances between all paired points. (3) The resulting rigid body transformation is applied globally to the entire “source” point cloud.
We used as “source” and “target” point clouds the digitized top line and bottom line of the October 30 coseismic ribbon, respectively (lines L1 and L2, respectively, Figure 3c). Then,
we apply the single final obtained rigid body transformation matrix (which includes a small rotational component) to the source point cloud (i.e., L1 line, Figure 3c) to derive a continuous coseismic displacement field. On Figure 4, we plot the along fault strike projection of this continuous displacement field, with a ~10cm resolution (dotted line on Figure 4).
3.2.2 Coseismic slip vectors description
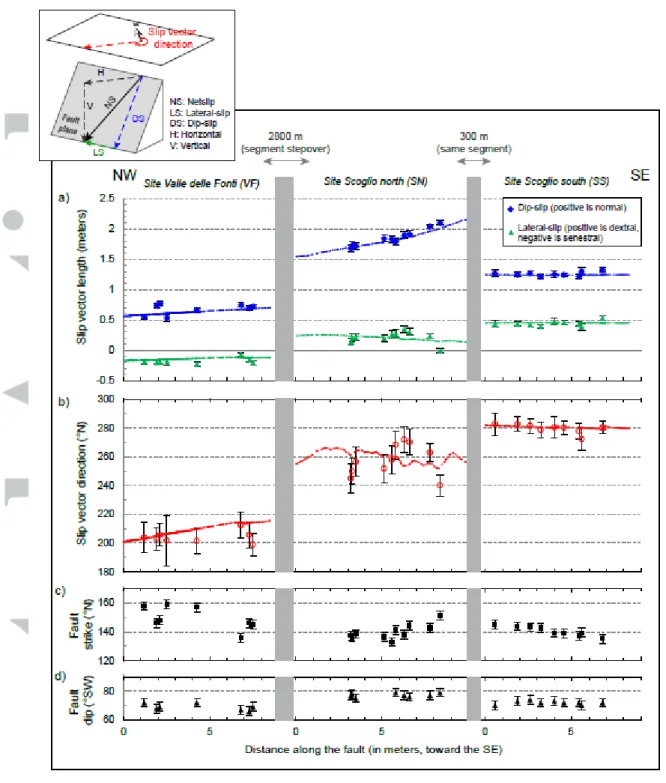
For October 30 event, at each site, along ~ 8m-long fault plane section, we derived 8 to 10 coseismic slip vectors from manual picking marker point, and a continuous array of coseismic slip vectors from the ICP method (Figure 4). The point clouds also allow accurate determination of the fault strike and dip, from which the dip-slip and lateral-slip components of the coseismic slip vectors are determined (inset Figure 4, Table 1). The coseismic slip vectors determined from the two different methodologies (manual marker point picking and ICP method) give similar results that we describe below.
At SS site, the fault plane has an averaged direction of N140º, showing along strike a gradual increase from N135° to N145° toward the NW, and an averaged dip of 70ºSW (Figure 3c and d). At this site, the coseismic ribbon exhibits sharp and well identified limits. This allows coseismic slip vectors to be well constrained with marker points associated with an uncertainty that we estimate of at most 2.5 cm (Table 1). The coseismic slip is constant along strike, with average values of 130 ±4 cm of normal dip-slip, 44 ±4 cm of right-lateral slip, and an average slip vector direction of N280° ±10° (Figure 4a, 4b).
At SN site, the fault plane also follows a N140º average direction, (between N136º and N144º), and with an average dip of 75°SW. At this site, the limit between August 24 and October 30 coseismic ribbon is at most places along the fault blurred by the presence of soil material. This results in larger uncertainties on the markers points location that we estimate to be of at most 4 cm (Supplementary Material Figure S1, Table 1). For October 30 event, the coseismic slip decreases along strike northwestward with an average dip-slip of 184 ±6 cm, (from 210 to 150 cm) and a relative constant right-lateral slip of 22 ±6 cm (Figure 4a). The slip vector direction derived from manual picking and ICP method varies from N240º to N280º with an average value of N260 ±20° (Figure 4b).
Finally, on the site VF, the fault strike changes from N140º to N170º northwestward with a constant dip of 70°SW. The October 30 coseismic ribbon exhibits sharp limits, allowing the identification of markers point with an estimated uncertainty on their location of
at most 2.5 cm (Supplementary Material Figure S2, Table 1). The coseismic slip vector is constant along strike, with 58 ±4 cm of normal dip-slip and 18 ±4 cm of left-lateral slip. The coseismic slip vector direction is on average of N205º ± 10º with a slight decrease toward the SE (from N215° to N200°) (Figure 4b). Note that slip vector direction errors are high at this site because slip vector length are shorter than on the two other sites (Table 1).
For August 24 event, the average coseismic slip at SS site is 16 ± 4cm of normal dip-slip and 3 ± 4cm of right-lateral dip-slip (Table 1) with a dip-slip vector direction of N250º ± 40º. At SN, it is 22 ± 4cm of normal dip-slip, with no lateral component with a slip vector direction of N240º ± 40º. Note that because the vector lengths are small for that event, the uncertainties associated with the slip vector direction are large. It is interesting to note that the maximum coseismic slip displacement for both October 30 and August 24 events is observed at SN site, with an average dip slip of 184 ± 6 cm and 22 ± 4 cm, respectively (Table 1).
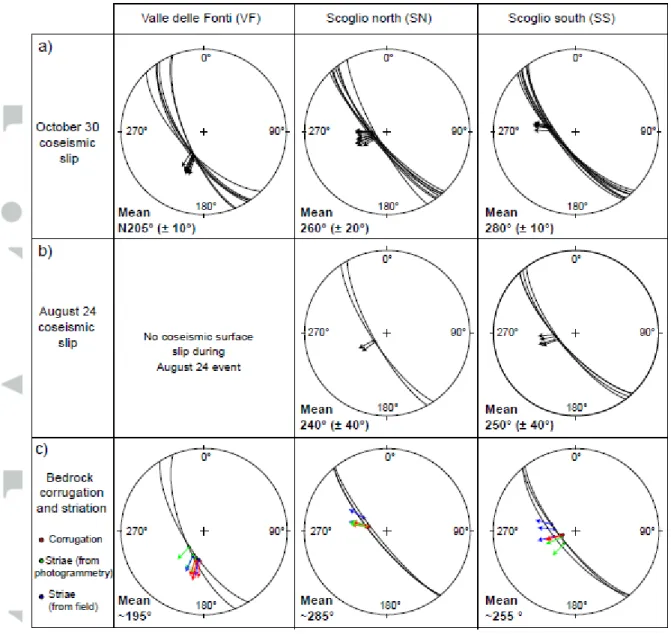
We summarize our results on Figure 5, with stereoplots of all the averaged values of coseismic slip amplitude and direction for October 30 and August 24 events, as well as fault plane data. Those results suggest that October 30 earthquake is associated with oblique normal slip at the three sites with a right-lateral component for the SS and SN sites (slip vectors direction of N280 ±10° for SS and N260 ±20° for SN, Figure 5), and a left-lateral component on the site VF (slip vectors direction of N205º ± 10º, Figure 5). The lateral component appears to be slightly different for August 24 event, with a right-lateral component at the SS site (slip vector direction N250º ± 40º) but a pure normal dip-slip on the SN site (slip vector direction of N240º ± 40º).
3.3 Striation and corrugation
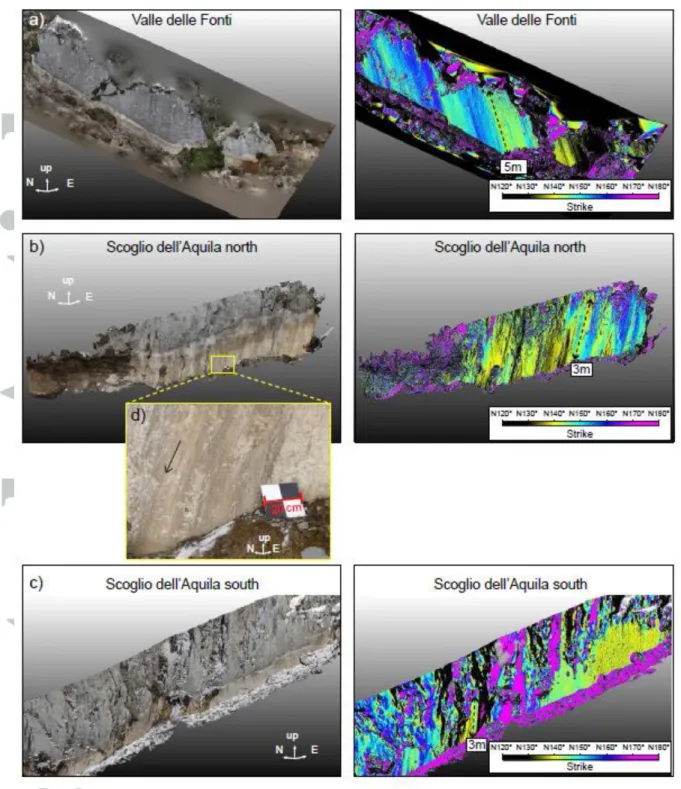
In this section, we analyze millimeter-scale frictional wear striae on bedrock fault plane and meter-scale fault plane corrugations, observed at the three sites. Field measurements (Figure 5c) of linear striations were performed with a regular compass, with an accuracy of ± 2°. Highly polished slickenlined surfaces are very clear on the textural 3D meshes of the point clouds (down to 1 mm resolution, see example on Figure 6d). The bedrock striae were thus digitized from the point clouds as 3D lines, and their direction and plunge were measured (green dots on Figure 5c). Finally, to highlight meter-scale fault plane corrugation, we computed normals on the photogrammetry point clouds and converted these normals to scalar dip direction values (CloudCompare, v2.9.1, 2018). We then subtract 90° from the latter dip direction values to obtain scalar fault plane direction values (Figure 6). Direction
and plunge of the highlighted corrugation axis were measured (purple dots on the Figure 5c and dashed lines on Figure 6).
At SS site, the meter-scale fault plane corrugations are only visible on the northwestern portion of the site, striking ~N255°, with a ~0.5 m wavelength (Figure 5c, 6c). Bedrock striations at this site are scattered, with striae directions varying between N225º and N285º. At SN site, the fault plane corrugations strike ~N285°, with wavelength of 0.75 to 1.25 m, affecting the fault plane over the 3m-high bedrock fault scarp (Figure 5c, 6b), with the corrugation axis and the bedrock striation that are collinear (Figure 5c). At VF site, the fault plane corrugations are very clear from top to bottom of the 5m-high cumulative bedrock fault scarp, striking ~N195° (Figure 5c, 6a), with wavelength that vary between 0.2 and 3.5 m (Figure 6a) and corrugations axis that are collinear with the bedrock fault plane striae (Figure 5c) as at SN.
When comparing the orientation of those longer term kinematic indicators with the geometry of the recent coseismic slip vectors (Figure 5c), the results are identical at all sites within uncertainties. Only at SN, a slight difference in direction between August 24 event slip vectors and bedrock fault plane striation/corrugation is observed which might be due to the large uncertainties associated with August 24 slip vectors.
3.4 Near-field footwall and hangingwall coseismic displacement
On the site SS (Scoglio South, see location on Figure 2b), photogrammetry survey of the fault scarp was made both before and after October 30 earthquake, providing an opportunity to generate a pre- and a post-earthquake georeferenced point cloud of the Mt Vettore fault scarp (Figure 7). From these two pre- and a post-earthquake point clouds, we used the ICP algorithm (Besl & McKay, 1992) to derive 3D coseismic displacement fields for both the footwall and the hangingwall as explicit in section 3.2.1. We use global ICP transformations, as opposed to the windowed approach used in studying several M≥7 earthquakes worldwide (Nissen et al., 2012, 2014; Glennie et al., 2014; Scott et al., 2018). Point clouds processing and ICP implementation were performed here using CloudCompare version 2.9.1, 2018.
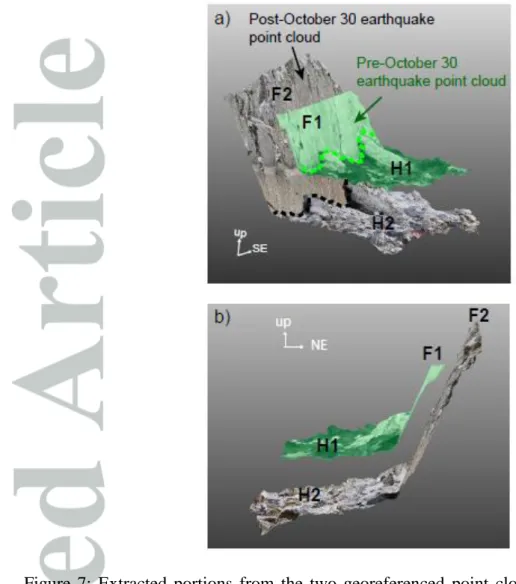
First, we separated from the pre-earthquake point cloud the points belonging to the footwall surface (F1 point cloud, Figure 8a), and the points belonging to the hangingwall surface (H1 point cloud, Figure 8a). We performed the same for the post-earthquake point cloud, by isolating F2 (footwall surface point cloud) and H2 (hangingwall surface point
cloud, Figure 8b).
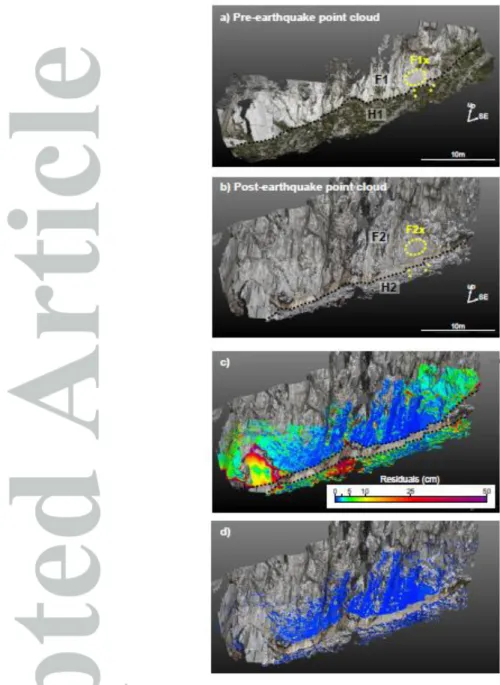
For the footwall, we performed point-to-point ICP between two restricted areas of F1 and F2 that were not affected by block falling during the earthquake (F1x and F2x, respectively, Figure 8a, 8b). The ICP follows the same iterative steps as described in section 3.2.1, the “source” point cloud being F1x and the “target” cloud being F2x. Then we apply the obtained rigid body transformation matrix to the entire F1 point cloud to derive the continuous coseismic displacement field of the footwall (Figure S3). The residuals calculated between the transformed F1 and F2 are shown on Figure 8c and 8d. The match is excellent as most of the residuals are < 1cm (Figure 8d). High residuals (>5 cm) are only observed locally, and coincide with snow banks or fallen blocks (Figure 8c), suggesting that our rigid transformation matrix obtained from ICP corresponds mainly to rigid tectonic displacement.
For the hangingwall, there were important differences between H1 and H2 surfaces (differential snow coverage, many fallen block during the earthquake, see Figure 8a and 8b) that prevented successful applications of the ICP method. We could thus only perform a point cloud alignment between H1 and H2 by pair picking points, manually selecting pair points in the central part of H1 and H2 (Figure 8a, 8b). The obtained rigid transformation matrix (a translation, a rotation, no scaling) is then applied on the entire H1 point cloud to derive the continuous displacement field of the hangingwall (Figure S3). The residuals between the transformed H1 and H2 show that the surface matching is less good than for the footwall, although a significant portion of the residuals is < 1cm (Figure 8d). High residuals (>5 cm) occupy a large zone mostly at the extremity of the site, and are related to the different snow coverage between the two clouds, and the fallen blocks (Figure 8c).
At first order, the yielded displacement field for both the footwall and the hangingwall consist mostly in translation, the amount of rotation being negligible (Supplementary Material Figure S3). To be consistent with our previous results, we considered the displacement values over the zone where coseismic slip vectors have been previously determined (see section 3.2, Figure 3) which is also the area showing the best surface matching from ICP transformation (Figure 8c). In this zone, the displacement values typically vary over a range of no more 4 cm, thus yielding average coseismic displacements with an error of ± 2cm.
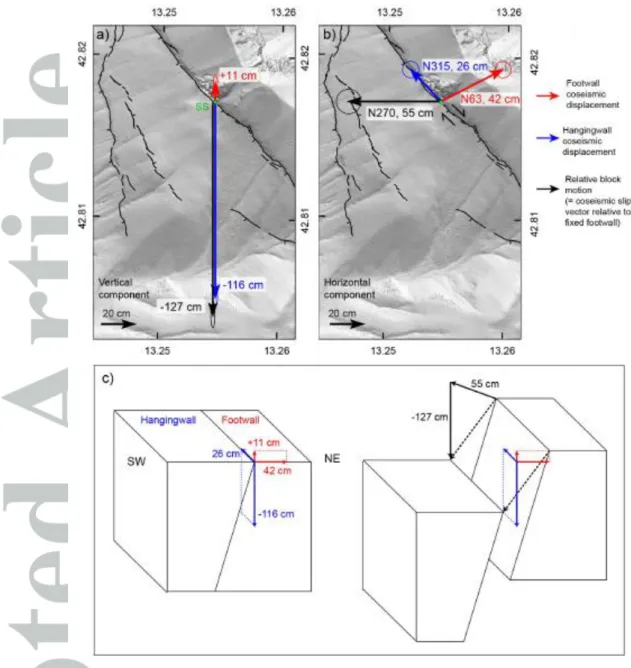
Our results show that during October 30 event, the footwall has been translated horizontally by 42 ± 2 cm toward the NE (azimuth N63° ± 2°) and uplifted 11 ± 2 cm (Figure 9). The hangingwall has moved horizontally by 26 ± 2 cm , in a direction parallel to the fault
plane toward the NW (azimuth N315° ±10°), and vertically downward 116 ± 2 cm. We can calculate the resulting relative block motion by subtracting the two vectors, which corresponds to the coseismic slip vector (Figure 9c). Relative to fixed footwall, we find a coseismic slip vector having an horizontal component of 55 cm toward the west (azimuth N270°) and 127 cm of vertical downward component (black vector on Figure 9). These values are in good agreement with the coseismic slip vector derived from coseismic ribbon exhumation in the previous section at the site SS (Table 1, Figure 5).
4. Results from geodetic benchmarks
Following the August 24 earthquake, we installed eight benchmark points on the footwall and hanging wall of the Monte Vettore fault, near Scoglio dell’ Aquila, Mt Vettoretto and Forca di Presta (Figure 10a, acquisition characteristics and site coordinates are summarized in Supplementary Material, Table S2). The benchmark points are survey nails of 2-cm diameter that have been fixed on stable bedrock on September 14th, 2016, during the field campaign following August 24 event. We decided to install those benchmarks to monitor potential post-seismic effects. Their positions were measured using a GNSS-RTK Trimble R8 device.
When October 30 earthquake occurred, we remeasured their position with the same equipment on November 9th (see section 3.2.1 for details on the base station).
The difference between the position before and after October 30 of those geodetically recorded benchmarks, thus allow calculating the near-field absolute coseismic displacements of the footwall and hangingwall (Supplementary material, Tables S3, S4, S5). Two benchmarks, located about 300 m apart along strike, are placed on the footwall near SS and SN sites, about 50 cm from the fault rupture, and one benchmark on the hanging wall about 100 m away from the fault plane. At Mt Vettoretto, a footwall-hanging wall benchmark points pair is fixed about 50 cm from both side of the fault plane, bwhile an additional benchmark point is fixed on the hanging-wall about 200 m below the fault plane. An additional footwall-hanging wall benchmark points pair is emplaced within less than 30 cm on both side of the fault rupture, in the gully toward Forca di Presta (Figure 10a).
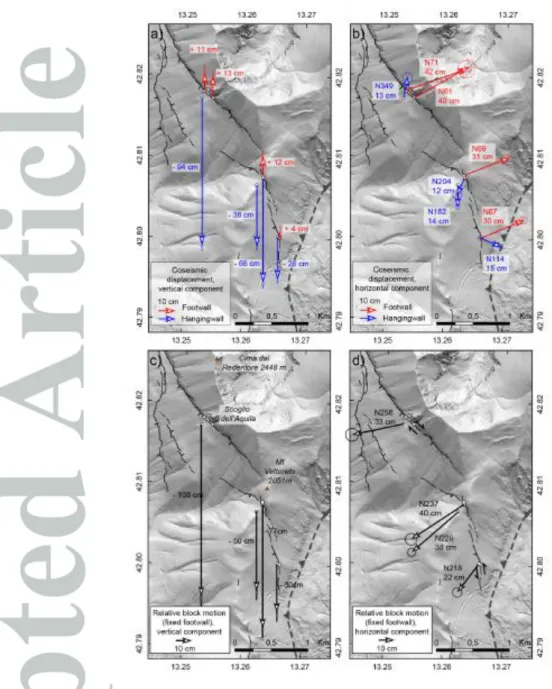
At Scoglio dell’ Aquila, the results indicate that the footwall moved horizontally of ~40 cm toward the NE and vertically of 10-15 cm upward (Figure 10a). These values are in good agreement with the absolute footwall coseismic displacement derived from photogrammetry data (Figure 8 and 9). For the hangingwall, the results show a vertical motion of 94 cm
downward, and an horizontal motion of 13 cm toward NNE. Thus, while for the vertical motion the results are in agreement with the ones derived from photogrammetry, there is a difference in the trend and in the magnitude for the horizontal component of the hangingwall (~25cm toward NW according to the photogrammetry data). This discrepency could be due to the location of the geodetic benchmark for the hangingwall which is ~100m away from the fault scarp, while SfM is performed a few meters away from the fault scarp. Moreover, we cannot rule out the hypothesis of a slight local rotation affecting the geodetic benchmark location particularly the ones located on the hangingwall.
The results obtained at the three sites show a general decrease, southeastward along strike, of the absolute coseismic displacements of the footwall and hangingwall (Figure 10). The vertical component decreases southeastward from 12 to 4 cm for the footwall and from 94 to 26 cm for the hanging wall (Figure 10). The horizontal component, decreases slightly for the footwall from 40 to 30 cm southeastward but with an orientation that remains constant at ~60ºN. The hanging wall horizontal component remains constant with a value of 12-15 cm but with an orientation that varies by more than 90° along strike (Figure 10b).
We can calculate the relative block motion at each site by subtracting the footwall motion to the hangingwall motion (Figure 10c, 10d). When comparing the direction of relative block motion to the direction of fault segments, it appears that slip is normal with a right-lateral component at Scoglio dell’ Aquila, purely dip-slip normal in the Mt Vettoretto, and normal with a left-lateral component near Forca di Presta (Figure 10d).
5. Discussion
Few normal fault sequences in the world have been recorded with detailed description of their associated surface ruptures. In that respect, the 2016 earthquake sequence is remarkable since it occurs at a period of time where high resolution novel tools are available to fully assess the fault kinematic and surface rupture geometry, along with dense geodetic and seismological networks, and the possibility to acquire InSAR and satellite images before and after the events.
The presented results were derived from field campaigns carried out on September 13, 2016, and 7-11 November, 2016. Although we can’t rule out the possibility of a post-seismic contribution on the displacement we record during that time frame, we assume in the following that our data are not significantly affected by post seismic effects and mostly record coseismic deformation (e.g., Cheloni et al., 2017; Wilkinson et al., 2017).
5.1 Coseismic slip vectors and fault geometry: implication for regional
kinematics
Our work focused on the high resolution data of the surface rupture associated with August 24 and October 30 events. The combined approaches yield concordant results summarized in Figure 11. At the five study sites between Forca di Presta and Valle delle Fonti, the slip vectors obtained for October 30 event suggest that the slip is oblique to the fault direction, with left-lateral component on N170° oriented faults and right-lateral component on N140° striking fault. Similarly, Pucci et al. (2017) observed right-lateral
en-echelon on N130°-140° striking fault strands near Mt Vettoretto following the August 24
event.
The overall fault geometry on this ~ 6 km-long area and our determined oblique normal coseismic slip vectors are mechanically compatible with an extensional tectonic regime characterized by a N65° ±15° trending σ3 axis (Figure 11). This stress regime is also compatible with the October 30 focal mechanism solution (fault plane N150° 45°SW with a N245°-oriented T-axis, http://cnt.rm.ingv.it/; Figure 11). Our model would also account for the ~ N170° striking surface rupture at Mt Porche arranged in a left lateral en-echelon pattern. Interestingly, previous kinematic studies performed in the area (e.g., Brozzetti & Lavecchia, 1994; Cello et al., 1997; Boncio et al., 2000; Ferrarini et al., 2015) also concluded that faults between Colfiorito and L’Aquila are in a state of stress oblique to their main direction with right-lateral component on more E-W striking faults and left-lateral component of more N-S striking fault, also consistent with an extension at N50°±15°. Ferrarini et al. (2015), in particular, compared the stress fields derived from 1997 Colfiorito earthquake focal mechanisms and the geological slip indicators. They found consistent stress field suggesting the persistence of a constant NE directed extension in the Umbria-Marche region, at least since the Early Quaternary. The N72°-oriented T-axis of the 1979 Norcia earthquake focal mechanism (Ms=5.9) is also consistent with our model (Deschamps et al., 1984). Finally, a state of stress with σ3 at N65° (±15)° is consistent with the regional ~N60° directed extension in Central Apennines, related to the relative motion between of the Adriatic microplate and the Tyrrhenian coastal region (D’Agostino et al., 2011; D’Agostino, 2014; Devoti et al., 2017) inset Figure 1. All those observations thus suggest that the surface ruptures observed along the Mt Vettore-Bove fault system after the October 30 earthquake are kinematically coherent with the seismic slip generated at depth at the hypocenter (Figure 11). The change of fault plane dip between the surface rupture (65ºW to 80ºW, see Table 1)
and the rupture at nucleation depth (50ºW ±5º, at 7-8 km depth, Chiaraluce et al., 2017) would imply a slight bending of the fault plane. Further data would however be necessary to clearly image the structural link between surface and depth, beyond the scope of the present study. The driving source for this crustal extension could be the motion of the Adriatic microplate relative to the Tyrrhenian coastal region, compatible with an extensional tectonic regime characterized by a N65 (±15)° trending σ3 axis.
The geometry observed with small fault strands of variable strikes resembles the geometry observed at fault propagating tip (Perrin et al., 2016; Nicol et al., 2017) and could thus suggest northward propagation of the Mt Gorzano fault system in agreement with the conclusions from Pizzi et al. (2017). The intersegment zone that we define as the distance between the two faults tips (the Mt Gorzano and the Mt Vettore) is 2-5-km-long and coincides with the location of the pre-existing OAS thrust (Figure 11). The presence of the OAS thrust oblique ramp, striking oblique to the main faults might potentially play a key role in guiding the rupture on pre-existing already fractured medium, as it has been observed in numerical models or in relay zone (Klinger, 2010) and already invoked in central Apennines to explain the position of the most recent faults in the relief (Winter & Tapponnier, 1991). In addition, activation of the ~N30° directed OAS thrust ramp at depth during October 30 event has been proposed based on inversion of geodetic data only (Cheloni et al., 2017) or joint invertion of seismograms and coseismic GPS displacements (Scognamiglio et al. 2018). Their derived slip vector on this ~N30° directed dislocation, is a normal slip with left-lateral component, which is also compatible with our determined surface slip vectors (Figure 11).
The good consistency between the kinematics derived from August 24, October 30, and longer term slip indicators (Figure 5) suggest there has been no major change in this state of stress over at least the last 10-20 ka, as suggested in previous studies (e.g., Ferrarini et al., 2015).
5.2 Coseismic slip and rupture extent, comparison with seismological and
InSAR rupture models, and with scaling relationships
From our study, we note that the maximum surface coseismic slip displacement for both October 30 and August 24 events is observed along the Mt Vettore fault, at SN site, with an average dip slip of 184 ± 6 cm and 22 ± 4 cm, respectively (Figure 2b, Figure 4, Table 1). For October 30 event, Villani et al. (2018) further constrain that the average coseismic throw derived from all the mapped ruptures is ∼0.3 m, with more than 2 km of these ruptures
displaying >1 m average throw, and a local maxima reaching up to ∼2.4–2.6 m along the main Mt Vettore fault scarp. The distribution and the magnitude of the coseismic slip at depth have been quantified in rupture models both for August 24 and October 30 events, inverted from strong-motion data (Chiaraluce et al., 2017) and InSAR and GPS data (Tinti et al., 2016; Cheloni et al., 2017; Pizzi et al., 2017; Tung & Masterlark, 2018). All those models converge towards a similar scenario: August 24 event involved a bilateral rupture characterized by two main rupturing patches, associated with peak of slip of at most 1 m on the northern portion of the 50°SW-dipping Mt Gorzano fault and on the southern segments of the 40°SW-dipping Mt Vettore fault, both segments possibly merging into a single fault plane at about 4-6 km depth. For October 30, those authors evidence a high slip patch on a N150° striking, 50°SW dipping fault plane, at 6-8 km depth, with maximum slip of ~2.5 m. It is striking that average and maximum slip observed at the surface along the main Mt. Vettore fault for October 30 event (Dmean ≈ 1m and Dmax ≈ 2.5m, Villani et al., 2018) are very
similar to the ones derived at depth (Dmean ≈ 1.3m and Dmax ≈ 2.6m, values synthesized from
Cheloni et al., 2017; Chiaraluce et al., 2017). This is not the case for the August 24 event where surface coseismic slip are estimated at Dmean ≈ 0.1m and Dmax ≈ 0.3m (coseismic throw
measured on the field, e.g., Pucci et al., 2017) while rupture models suggest at depth Dmean ≈
0.5m and Dmax ≈ 1.4m (Cheloni et al., 2017; Chiaraluce et al., 2017).
Concerning surface rupture length, recent empirical earthquake source-scaling relationships based on a large database of rupture models (including 29 rupture models for normal faulting events, Thingbaijam et al. (2017) suggest that a Mw 6.5 earthquake would produce a rupture length L ~27 km. The Mw 6.5 October 30 event fits well with the predicted L according to both surface ruptures extend (~25 km-long distance, Figure 2a, Villani et al. 2017, 2018; Civico et al. 2018) and rupture models inverted from strong-motion and geodetic data (20 to 27 km fault plane length, (Cheloni et al., 2017; Chiaraluce et al., 2017; Pizzi et al., 2017). Thingbaijam et al., (2017) predict a rupture length L~15km for a Mw 6.0 earthquake. Rupture models for Mw 6.0 August 24 event involve 20-25 km of fault plane length (Cheloni et al., 2017; Chiaraluce et al., 2017), suggesting a larger-than-average length/Mw ratio for this earthquake. Finally, the surface rupture extend for August 24 event is only ~ 5km long (Pucci et al., 2017). Thus, for the August 24 event, the surface rupture represented less than 20% of its total length (5 km at surface Vs. 25 km at depth), while for October 30 event the surface rupture represented more than 80% of the total length estimated from seismic data (20-25 km at the surface, 20-25 km at depth).
Others normal faults earthquakes show such difference, for example the surface rupture associated with the 1986 Kalamata earthquake although of lower magnitude (Ms=5.8, Lyon-Caen et al., 1988) also covered 2/3 of the aftershocks zone length, while on the contrary for the 1980 Irpinia earthquake (Ms=6.9), with a magnitude above the October 30 event, the rupture reached sporadically the surface representing less than 20% of its total length (e.g., Bernard & Zollo, 1989). In the case of the October 30 earthquake, the vertical extent of the rupture ought to be limited by a decollement plane clearly outlined by the aftershocks at 8 km depth (Chiaraluce et al., 2017). Consequently, the dimensions of the rupture plane along strike and dip had an aspect ratio > 1 which might explain the large slip per unit length. This geological structure at depth thus might have strongly influence the rupture propagation at the surface, impeding the vertical rupture propagation at depth and thus triggering a wide zone of strain energy released at the surface.
5.3 Fault dislocation from near-field to far-field data
Near field coseismic displacement for October 30 event from photogrammetry and geodetic benchmarks yield similar results: the footwall has been translated horizontally by 42 ± 2 cm toward the ENE (azimuth N63° ± 2°) and uplifted 11 ± 2 cm. The hangingwall has moved horizontally by 26 ± 2 cm, in a direction parallel to the fault plane toward the NW (azimuth N315° ±10°), and vertically downward 116 ± 2 cm. In Figure 12, we compare our results with far-field coseismic displacements measured by GPS stations after October 30 event (Cheloni et al., 2017), and the data from (De Guidi et al., 2017) that installed a GNSS network after August 24 event. Our near-field displacement is remarkably consistent with the far field footwall motion measured on those others stations, both for the vertical and horizontal components (Figure 12). In particular, the horizontal motion of the footwall toward the ENE is similarly observed in near-field (our data) and far-field domain (permanent GPS stations) (Figure 12). Moreover, this ENE directed motion of the footwall is oriented perpendicularly opposite to the main slope direction. These observations suggest the occurrence of a regional scale crustal motion for the footwall, which would imply tectonic forcing. In the hangingwall, horizontal displacements have a general uniform trend toward the WSW in far-field domain, and become more differentiated near-field of the Mt Vettore fault. This might be due to the presence of conjugated faults and to the fault geometry near the Mt Vettore, as previously highlighted and described in previous section (see Figure 11).
The profile displaying the vertical components across Scoglio site shows that the near field results yielded from our geodetic benchmarks can be extrapolated to the southwestward GPS stations (Figure 12). This profile shows predominance of subsidence with a ~ 1:10 ratio between footwall uplift and hangingwall subsidence. This is very similar to what has been observed for coseismic displacements on normal faults in the Basin and Range (Thompson & Parsons, 2016). Another important observation is that the most important displacement is accommodated on the main Mt Vettore fault producing a wide subsidence area that comprises the entire Castelluccio plain-Norcia basin zone (~15km wide zone, Figure 12c). The antithetic fault outlined by aftershocks data (Chiaraluce et al., 2017) and input in various interpretative models derived from InSAR data e.g., (Cheloni et al., 2017), is however not detectable in this profile. The absolute displacement associated with the smaller faults located on the hanging wall and disrupting the Mt Vettore flank were not measured since we did not place benchmarks on those. However, the relative displacement during October 30 event was measured (i.e., coseismic throw, Villani et al., 2017, 2018; Civico et al., 2018, Figure 2a, 2b), and we displayed those values on Figure 12d. Even considering the observed offsets on the faults as subsidence, the amount of displacement is still smaller compared to the motion accommodated on the main Mt Vettore fault at Scoglio site. We also cannot rule out the possibility that some proportion of the displacement on those smaller segments might be affected by gravitational effects, those being on the slope of the Mt Vettore.
This profile thus suggests a normal faulting dislocation profile associated with the SW dipping Mt Vettore fault as the master fault.
6. Conclusions
Our photogrammetry surveys, carried out after both August 24 and October 30 earthquakes (Mw=6.0 and Mw=6.5 respectively) at various sites in the Mt Vettore fault system (central Italy), provide an exceptional dataset of georeferenced point clouds of bedrock fault scarp before/after the earthquakes.
The results yielded from those surveys and from benchmarks points remeasured after October 30 event suggest that both August 24 and October 30 earthquake are associated with oblique normal slip on the 6-km-long studied portion between Forca di Presta and Valle delle Fonti. The coseismic slip vectors, and the meter-scale corrugation axis have directions of (1) N280° ±10° on the N140° striking main Vettore fault, involving normal slip with a
right-lateral component; and (2) N205° ±10° on the N170° fault strands, involving normal slip with a left-lateral component (Figure 5). The maximum coseismic displacement is observed on the Scoglio dell ’Aquila sites for both October 30 and August 24 events with an average dip slip of 184 ± 6 cm and 22 ± 4 cm, respectively (Figure 4, Table 1). During October 30 event, the footwall has been translated horizontally by 42 ± 2 cm toward the ENE (azimuth N63° ± 2°) and uplifted 11 ± 2 cm. The hangingwall has moved horizontally by 26 ± 2 cm, in a direction parallel to the fault plane toward the NW (azimuth N315° ±10°), and vertically downward 116 ± 2 cm (Figure 9, 10). There is a general decrease, south-eastward along strike, of the absolute coseismic displacements of the footwall and hangingwall.
The overall fault geometry observed on this ≈ 6 km-long area and our determined surface oblique normal coseismic slip vectors are mechanically compatible with an extensional tectonic regime characterized by a N65° ±15° trending σ3 axis (Figure 11). This stress regime is also compatible with the the T-axis of the October 30 fault plane solution (Figure 11, http://cnt.rm.ingv.it/) and with the regional ~N60° directed extension in Central Apennines, related to the relative motion between the Adriatic microplate and the Tyrrhenian coastal region (D’Agostino, 2014; D’Agostino et al., 2011, Devoti at al. 2017, inset Figure 1). The amount of coseismic slip at depth, derived from the October 30 rupture model, inverted from strong-motion data (Chiaraluce et al., 2017) and geodetic data (Tinti et al., 2016; Cheloni et al., 2017; Pizzi et al., 2017; Tung et al., 2018) is comparable in magnitude with our derived values of surface coseismic displacements. Moreover, the near field results yielded from our geodetic benchmarks are in agreement and can be extrapolated to the south-westward far field GPS permanent stations showing the predominance of subsidence between the footwall and the hangingwall, coherent with a normal faulting dislocation profile (Figure 12). Both near-field (our study) and far-field GPS data (Cheloni et al., 2017; De Guidi et al., 2017) show that the footwall of the SW° dipping Mt Vettore normal fault moved horizontally toward the ENE during October 30 (Figure 12), suggesting a regional scale crustal motion.
All together, our results strongly suggest that October 30 surface rupture is the surface expression of seismic slip at depth, and has thus a tectonic origin. It would be interesting to study whether the location of the aftershocks and background seismicity are related to the amount of oblique slip, accommodating a potential deficit of deformation.
Acknowledgments
Our work has been funded by special INSU/CNRS funding dedicated to post-seismic intervention, and by financial support from CEREGE, IPGP, EOST and the RISKMED project from the LABEX OT MED. We warmly thank the members of the INSU post-seismic intervention committee for supporting our initiative to go in the field immediately after the August event providing us the opportunity to acquire the presented dataset. CNES is warmly acknowledged from providing us with the Pléaides satellite images immediately after the events and in particular ISIS and CEOS_seismic pilot (ESA) programs. This work was supported by public funds received in the framework of GEOSUD, a project (ANR-10-EQPX-20) of the program "Investissements d'Avenir" managed by the French National Research Agency". S.Baize, O. Scooti, H. Jomard from IRSN and F. Leclerc from GeoAzur are greatly acknowledged for their help and support in the field and in particular in providing their expertise for surface ruptures mapping. The colleagues from LIVE (J.P. Malet, P. Borneman, O. Marc), EOST (J. Point) and M. Ferry (Geosciences Montpellier) are warmly acknowledged for their collaboration in the field. We thank E. Paquier from CEREGE for her precious help in processing and modeling the photogrammetry data. We are very grateful to the staff and colleagues at INGV who helped us in the field and provided us with the necessary paperwork to work in the area, particularly to S.Pucci, F. Villani, C. Merletti, R. Civico. We are also very thankful to A. Valentini and other colleagues from Chieti-Pescara University who helped us carry the heavy material during the field campaign. Contains informations © CNES (2016), Distribution Airbus DS, all rights reserved. The acquired SfM data are archived in this repository https://tls.unavco.org/projects/U-067/.
References
Bemis, S. P., Micklethwaite, S., Turner, D., James, M. R., Akciz, S., Thiele, S. T., &
Bangash, H. A. (2014). Ground-based and UAV-based photogrammetry: A
multi-scale, high-resolution mapping tool for structural geology and paleoseismology.
Journal of Structural Geology, 69, 163–178.
Benedetti, L. (1999). Sismotectonique de l’Italie et des régions adjacentes: fragmentation du
Bernard, P., & Zollo, A. (1989). The Irpinia (Italy) 1980 earthquake: detailed analysis of a
complex normal faulting. Journal of Geophysical Research: Solid Earth, 94(B2),
1631–1647.
Besl, P. J., & McKay, N. D. (1992). Method for registration of 3-D shapes (Vol. 1611, pp.
586–607). Presented at the Sensor Fusion IV: Control Paradigms and Data Structures,
International Society for Optics and Photonics.
Billant, J., Bellier, O., Godard, V., & Hippolyte, J.-C. (2016). Constraining recent fault
offsets with statistical and geometrical methods: Example from the Jasneuf fault
(Western Alps, France). Tectonophysics, 693, 1–21.
Boncio, P., Brozzetti, F., & Lavecchia, G. (2000). Architecture and seismotectonics of a
regional low‐angle normal fault zone in central Italy. Tectonics, 19(6), 1038–1055. Boncio, P., Galli, P., Naso, G., & Pizzi, A. (2012). Zoning Surface Rupture Hazard along
Normal Faults: Insight from the 2009 M w 6.3 L’Aquila, Central Italy, Earthquake and Other Global Earthquakes. Bulletin of the Seismological Society of America,
102(3), 918–935.
Brozzetti, F., & Lavecchia, G. (1994). Seismicity and related extensional stress field: the case
of the Norcia Seismic Zone (Central Italy) (Vol. 8, pp. 36–57). Presented at the
Annales tectonicae.
Calamita, F., Satolli, S., Scisciani, V., Esestime, P., & Pace, P. (2011). Contrasting styles of
fault reactivation in curved orogenic belts: Examples from the Central Apennines
(Italy). Bulletin, 123(5–6), 1097–1111.
Caskey, S., Wesnousky, S., Zhang, P., & Slemmons, D. (1996). Surface faulting of the 1954
Fairview Peak (MS 7.2) and Dixie Valley (MS 6.8) earthquakes, central Nevada.
Cello, G., Mazzoli, S., Tondi, E., & Turco, E. (1997). Active tectonics in the central
Apennines and possible implications for seismic hazard analysis in peninsular Italy.
Tectonophysics, 272(1), 43–68.
Cheloni, D., De Novellis, V., Albano, M., Antonioli, A., Anzidei, M., Atzori, S., et al. (2017).
Geodetic model of the 2016 Central Italy earthquake sequence inferred from InSAR
and GPS data. Geophysical Research Letters, 44(13), 6778–6787.
Chiaraluce, L., Di Stefano, R., Tinti, E., Scognamiglio, L., Michele, M., Casarotti, E., et al.
(2017). The 2016 central Italy seismic sequence: A first look at the mainshocks,
aftershocks, and source models. Seismological Research Letters, 88(3), 757–771.
Civico, R., Pucci, S., Villani, F., Pizzimenti, L., De Martini, P. M., & Nappi, R. (2018).
Surface ruptures following the 30 October 2016 Mw 6.5 Norcia earthquake, central
Italy. Journal of Maps, 14(2), 151–160.
D’Agostino, N. (2014). Complete seismic release of tectonic strain and earthquake recurrence in the Apennines (Italy). Geophysical Research Letters, 41(4), 1155–1162.
D’Agostino, Nicola, Mantenuto, S., D’Anastasio, E., Giuliani, R., Mattone, M., Calcaterra, S., et al. (2011). Evidence for localized active extension in the central Apennines
(Italy) from global positioning system observations. Geology, 39(4), 291–294.
De Guidi, G., Vecchio, A., Brighenti, F., Caputo, R., Carnemolla, F., Di Pietro, A., et al.
(2017). Brief communication: Co-seismic displacement on 26 and 30 October 2016
(M w= 5.9 and 6.5)–earthquakes in central Italy from the analysis of a local GNSS
network. Natural Hazards and Earth System Sciences, 17(11), 1885.
DeLong, S. B., Lienkaemper, J. J., Pickering, A. J., & Avdievitch, N. N. (2015). Rates and
patterns of surface deformation from laser scanning following the South Napa
Deschamps, A., Iannaccone, G., & Scarpa, R. (1984). The umbrian earthquake (Italy) of 19
september 1979. Ann. Geophys, 2(1), 29–36.
Devoti, R., D’Agostino, N., Serpelloni, E., Pietrantonio, G., Riguzzi, F., Avallone, A., et al. (2017). A combined velocity field of the Mediterranean region. Annals of Geophysics,
60(2), 0215.
Di Domenica, A., Bonini, L., Calamita, F., Toscani, G., Galuppo, C., & Seno, S. (2014).
Analogue modeling of positive inversion tectonics along differently oriented
pre-thrusting normal faults: An application to the Central-Northern Apennines of Italy.
Bulletin, 126(7–8), 943–955.
Dziewonski, A., Chou, T., & Woodhouse, J. (1981). Determination of earthquake source
parameters from waveform data for studies of global and regional seismicity. Journal
of Geophysical Research: Solid Earth, 86(B4), 2825–2852.
Ekström, G., Nettles, M., & Dziewoński, A. (2012). The global CMT project 2004–2010: Centroid-moment tensors for 13,017 earthquakes. Physics of the Earth and Planetary
Interiors, 200, 1–9.
Escartín, J., Leclerc, F., Olive, J.-A., Mevel, C., Cannat, M., Petersen, S., et al. (2016). First
direct observation of coseismic slip and seafloor rupture along a submarine normal
fault and implications for fault slip history. Earth and Planetary Science Letters, 450,
96–107.
Ferrarini, F., Lavecchia, G., de Nardis, R., & Brozzetti, F. (2015). Fault geometry and active
stress from earthquakes and field geology data analysis: the Colfiorito 1997 and
L’Aquila 2009 Cases (Central Italy). Pure and Applied Geophysics, 172(5), 1079– 1103.
Field, E. H., Biasi, G. P., Bird, P., Dawson, T. E., Felzer, K. R., Jackson, D. D., et al. (2015).
Rupture Forecast (UCERF3). Bulletin of the Seismological Society of America,
105(2A), 511–543.
Glennie, C. L., Hinojosa‐Corona, A., Nissen, E., Kusari, A., Oskin, M. E., Arrowsmith, J. R., & Borsa, A. (2014). Optimization of legacy lidar data sets for measuring near‐field earthquake displacements. Geophysical Research Letters, 41(10), 3494–3501.
Gold, P. O., Oskin, M. E., Elliott, A. J., Hinojosa-Corona, A., Taylor, M. H., Kreylos, O., &
Cowgill, E. (2013). Coseismic slip variation assessed from terrestrial LiDAR scans of
the El Mayor–Cucapah surface rupture. Earth and Planetary Science Letters, 366,
151–162.
Jackson, J., Gagnepain, J., Houseman, G., King, G., Papadimitriou, P., Soufleris, C., &
Virieux, J. (1982). Seismicity, normal faulting, and the geomorphological
development of the Gulf of Corinth (Greece): the Corinth earthquakes of February
and March 1981. Earth and Planetary Science Letters, 57(2), 377–397.
James, M., & Robson, S. (2012). Straightforward reconstruction of 3D surfaces and
topography with a camera: Accuracy and geoscience application. Journal of
Geophysical Research: Earth Surface, 117(F3).
Johnson, K., Nissen, E., Saripalli, S., Arrowsmith, J. R., McGarey, P., Scharer, K., et al.
(2014). Rapid mapping of ultrafine fault zone topography with structure from motion.
Geosphere, 10(5), 969–986.
Klinger, Y. (2010). Relation between continental strike‐slip earthquake segmentation and thickness of the crust. Journal of Geophysical Research: Solid Earth, 115(B7).
Lucieer, A., Jong, S. M. de, & Turner, D. (2014). Mapping landslide displacements using
Structure from Motion (SfM) and image correlation of multi-temporal UAV
Lyon‐Caen, H. et al, Armijo, R., Drakopoulos, J., Baskoutass, J., Delibassis, N., Gaulon, R., et al. (1988). The 1986 Kalamata (South Peloponnesus) earthquake: Detailed study of
a normal fault, evidences for east‐west extension in the Hellenic Arc. Journal of
Geophysical Research: Solid Earth, 93(B12), 14967–15000.
Mai, P. M., & Beroza, G. C. (2000). Source scaling properties from finite-fault-rupture
models. Bulletin of the Seismological Society of America, 90(3), 604–615.
Nicol, A., Childs, C., Walsh, J., Manzocchi, T., & Schöpfer, M. (2017). Interactions and
growth of faults in an outcrop-scale system. Geological Society, London, Special
Publications, 439(1), 23–39.
Nissen, E., Krishnan, A. K., Arrowsmith, J. R., & Saripalli, S. (2012). Three‐dimensional surface displacements and rotations from differencing pre‐and post‐earthquake LiDAR point clouds. Geophysical Research Letters, 39(16).
Nissen, E., Maruyama, T., Arrowsmith, J. R., Elliott, J. R., Krishnan, A. K., Oskin, M. E., &
Saripalli, S. (2014). Coseismic fault zone deformation revealed with differential lidar:
Examples from Japanese Mw∼ 7 intraplate earthquakes. Earth and Planetary Science
Letters, 405, 244–256.
Pantosti, D., Schwartz, D. P., & Valensise, G. (1993). Paleoseismology along the 1980
surface rupture of the Irpinia fault: implications for earthquake recurrence in the
southern Apennines, Italy. Journal of Geophysical Research: Solid Earth, 98(B4),
6561–6577.
Perrin, C., Manighetti, I., & Gaudemer, Y. (2016). Off-fault tip splay networks: A genetic
and generic property of faults indicative of their long-term propagation. Comptes
Peruzza, L., Pace, B., & Visini, F. (2011). Fault-Based Earthquake Rupture Forecast in
Central Italy: Remarks after the L’Aquila M w 6.3 Event. Bulletin of the
Seismological Society of America, 101(1), 404–412.
Pizzi, A., Di Domenica, A., Gallovič, F., Luzi, L., & Puglia, R. (2017). Fault segmentation as constraint to the occurrence of the main shocks of the 2016 Central Italy seismic
sequence. Tectonics, 36(11), 2370–2387.
Pucci, S., De Martini, P. M., Civico, R., Villani, F., Nappi, R., Ricci, T., et al. (2017).
Coseismic ruptures of the 24 August 2016, Mw 6.0 Amatrice earthquake (central
Italy). Geophysical Research Letters, 44(5), 2138–2147.
Rosu, A. M., Pierrot-Deseilligny, M., Delorme, A., Binet, R., & Klinger, Y. (2015).
Measurement of ground displacement from optical satellite image correlation using
the free open-source software MicMac. ISPRS Journal of Photogrammetry and
RemoteSensing, 100,48-59.
Rovida, A. N., Locati, M., Camassi, R. D., Lolli, B., & Gasperini, P. (2016). CPTI15, the
2015 version of the Parametric Catalogue of Italian Earthquakes.
Scognamiglio, L., Tinti, E., Casarotti, E., Pucci, S., Villani, F., Cocco, M., et al., (2018).
Complex fault geometry and rupture dynamics of the Mw 6.5, 2016, October 30th
central Italy earthquake. Journal of Geophysical Research: Solid Earth.
Scott, C. P., Arrowsmith, J. R., Nissen, E., Lajoie, L., Maruyama, T., & Chiba, T. (2018). The
M7 2016 Kumamoto, Japan, Earthquake: 3D deformation along the fault and within
damage zone constrained from differential lidar topography. Journal of Geophysical
Shervais, K. A., & Kirkpatrick, J. D. (2016). Smoothing and re-roughening processes: The
geometric evolution of a single fault zone. Journal of Structural Geology, 91,
130-143.
Taylor, J. (1997). Introduction to error analysis, the study of uncertainties in physical
measurements.
Tesson, J., Pace, B., Benedetti, L., Visini, F., Delli Rocioli, M., Arnold, M., et al. (2016).
Seismic slip history of the Pizzalto fault (central Apennines, Italy) using in situ‐ produced 36Cl cosmic ray exposure dating and rare earth element concentrations.
Journal of Geophysical Research: Solid Earth, 121(3), 1983–2003.
Thingbaijam, K. K. S., Martin Mai, P., & Goda, K. (2017). New Empirical Earthquake
Source‐Scaling Laws. Bulletin of the Seismological Society of America, 107(5), 2225– 2246.
Thompson, G. A., & Parsons, T. (2016). Vertical deformation associated with normal fault
systems evolved over coseismic, postseismic, and multiseismic periods. Journal of
Geophysical Research: Solid Earth, 121(3), 2153–2173.
Tinti, E., Scognamiglio, L., Michelini, A., & Cocco, M. (2016). Slip heterogeneity and
directivity of the ML 6.0, 2016, Amatrice earthquake estimated with rapid finite‐fault inversion. Geophysical Research Letters, 43(20).
Tung, S., & Masterlark, T. (2018). Resolving Source Geometry of the 24 August 2016
Amatrice, Central Italy, Earthquake from InSAR Data and 3D Finite‐Element Modeling. Bulletin of the Seismological Society of America.
Valensise, G., Vannoli, P., Basili, R., Bonini, L., Burrato, P., Carafa, M. M. C.,et al., (2016).
Fossil landscapes and youthful seismogenic sources in the central Apennines: excerpts
from the 24 August 2016, Amatrice earthquake and seismic hazard implications.