HAL Id: hal-02484643
https://hal.archives-ouvertes.fr/hal-02484643
Submitted on 19 Feb 2020
HAL is a multi-disciplinary open access
archive for the deposit and dissemination of
sci-entific research documents, whether they are
pub-lished or not. The documents may come from
teaching and research institutions in France or
abroad, or from public or private research centers.
L’archive ouverte pluridisciplinaire HAL, est
destinée au dépôt et à la diffusion de documents
scientifiques de niveau recherche, publiés ou non,
émanant des établissements d’enseignement et de
recherche français ou étrangers, des laboratoires
publics ou privés.
Experiment
Yves Guglielmi, Christophe Nussbaum, Pierre Jeanne, Jonny Rutqvist,
Frédéric Cappa, Jens Birkholzer
To cite this version:
Yves Guglielmi, Christophe Nussbaum, Pierre Jeanne, Jonny Rutqvist, Frédéric Cappa, et al..
Com-plexity of Fault Rupture and Fluid Leakage in Shale: Insights From a Controlled Fault Activation
Experiment. Journal of Geophysical Research : Solid Earth, American Geophysical Union, 2020, 125
(2), pp.e2019JB017781. �10.1029/2019JB017781�. �hal-02484643�
Activation Experiment
Yves Guglielmi1 , Christophe Nussbaum2, Pierre Jeanne1 , Jonny Rutqvist1 , Frédéric Cappa3,4 , and Jens Birkholzer1
1Lawrence Berkeley National Laboratory, Energy Geosciences Division, Berkeley, CA, USA,2Federal Office of
Topography, Swisstopo, Wabern, Switzerland,3Université Côte d'Azur, CNRS, Observatoire de la Côte d'Azur, IRD,
Géoazur, Nice, France,4Institut Universitaire de France, Paris, France
Abstract
We observed rupture growth caused by controlledfluid injections at 340‐m depth within a fault zone in the low‐permeability Opalinus Clay in the Mont Terri Underground Research Laboratory(Switzerland). The rupture mechanisms were evaluated using measurements of the three‐component borehole wall displacements andfluid pressure in two sections of the fault zone and located horizontally 3 m apart from each other. One section was set across a secondary segment of the fault and used for stepwise fluid injection intended to trigger rupture growth. The other section was set across the principal shear zone of the fault for monitoring. After stepwise pressure increase up to 5.95 MPa at injection, rupture initiated as slip activation, followed by an overall opening of the fault planes connected to the injection. After 19 s of continued injection, displacements arrived at the monitoring point on the principal shear zone. These displacements are about 2.4 times larger than in the secondary fault segment. Overall, the displacements corresponded to a normal fault activation. About 9 s after the displacement front arrived, a strong pressure increase of 4.17 MPa was measured at the monitoring point, indicating a hydraulic connection had formed along the initially very low permeability fault planes between the injection and the monitoring points. Our analyses highlight that the fault activation is consistent with the state of stress but that injection pressure must be close to the normal stress acting on the fault for permeability to be generated and forfluid leakage to occur.
1. Introduction
Injection offluids into the subsurface can generate large overpressures perturbing the long‐term stresses stored in rocks, which could potentially induce seismicity and leakage along preexisting faults (Ellsworth, 2013; Raleigh et al., 1976; Savage et al., 2017). Generally, the stability of a fault and the related reactivation mechanisms are estimated using the theory of elastoplasticity, considering a Mohr‐Coulomb rupture criter-ion and the conditcriter-ions of plastic strain localizatcriter-ion in the fault gouge (Rice, 1976). When applying this cri-terion, the stress state relative to the frictional strength limit is considered as the dominant factor of fault reactivation byfluid injection.
The common assumption is that faults critically oriented for shear reactivation are expected to be the most permeable (Barton et al., 1995). The faults are considered“critically stressed” when stresses calculated nor-mal and tangential to their surface given the in situ stressfield place them close to instability according to the Mohr‐Coulomb rupture criterion. However, in many cases it appears that the relationship between the “cri-tical stress” state of faults and their permeability is not straightforward (Evans, 2005; Matilla & Tammisto, 2012), and laboratory experiments have shown thatfluid flow can occur in faults of any orientation (Cuss et al., 2015). In detail, Cuss et al. (2015) found that injected gas may enter a fault gouge zone both as a func-tion of stress acting on the fault surface, and as a result of slight deformafunc-tions of pore throat size that gen-erate complex and nonrepeatable channeling in the fault gouge material (Cuss et al., 2015). Previously, during laboratory tests on fractures withoutfilling, Barton et al. (1985) and Olsson and Barton (2001) demonstrated that the coupling between fracture shear displacement or normal closure and fracture hydrau-lic conductivity variations depended both on the stress conditions and on fracture surface characteristics such as the roughness. Recent laboratory results highlight that the variation in effective normal stress related to localfluid injection in a fault plane does not imply complete separation of the two sides of a fault because complex channeling effects may favor heterogeneous pore pressure variations within the fault plane
©2020. American Geophysical Union. All Rights Reserved.
Key Points:
• Stress controlled the initiation of fault reactivation during thefluid injection
• The fault geometrical complexities dominated rupture propagation that was characterized by a succession of slip and opening events along the fault
• A large fluid leakage event occurred when injection pressure got close to the fault normal stress (i.e., the clamping stress) Supporting Information: • Supporting Information S1 • Data Set S1 • Data Set S2 Correspondence to: Y. Guglielmi, [email protected] Citation:
Guglielmi, Y., Nussbaum, C., Jeanne, P., Rutqvist, J., Cappa, F., & Birkholzer, J. (2020). Complexity of fault rupture andfluid leakage in shale: Insights from a controlled fault activation
experiment. Journal of Geophysical Research: Solid Earth, 125, e2019JB017781. https://doi.org/ 10.1029/2019JB017781 Received 2 APR 2019 Accepted 11 DEC 2019
controlling leakage and nonlocal rupture initiation before the Coulomb rupture criterion is exceeded (Passelègue et al., 2018).
These channeling effects observed along a single fracture or fault plane can become more pronounced within complex geometries of fault zones. Indeed, faults are rarely planar over length scales and often com-prise a multicompartment architecture that consists of multiple cores, where thin gouge layers may accom-modate most of the strain, surrounded by densely fractured damage zones (Faulkner et al., 2003; Mitchell & Faulkner, 2009). These fracture zones are made up of subsidiary faults, some of them displaying significantly different orientations compared to the average orientation of the fault zone (Choi et al., 2016; Mitchell & Faulkner, 2009). Thus, fault geometrical complexities are visible at multiple scales. It is then reasonable to infer that some critically stressed subsidiary faults may exist in the fault zone, favoring local earthquake rup-ture nucleation andfluid leakage even if the main fault zone is less favorably oriented for shear reactivation (Townend & Zoback, 2000). In addition, damage‐induced changes in elastic fault zone properties have been observed to induce local perturbations of the regional stress (Hearn & Fialko, 2009; Niu et al., 2008) which, as some researchers conclude, may favorfluid‐assisted faulting process (Faulkner et al., 2006; Leclère et al., 2015).
Fault rupture associated withfluid pressures is well documented, but the mechanisms by which rupture in complex fault zones occurs remain unclear. Here, we analyze the evolution of rupture withfluid leakage through direct in situ measurements of three‐dimensional displacements on fault structures in a shale for-mation (Opalinus Clay). Hydraulic injection tests were conducted at 340 m depth between packer‐isolated intervals in two vertical boreholes across a ~10‐m‐thick mature fault zone in the Mont Terri underground research facility in Switzerland (Figure 1) (Thury & Bossart, 1999). The test intervals of the two boreholes were set in two contrasted fault facies, thefirst being in the fractured damage zone and the other one extend-ing across the main slip plane of the fault zone. Durextend-ing injection into thefirst borehole (i.e., the injection borehole), a hydraulic connection associated with fault movement occurred between the two boreholes, which are separated 3 m horizontally (Figure 2). In both borehole intervals, we used a “SIMFIP” Figure 1. Geological cross section showing the Main Fault geometry and the experimental borehole location. Martin and Lanyon's tensor orientation (2003), which is considered the most comprehensive Mont Terri stress compilation to date, is plotted in the lower left corner.
instrument (Guglielmi et al., 2014), which is a three‐component fiber optic extensometer that monitors borehole wall displacement duringfluid pressurization of the interval.
In a previous paper (Jeanne et al., 2018), we used a numerical model with a simplified planar fault geometry to explore how a rate dependency of both fault friction and permeability could explain the onset of rupture observed in the injection borehole. The rupture occurred on a secondary fault located in the damage zone of the main fault (Jeanne et al., 2018). In the present paper, we present a complete experimental data set which includes new measurements of injection rate, pore pressure, and displacement variations observed at the monitoring hole, and we estimate the influence of the fault geometry on the observed displacement com-plexities andfluid pathways. We show that following rupture initiation at the injection hole, a hydraulic con-nection occurred between the two boreholes, characterized by a largeflowrate increase and associated with a complex reactivation event in the main slip plane of the fault zone (referred to as the Main Fault Principal Shear Zone). Here, we investigate how the SIMFIP pressure and displacement signals can be used to esti-mate the transient evolution of fault slip and opening as a function of time and pressure increase. This is done through establishing a correlation between the measured displacement orientations and the character-istics of discontinuities observed via borehole optical logs in the packer‐isolated intervals. We then explore how the displacements observed on the identified fault planes agree with the average Mont Terri stress ten-sor. Our analysis highlights that a large effective normal stress (i.e., the clamping stress) reduction was Figure 2. (middle) Vertical cross section of the structural setting of the Main Fault activation experiment (blue rectangles shows the location of the test intervals). (left and right) Cores and optical log of BFS‐1 and BFS‐2 intervals (white rec-tangles on the optical log show the exact location of the anchors of the displacement sensor).
necessary to propagate the fault rupture and to cause a significant leakage event. In details, this propagation exhibits a very complex behavior in space and time. It is characterized by a transient evolution of combined opening and slip, with the displacement behavior observed in the second-ary fault where injection occurred (also referred to as Injection Fault) being distinctly different from the behavior in the Principal Shear Zone of the Main Fault (also referred to as Monitoring Fault) (Figure 2). Finally, we discuss that invoking frictional slip on such a mature fault simplified as a single plane (or a thin layer) is not adequate when evaluat-ing fault activation and associated leakage potential.
2. Tectonic Setting: Geological Structures, Stress
Conditions, and Location of Injection Tests
The Mont Terri Underground Research Laboratory was built for the hydrogeological, geochemical, and geotechnical characterization of the Opalinus Clay formation, which is investigated as a potential host rock for deep geologic nuclear waste disposal in Switzerland. The Opalinus Clay is also quite representative of formations typically considered as caprock in the case of geological carbon dioxide (CO2) storage in deep
geo-logical reservoirs (Goodman et al., 2017). The laboratory consists of multi-ple tunnels and galleries located in the SW‐NE trending Mont Terri anticline, which is a flat‐ramp‐flat structure thrust toward the NW (fault‐bend fold) and where the studied fault, although called the “Main Fault” because it is the most deformed zone intersected by the laboratory facilities, is a minor splay (third order structure; Figure 1). The Mont Terri Main Fault consists of a thrust zone, about 0.8 to 3 m width, bounded by two major fault planes. The upper fault boundary (also referred to as the Main Fault Principal Shear Zone) plane has a strike of N066° and a dip of 45°SE, whereas the lower fault boundary has a strike of N075° and a dip of 40°SE. At depth, the strike of those two main planes may vary from N050°‐to‐N075° and the dip from 40°‐to‐65°SE (Figure 1). The fracture network visible at the gallery walls and on borehole cores, and deforma-tions within the Main Fault are heterogeneous (Nussbaum et al., 2011), including gouge, C′‐type shear bands, folds, numerous fault planes cut-ting the fault zone from centimeter to meter scales and some “intact” parts. The different sets of minor faults within the Main Fault structure correspond to Riedel P‐ and R‐ shears. Around that thrust core, there is a damaged zone of variable thickness and other secondary splay fault zones. The main fault cuts the bedding, which has a strike and dip of N055°‐to‐N065° and 50‐to‐55° SE, respectively. Thus, in some areas, the fault is almost parallel to the bedding, whereas in other areas there is an angle of 10° to 15° between the dip orientations of the main fault surface and the bedding.
The stress tensor has been estimated at different locations in the Mont Terri Laboratory through three dif-ferent types of measurements: (1) with a Slotter probe utilizing a strain relief testing method; (2) based on the undercore method using the CSIRO triaxial strain cells (Wiles & Kaiser, 1994a, 1994ab); and (3) via hydraulic fracturing tests (Haimson & Fairhurst, 1970). The results from all these measurements are dis-cussed in Martin and Lanyon (2003) and in Corkum and Martin (2007) who proposed the following “synthe-tized” value at the depth of the galleries in the Mont Terri underground research laboratory, characterized by the following total principal stresses:σ1= 6–7 MPa subvertical to N210–70°plunge, σ2= 4–5 MPa N320°
sub-horizontal to 7° plunge, andσ3= 0.6–2.2 MPa N052° subhorizontal to 18° plunge. The greatest uncertainty is
the magnitude ofσ3, which appears low compared to the pore pressure of about 2 MPa measured away from
the excavation damage zone of the galleries. For these reasons, other authors recently reestimatedσ3and
reported higher values of 2.5‐to‐2.9 MPa (Amann et al., 2018). In addition, the hydraulic tests allowed for a good estimate of the stress magnitude normal to the bedding planes, estimated to be 4.2 MPa. Uncertainty ranges for the orientation of the principal stresses have not been clearly estimated. The slight Figure 3. (a) SIMFIP straddle packer probe and (b) details of the instrument
used to monitor fault displacements at both BFS‐1 and BFS‐2 intervals. The fault zones across which the SIMFIP sensor is set are named as the injection and the monitoring faults in Figure 2.
plunge ofσ1and the low value ofσ3could be related to a topographic effect due to a deep valley to the
southwest of the Mont Terri site. Finally, most of the stress estimations were done at the gallery level. There is a limited (and unpublished) number of stress measurements at the depth of the experiment which is ~40 m below the galleries, which tend to show higher values up to 3.9 MPa forσ3(Doe & Vietor,
2015). Table 2 shows a summary of the range of values for the reference Mont Terri stress tensor.
In this geological context, the injection tests described in this study were conducted at 40.6 m depth below the main laboratory gallery (corresponding to 340.6‐m depth below the topographic surface) in the vertical borehole (BFS‐2) drilled from the gallery floor (Figure 2). A second vertical borehole (BFS‐1) located 3.07 m horizontally from BFS‐2 was used to monitor the fault core movement at a depth of 37.65 m below the gallery floor (Figure 2). The gallery cross section is about 4 m × 4 m and the excavation damage zone extends approximately 3 to 4 m from the gallery wall. Deformations around the gallery are impacted by a strong mechanical anisotropy induced by the bedding (Amann et al., 2017; Bock et al., 2010). Stress perturbations caused by the tunnel presence are estimated to increase to about +6 MPa and +2 MPa at the gallery wall, respectively, forσ1andσ3. These stress concentrations are vanishing at the limits of the excavation damage
zone (Martin & Lanyon, 2003). Thus, the injection tests were conducted far enough from the influence of the gallery. Injection into BFS‐2 occurred about one week after the boreholes were drilled, which was done with air as drillingfluid. At the end of the drilling, the boreholes were dry, the overall permeability of the rock being so low that noflow was detected. To prepare for the injection, only the interval between the two infla-table packers was initially saturated with water in chemical equilibrium with the formation. The borehole sections above and below the interval remained dry and at atmospheric pressure.
Initial pore pressures in the fault zone and in the intact rock were measured by three mini piezometers installed in slim boreholes as follows:
1. BFS4 was set 3 m horizontally from the fault core and 2 m from the injection chamber in the fault damage zone (Figure 2).
2. BFS6 was set ~2 m horizontally from the fault core and 8 m shallower than the injection chamber in the fault damage zone.
3. BFS5 was set 20 m horizontally from the fault zone in the intact rock.
Each minipiezometer comprised of a 20‐mm diameter and 55‐mm‐long packer installed at a distance of 3 mm to the borehole end. The packer was mechanicallyfixed to the borehole wall and the remaining Table 1
Displacement Vectors Picked at the Injection and at the Monitoring Chambers
Event Displacement vector Start time (s) End time (s) Trend or azimuth (°) Plunge (°) Norm (10−6m)
Activation pressure (MPa)
Activated plane and activation mode u1 ! 6,668 7,533 318 −7 13 1.70 — u2:1 ! 7,557 7,665 128 −8 4 1.95 — u2:2 ! 7,690 7,823 126 −8 4 2.27 — u2:3 ! 7,854 8,056 127 −5 5 2.61 — u2:4 ! 8,086 8,211 135 −7 8 3.05 —
Event 1 !u3 8,245 8,247 95 −26 96 3.45 Injection Fault normal
faulting v1 ! 14,204 14,322 296 13 102 2.41 — Event 2 v!2:1 14,350 14,420 153 10 5 3.69 — v2:2 ! 14,457 14,510 168 12 3 4.04 — v2:3 ! 14,532 14,590 135 15 4 4.54 — v2:4 ! 14,612 14,750 143 2 14 5.00 —
Event 3 !v3i 14,770 14,863 251 50 35 5.43 Injection Fault opening
v3m
! 14,780 14,801 287 5 31 0.45 —
v4m
! 14,850 14,863 217 −28 228 3.93 Monitoring fault zone normal faulting v4i
! 14,863 15,010 46 −57 27 4.26 —
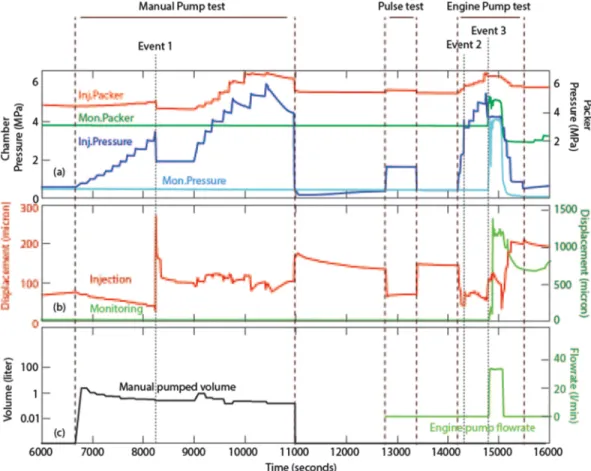
section of the borehole above the packer was sealed with resin. Pressure transducers were set at the borehole head and connected to the chamber with a 0.25‐in. hydraulic line. Pore pressure was continuously monitored since the installation of the minipiezometers in April 2015, 6 months before the start of the Figure 4. Time variations of (a)fluid pressure cycles (upper graphs), (b) norm of borehole displacements (middle graphs; the norm of displacement is not a directional feature. Thus, it is not having negative or positive trends.), and (c) injected volume andflow rate (lower graphs) during the Mont Terri fault activation experiment. The norm of displacement cor-responds to the length of three‐dimensional displacement vector calculated every 0.1 s. The green curve corresponds to the flowrate measured at the engine pump and the black curve to the volume of water injected during each pressure step of the manual pump test.
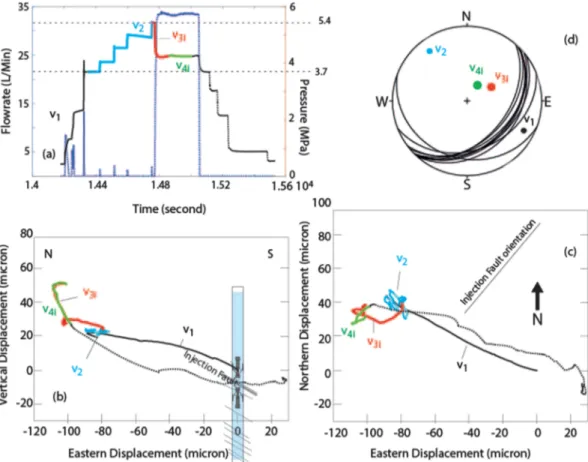
Figure 5. Time variation of injection pressure (a), injection hole norm of displacement andflowrate (b), and monitoring point pressure and norm of displacement during the fault rupture propagation conducted with the engine pump (c). The vectors v!3i, v!3m, and v!4mcorrespond to displacement variations that initiate at both the injection (index i) and the
injection tests. About 2 months after installation, pore pressures stabilized at 0.9, 0.7, and 1.4 MPa respectively at BFS4, BFS5, and BFS6. Considering the accuracy of these measurements and in order to remain close to the lowestσ3value estimated by Martin and Lanyon (2003), the initial interval pressure
before the injection tests was set at 0.6 MPa.
The two SIMFIP instruments were placed on the basis of core and image logs to attempt to isolate relevant fault features under the presumption they extended between the two boreholes. The borehole interval BFS‐2 used for the injection tests is intersected by subparallel reactivated bedding surfaces in the fault damage zone (Figure 2). The displacement sensor was centered at 40.6 m depth, about 3.4 m above the Principal Shear Zone of the Main Fault (which is at 44.0 m depth in borehole BFS‐2). The entire injection interval contains 13 subparallel fault planes striking N040°‐to‐N050° dipping 35‐to‐55° SE, and one minor plane striking N110° dipping 24°SW, which is located at the bottom end of the interval where it is stopped by two N041° and N045° striking faults (see Figure 6d for stereographic projection of the planes intersecting the interval). The displacement sensor was anchored across the major fault plane identified within the injection interval at 40.6 m (Figure 2); as mentioned before, this plane is referred to as the Injection Fault in the remainder of the paper. It is a centimeter thick scaly clay layer with an average orientation of N042 to 36SE surrounded by four fault planes N035° to N050° with a dip angle of 32° to 40° SE. The clay, within the injection interval, is intact above the N042 to 36SE Injection Fault at 40.6 m (Figure 2).
In the BFS‐1 monitoring hole, the test interval was set across a major slip surface (referred to as Principal Shear Zone or Monitoring Fault), which bounds the upper part of the Main Fault core and is locally Figure 6. Fluid pressure and borehole displacements measured at the injection borehole during the fault rupture initia-tion cycle conducted with the manual pump (from 6,500 to 11,000 s in Figure 3). (a) Pressure variainitia-tions. (b) Displacements variations in the vertical plane perpendicular to fault direction. (c) Displacements variations in the horizontal northeast plane (colored segments are the same on all graphs): (d) Stereographic lower hemisphere projection of fault planes affecting the interval and of vectors u!1 to u!3 describing the main displacement trends. The u!3 appears to be located on
the Injection Fault trace in Figure 5d. Dots for u!1 to u!3 represent the intersection of the displacement vector to the
surface of the stereographic projection. The graphs show the displacements of the SIMFIP sensor upper anchor relatively to the lower anchor, which is consideredfixed.
oriented N050° and dipping 61°SE (Figure 2). The displacement sensor is anchored across this major N050° to 61°SE slip surface at 37.65 m (The surface of the principal shear zone is complex and picked as thick yellow sigmoids in Figure 2). Figure 8d shows the stereographic projection of all fault and fracture planes intersecting the monitoring interval. In addition to the principal shear zone, the entire monitoring interval contains two contrasted structural zones, the Main Fault core zone in the lower part, which contains several fault planes with fault gouge and three thick lenses of scaly clay, and a fractured damage zone in the upper part with a few fractures and a secondary fault oriented N120° dipping 25°SW with a thin scaly clay layer. The main (about 12 planes) discontinuity family is oriented N30‐to‐N60 dipping 55‐ to‐75°SE (see Figure 8d).
3. Instruments and Experimental Protocols
3.1. The SIMFIP Borehole Instrument
The instrument used for the injection tests is a SIMFIP borehole probe, which allows simultaneous measure-ment offluid pressure and three‐dimensional displacements at high frequency (Guglielmi et al., 2014, 2015; Figure 3). The injection interval is isolated in an open hole using two inflatable rubber packers which are sliding sleeves straddled by a steel mandrel. The sealed interval is 2.4 m long. A 0.49 m long and 0.1‐m dia-meter precalibrated aluminum cage located between the two packers is clamped on the borehole wall on both sides of an existing fault or fracture plane (Figure 3). When clamped, the cage is disconnected from the straddle packer system. As discontinuities intersected by the borehole interval are deforming as a Figure 7. Fluid pressure and borehole displacements measured at the injection borehole during the fault rupture propa-gation cycle conducted with the engine pump (from 14,000 to 15,600 s in Figure 3). (a) Pressure variations. (b) Displacements variations in the vertical plane perpendicular to fault strike. (c) Displacements variations in the horizontal northeast plane (colored segments are the same on all graphs): (d) Stereographic lower hemisphere projection of fault planes affecting the interval and of vectors v!1, v!2and v!3i describing the main displacement trends (no index and index i
figure displacement vector at the injection borehole). Dots for v!1to v!3i represent the intersection of the displacement
result of thefluid injection into the interval, the cage allows obtaining angle dependent strain measurements which can be used to constrain the full three‐dimensional displacement tensor and the three rotations of the upper anchor of the cage relatively to the lower anchor (see supporting information).
The maximum displacement range of the deformation cage is 0.7 and 3.5 mm in the axial and radial direc-tions of the borehole, respectively, and the accuracy is ±5 × 10⁻⁶m. A compass set on the probe provides the orientation of measurements with 0.1° accuracy. Thus, in further analyses, the displacements can be rotated into a geographic reference frame, for example, one where x is northward, y is westward, and z is vertical upward, or another where the displacement is expressed as opening and slip of the discontinuity.
The displacement data are continuously logged together with pump parameters (pressure andflow rate); oil pressure in the anchoring hydraulics and water pressure in the packer hydraulics (measured in the tunnel); as well as temperature and pressure in the borehole above, between and below the packers (the pressure and Figure 8. Displacement variations at both the injection and the monitoring points (a) in the vertical‐north plane, (b) the east‐north horizontal plane and (c) the vertical‐east plane. Stereographs (d) and (e) show the vectors v!7i to v!9m, which correspond to displacements variations that initiate at both the injection
(index i) and the monitoring boreholes (index m) during Events 3. Faults planes affecting the intervals are also plotted. In the stereographs, the injection and the monitoring faults are plotted as thick lines. Dots for v!7i to v!9mrepresent the intersection of the displacement vector to the surface of the stereographic
temperature sensors are set downhole). The pressure sensors allow for measurements over a pressure range from 0 to 10 MPa, with a 0.001 MPa accuracy. The accuracy of the temperature sensors is 0.1 °C.
The relation between the compliance of the probe and the elastic response of the borehole wall has been stu-died extensively through laboratory tests and fully coupled hydromechanical modeling using the TOUGH‐ FLAC simulator (Jeanne et al., 2017). It was shown that the device is ~10 times more compliant than the rock, and that the orientation and magnitude of displacements below the stimulation pressure strongly depends on the elastic anisotropy of the rock. In the Mont Terri case, the SIMFIP response to the elasticity of the borehole wall is primarily related to the elastic anisotropy introduced by the bedding planes when few discontinuities are present in the measur-ing interval. This anisotropy is characterized by an elastic stiffness of the Opalinus Clay, which is 2.5 times higher parallel than normal to the bed-ding (Bock et al., 2010). The Young's modulus parallel to bedbed-ding is 10.0 GPa, and it is 4.0 GPa normal to bedding. In addition, the Poisson's coeffi-cient is 1.4 times smaller parallel than normal to bedding, with values of 0.25 and 0.35 respectively. In theory, there should be no SIMFIP response for a uniform inflation of the pressurized interval in isotropic intact rock. In the Mont Terri case, the SIMFIP probe is capturing an elastic anisotro-pic response because the vertical interval is cross cutting the Opalinus Clay bedding planes which are striking N055°‐to‐N065° and dipping 50‐ to‐55°SE. Typically, the SIMFIP displacement in response to this inclined elastic anisotropy of the interval is characterized by a N310°‐to‐N330° azi-muth and 0‐to‐10°NW plunge and a 10‐to‐20 μm magnitude (see an exam-ple characterized by vector u!1 in Figure 7 and Table 1).
During each injection test, the injection pressure is controlled by either a manual or an engine pump whileflowrate, pressure, temperature, and displacement variations from the two SIMFIP probes, respectively, installed in the injection borehole and in the monitoring hole, are moni-tored with the same acquisition station. The sampling frequency is 500 Hz.
3.2. Hydraulic Stimulation Protocol
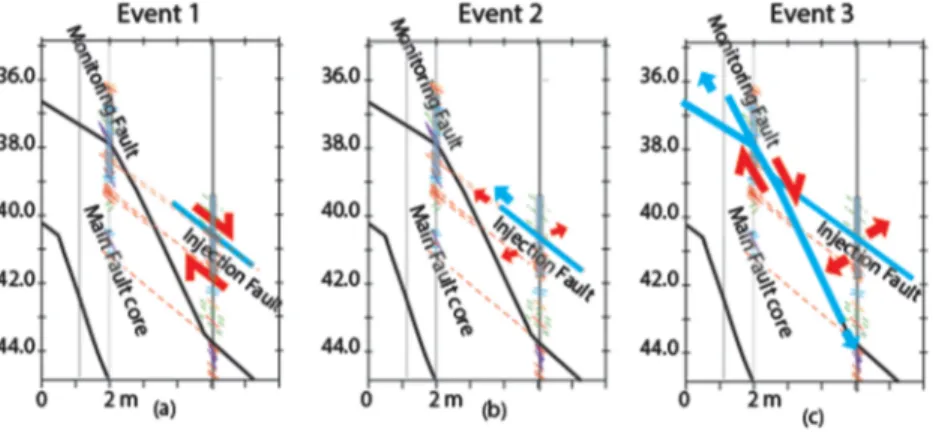
The injection tests discussed in this study were conducted in Borehole BFS‐2 (Figure 2, Injection hole), while Borehole BFS‐1 interval was used for monitoring (Figure 2, Monitoring hole). When starting the fault stimu-lation, both boreholes remained in dry conditions. The monitoring probe wasfirst set across the desired interval in the Monitoring Hole with the Figure 9. (a–c) Conceptual model of the fault activation sequence.
Figure 10. (a) Bestfit stress tensor estimated by matching slip Event 1 with the maximum stress calculated on the Injection Fault. (b) Average Mont Terri tensor (see Table 2 for values). The stereographic projections show the principal stress orientations (purple squares), the measured fault displace-ments (red points), the calculated shear (orange points), and normal (green points) forces applied on the different fault planes affecting the injection (upper stereographs) and the monitoring point (lower stereographs). Black points are the poles of the planes.
Principal Shear Plane at its center. Packers were inflated to 1 MPa in order to seal the interval. Then, the displacement sensor was anchored to the borehole wall, and finally, the pressure in the monitoring chamber was set to 0.6 MPa in equilibrium with the formation pressure close to the fault. Following the monitoring probe installation, a similar procedure was followed to install the other probe in the Injection Hole. However, the packer pressure was then increased to about 3.5 MPa in the injection probe (during the subsequent testing, the packer pressure was increased again when the injection chamber pressure was increased in order to keep the differential pressure between packer pressure and cham-ber pressure to about 1.0 MPa). After installation and pressuriza-tion of both probes, a time delay of about 30 min was set for the instruments to equilibrate toward pressure and temperature. The residual effect of the thermohydrome-chanical equilibration between the probe‐borehole system and the chamber's injected water, which is about 2 °C hotter than the borehole wall at the interval depth, explains the residual trend of the displa-cement baseline observed before the start of the injection test (see the norm of the displadispla-cement vector displayed in Figure 4b).
The total duration of the injection test was about 3 hr (from 6,000 to 16,000 s in Figure 4). Thefirst injection into borehole BFS‐2 was conducted with a manual pump (Figures 2 and 4a). Pressure was increased step‐ by‐step by injecting limited volumes of water into the injection chamber (between 6,700 and 11,100 s in Figure 4c) at a very slow pressure increase rate of ~0.05 MPa/min (Figure 4a), to avoid any dependency of the hydromechanical response of the fault on the rate of pressurization (Haimson & Cornet, 2003). Each manual pump stroke was 1‐s‐long and corresponds to 15 ml of injected water. Pressure was increased by increments of 0.5 MPa. After each pressure step, the pumping was stopped for about 2 min. The total volume of pumped water was measured by weighting the manual pump tank and comparing this to the volume estimated from counting the pump strokes. By doing this, the accuracy of the manually pumped volume was about ±1 ml. The total volume injected with the manual pump was about 0.69 L, after removing the compliance effects of the borehole interval and apparatus and assuming that water is incompressible. This phase allowed studying the initiation of the fault reactivation characterized by Event 1 at 8,245 s (Figure 4). The Event 1 rupture was limited to the nearfield of the injection borehole given the low amount of injectedfluid. This was consistent with the fact that no pressure or displacement signal was observed at the monitoring hole located 3 m away horizontally.
At the end of the manual pump test (11,000 s in Figure 4), the injection chamber was opened until the cham-ber pressure stabilized back to the initial 0.6‐MPa pressure. The flow back was not measured but a slight and progressive chamber pressure increase was observed between 11,000 and 12,700 s (i.e., some of the injected fluid may have flowed back into the chamber). When the chamber pressure had stabilized, a low‐pressure Pulse Test was conducted (between 12,700 and 13,400 s in Figure 4) to estimate the hydromechanical response of the newly created rupture patch. Pressure was kept low to avoid any further rupture propagation (and the injected volume was not measured during the pulse).
Finally, between 14,100 and 15,500 s, a second pressure Step‐Rate‐Test was conducted with an engine pump, which can provide larger and more sustained injections than the manual pump. The intent of this second test was to propagate the rupture in the fault from the injection to the monitoring boreholes. Two rupture events (Events 2 and 3 in Figure 4a) were observed at 14,350 and 14,772 s, respectively, described in detail later in this paper. Event 2 was not clearly seen on the pressure curve but it appeared on the displacement curve at the injection point (Figure 4b). After Event 2, the pressure was increased further until a sudden pressure drop occurred in the injection hole corresponding to Event 3 (Figures 4a and 4b) followed 20 s later by a strong pressure signal in the monitoring hole, indicating a hydraulic connection had established (Figure 4c). This hydraulic connection was associated with a strongflowrate increase as the engine pump attempted to stabilize the pressure in the injection chamber (see expanded plot in Figure 5). This “step” was maintained longer than the previous steps in order to monitor the effects of continuedfluid injection and propagation on the fault activation. Before a hydraulic connec-tion was established (before Event 3), the measuredflowrate was essentially zero. After Event 3, the Table 2
Stress Tensor at Mont Terri (upper lines) and Tensor Estimated in This Study (Lower Lines)
Stress magnitude (MPa) Dip direction Dip Mont Terri tensor (range of values from the bibliography)
σ1 6‐to‐7 (6.5) 210° 70°‐to‐90° (80°)
σ2 4‐to‐5 (4.5) 310° 0°‐to‐7° (3.5°)
σ3 0.6‐to‐2.9 (1.8) 52° 0°‐to‐18° (9°)
Tensor estimated in this study
σ1 6.2 210° 86°
σ2 4.5 315° 0°
flowrate increased to about 33.5 L/s, and the total injected volume during this step (until 15,000 s) was about 143.1 liters. The second pressure test ended when between 15,000 and 15,500 s thefluid pressure was manually decreased step‐by‐step to its initial value. Again, most of the injected fluid stayed in the formation as no significant flow back was measured.
4. Experimental Results
4.1. Time Evolution of Pore Pressures and Fault Displacements
The data in Figure 4 show the complete test sequence including the manual and the engine pump cycles. No signal was measured at the monitoring well until 14,770 s when a hydraulic connection between the two boreholes occurred during the engine pump injection cycle. Thus, before 14,770 s, during the manual pump injection, the signals observed in the injection hole corresponded to“local” effects related to rupture initia-tion occurring in the nearfield of the injection well. At the end of the complete test sequence, “permanent” residual displacements of 200 and 813μm remained at the injection and monitoring boreholes respectively, highlighting irreversible deformations.
During the manual pump test, there was an initial displacement decrease almost linearly varying with the step pressure increase in the injection chamber (Figure 4b). An abrupt displacement increase occurred at 8,245 s when injection pressure reached 3.45 MPa (Event 1 in Figure 4). Event 1 was quite short lasting only 2 s from 8,245 to 8,247 s. It was characterized by a 231μm displacement event coinciding with a 1.6 MPa pressure drop. Following thisfirst event, pressure could still be increased with the manual pump up to a maximum value of 5.95 MPa. During this period, the pressure did not stabilize during the pressure steps, indicating that there was some pressure leak‐off into the formation corresponding to a cumulated 0.689‐L leakage. Displacements displayed complex increasing and decreasing variations around an average value of 100μm. At the end of the manual pump cycle (10,870 s in Figure 4), the opening of the pressure chamber induced an instantaneous ~60‐μm displacement increase followed by a slow decrease until quasi‐ stabilization at 14,200 s at the onset of the engine pump test. At this time, the residual displacement was 144μm.
The pressure pulse conducted between 12,780 and 13,390 s at a low maximum pressure of 1.7 MPa allowed interpreting the quick bleed‐off displacement as a reversible mechanical response of the bore-hole. The slow displacement decrease from the onset of the bleed‐off at 10,870 to the onset of engine pump cycle at 14,200 s could be related to pore pressure readjustments in the rock adjacent to the bore-hole. Considering this slow pressure response of the chamber, we may postulate that the amplitude of displacement Event 1 could be explained by an irreversible borehole displacement of ~144μm. The irre-versible component of displacement could be caused by rupture growth away from the injection well, limited in size so that is does not propagate fully to the monitoring borehole. This is of course somewhat speculative since we do not have any monitoring points between the injection hole and the one monitor-ing hole about 3 m away.
The engine pump cycle showedfive distinct periods, during which two main displacement Events 2 and 3 occurred (Figures 4b and 5):
1. From 14,200 to 14,322 s, there was a decrease of the displacement norm associated with the elastic response of the chamber to the pressure increase (Figure 4b; this decrease of the norm of displacement showed that borehole wall displacements were larger for pressure variations imposed during the initial low pressure steps compared to the high‐pressure steps, highlighting a larger borehole expansion related to a restressing effect in the early steps. Overall, the borehole was expanding with pressure increase, but expanding more at the initial pressure increments.).
2. When pressure was increased from 2.35 to 4.1 MPa, there was an abrupt displacement increase of 34μm (Event 2 in Figure 4b). Event 2 duration lasted 70 s from 14,350 to 14,420 s. It occurred at 3.69 MPa, which was close to the pressure value at which Event 1 occurred during the earlier manual pump cycle. No sig-nals were observed in the monitoring hole.
3. From 14,420 to 14,770 s, there was a complex displacement behavior, while pressure was increased to a maximum value of 5.43 MPa. This period could be compared to the post‐Event 1 period.
4. At 14,770 s, Event 3 occurred as a 45‐μm displacement increase in the injection borehole and a 1.21‐MPa pressure drop from 5.43 MPa associated with a large and rapidflow rate increase from 0 to 33.5 L/min.
The duration of Event 3 time was 24 s from 14,770 to 14,794 s (Figures 4b and 5). The v!3i in Figure 5b
shows the displacement vector during the duration of Event 3.
At the monitoring well, a displacement event was recorded about 8 s after the onset of Event 3 ( v!3m in
Figure 5c). (Subscripts i and m refer to the injection and monitoring boreholes.) About 28 s after the onset of Event 3, a hydraulic connection was established between the injection and the monitoring holes that was characterized by a 4.17‐MPa increase of the monitoring chamber pressure. Thus, the displacement event v3m
!in the monitoring chamber preceded the pressure increase in the monitoring chamber by about 20 s (Figure 5c). The following period displays a strong instability in pressure and displacements signals, which is observed in both boreholes (Figure 5). About 78 s after the onset of Event 3, a new event initiated at the monitoring point ( v!4m in Figure 5c), about 13 s long from 14,850 to 14,863 s. This occurred at 3.93 MPa
and was associated with a 2.18 ± 0.01‐MPa pressure drop at the monitoring point (Figure 5c). In detail, this period was characterized by strongfluctuations in both displacement and pressure values.
4.2. Three‐Dimensional Displacement Evolution 4.2.1. Rupture Initiation
During the manual pump test, four main displacement trends were successively observed corresponding to the different phases of rupture initiation (these phases are indicated as different colored graph segments in Figures 6a–6c):
1. The initial chamber response (dark blue segment from 6,206 to 8,245 s in Figure 6) at relatively low pres-sure (less than 1.7 MPa) was characterized by a N318° azimuth and 7°NW plunge displacement, which corresponds to vector u!1 of 13‐μm magnitude (Figures 6b–6d and Table 1). Above 1.7 MPa,
displace-ments switched to a SE plunge. The largest of these SE plunging displacedisplace-ments occurred at 3.05 MPa. It corresponds to vector u!2 from 8,086 to 8,211 s of 8‐μm magnitude (Figure 6 and u!2:4in Table 1).
2. Event 1 as defined in Figure 4 initiated with a large, clear, and almost linear downward displacement toward the East, which corresponds to vector u!3 (red segment in Figure 6). Vector u!3 displays a
N095° azimuth and a 26°E plunge. Displacement occurred from 8,245 to 8,247 s with a magnitude of 96μm (Figure 6).
3. The post‐Event 1 period (cyan segment from 8247 to 9003 s in Figure 6) displayed complex displacements trends. Displacementfirst continued downward, then was reversed upward with varying directions. The downward displacement was associated with most of the pressure drop, whereas there was almost no pressure variation during the upward period (Figure 6a).
4. When pressure was increased to the maximum of 5.95 MPa, there was an average NE‐SW subhorizontal displacement trend, which was almost parallel to the injection fault direction (green segment from 9,003 to 10,970 s in Figure 6).
5. Thefinal opening of the chamber (dashed blue segment starting at 10,970 s in Figure 6) showed a signif-icant residual or permanent displacement related to Event 1 and to the NE‐SW displacement reorienta-tion at high pressure (Figures 6b and 6c).
The calculated azimuth, plunge, magnitude, starting, and ending time of the main displacement vectors u!1,
u2
!; and u!3 are summarized in Table 1. The u!3 is the largest magnitude displacement with the fastest
dis-placement rate. We compared these vectors orientation with the orientation of the fault planes observed in the injection interval using a stereographic circle plot (Figure 6d). The u!1 characterizes the initial reversible
expansion of the injection chamber, which is preferentially oriented almost perpendicular to the N50° 35‐to‐ 45° dipping fault family affecting the chamber. Jeanne et al. (2017) showed that this u!1 orientation and
mag-nitude can be explained by the rock elastic modulus magmag-nitude, which is 10 times lower perpendicular to existing fault planes than parallel to existing fault planes. The u!2 and u!3 plots on or close to the natural
fault plane traces in Figure 6d. This means that these displacements are almost tangential to the preexisting natural planes. The u!3 is consistent with irreversible shear along the N042 to 36°E Injection Fault plane
located between the two SIMFIP anchors. It corresponds to a normal fault activation with a small right‐ lateral strike‐slip component occurring at the injection pressure of 3.45 MPa. The u!2 , which displays a
roughly similar orientation but a much smaller magnitude than u!3, reveals that a smaller fault slip event
4.2.2. Rupture Propagation
During the engine pump test, several main displacement trends were successively observed corresponding to the different phases of rupture propagation. In Figures 7a–7c, these phases are indicated as different colored graph segments showing displacement behavior in the injection chamber:
1. The initial displacements in the injection chamber, from 14,204 to 14,322 s and up to a 2.41‐MPa chamber pressure, were characterized by a N296° azimuth with an upward 13°NW plunge and a 102‐μm magni-tude (black segment in Figure 7 and vector v!1in Figure 7 and Table 1).
2. From 14,350 to 14,770 s, corresponding to pressure increases from 3.5 to 5.41 MPa (cyan segment in Figure 7), the azimuth of the displacement vector reversed to N135 to 168° with an upward 2° to 14° SE plunge. This occurred during the resting times between pressure steps and corresponded to small 5‐ to‐14‐μm magnitudes (vectors v!2:1 to v!2:4 in Table 1). We defined Event 2 in Figures 4 and 7 as the first
reversed vector, which occurred from 14,350 to 14,420 s at 3.69 MPa (v!2:1in Table 1 also referred to as v!2
in Figure 7). During this period, displacements remained relatively small, in particular when compared to v!1. Although the magnitudes were close to the accuracy limit of the measurements, the drastic change
in the vector azimuth from N296° to N135° to N168° clearly indicated a change in the injection fault response to further pressure increases.
3. Event 3 was characterized by a complex displacement behavior from 14770 to 14,863 s during, which the injection pressure dropped strongly from 5.43 to 4.22 MPa (red segment in Figure 7). For the sake of sim-plicity, displacements in the injection borehole are described with one vector v!3i , which is calculated
based on the displacement coordinates at the beginning and at the end of Event 3 (Table 1). The v!3i is
characterized by a N251° azimuth with an upward 50°SW plunge and a 35‐μm magnitude. In detail, com-plex direction changes in displacements occurred during this Event 3 period. The v!3i displays a much
larger dip than the previous vectors, highlighting a significant vertical opening of the injection fault. 4. After 14,863 s, displacements at the injection borehole displayed a N046° downward 57°NE plunge
(green segment and v!4i in Figure 7a and Table 1). The v!4i corresponds to a partial closing of the injection
fault, which followed the large displacement and the associated pressure drop that occurred from 14,850 to 14,863 s at the monitoring point (v!4m in Figures 5 and 8 and Table 1).
Vector v!1 shows a reverse shear along the N042 to 36°E Injection Fault plane (Figure 7d) triggered by
the chamber expansion due to the initial pressure increase from 0.6 to 2.41 MPa. Such a large reversed shear was not observed during the manual pump test. We may speculate that it was favored by the ear-lier rupture of this plane during Event 1. The N153° azimuth of Vector v!2is almost perpendicular to the
N042° azimuth of the injection fault (Figure 7d) and the 10° plunge of vector v!2 has a ~41° angle with
the dip of the fault plane. This displacement direction is consistent with the Injection Fault activation as a normal fault with shear and associated dilatant opening of the fault plane. Between Event 2 and the time when the pressure reaches 5.43 MPa, this activation remains limited and characterized by low magnitude displacement vectors (defined as v!2:1 to v!2:4 in Table 1). Finally when Event 3 occurs, the large change in both the azimuth and the plunge angle of vector v!3i are difficult to explain by the
acti-vation of one single fracture direction. Rather this behavior reveals a complex hydraulic opening of the Injection Fault, which potentially involved the activation of several fractures of the injection interval (Figure 7d).
Figure 8 shows details of the three‐dimensional displacement variations at both the injection (index i) and the monitoring boreholes (index m) including and immediately following Event 3 (red segment in Figures 4 and 7). Recall that this is the event during which both the displacement and pressure front propa-gate all the way from the Injection Hole to the Monitoring Hole. From 14,780 to 14,801 s, that is, 10 s after Event 3 initiated at the injection point and 20 s before the pressure increased at the monitoring point, the initial displacements at the monitoring point followed a N287° azimuth and 5° upward plunge ( v!3m in
Figure 8 and Table 1). There was not much displacement variation during the pressure increase from 0.45 to 3.93 MPa at the monitoring point (see Figure 5 for details) until 14,850 s. From 14,850 to 14,863 s, a strong 228‐μm magnitude event suddenly occurred, characterized by a N217° azimuth and 28° SW plunge (v!4m in
Figure 8 and Table 1).
The orientation of vector v!3mis very different from v!4m(Figure 8d). Since vector v!3mcorresponds to a
principal direction of deformation transferred by stress accumulation at the rupture front. In contrast, vector v4m
!is reasonably consistent with the activation of the N050° to 61°E Monitoring Fault as a normal fault with a right‐lateral strike slip component (thick black line in the stereogram of Figure 8d).
5. Interpretation of Observations
5.1. Evidence of Opening and Slip During the Fault Activation
The test sequence highlighted a complex fault zone activation response characterized by a succession of rup-ture events observed in two boreholes about 3 m away in horizontal direction. There was an evolution of the measured displacements with regard to both the magnitude of the applied injection pressure and the tem-poral sequence of the injection test (Figure 9). During thefirst pressure cycle (manual pump cycle), rupture initiated at a pressure of 3.4‐to‐3.5 MPa applied in the injection borehole. It corresponded to a slip event occurring on the Injection Fault, which was activated as a normal fault (Event 1; Figure 9a). This event was associated to a 1.6‐MPa pressure drop. Rupture Event 1 was limited in size since it was not detected at the monitoring hole. Thisfirst phase was followed by a period where the injection pressure was increased by a factor of about 1.6 without any significant fluid leakage into the fault zone. However, this corresponded to a large scattering of displacement directions, and it is difficult to relate these displacement orientations with the orientation of the natural fracture planes affecting the interval.
The second pressure cycle (engine pump cycle) showed that hydromechanical response of the Injection Fault after Event 1 was consistent with limited shear and associated dilatant opening of the fault plane. It also confirmed there was no significant fault leakage. During this second pressure cycle, Event 2 was trig-gered as a limited rupture event at about the same injection pressure as the earlier Event 1 during thefirst pressure cycle.
Upon further pressure increase to 5.43 MPa, there was a significant hydraulic opening of the Injection Fault characterized by the rapidflowrate increase from ~0 to 33.5 l/min. The observed Event 3 displayed a signif-icant change in the displacement direction from tangential to the Injection Fault to about ~41° oblique, high-lighting a dominant opening of the fault. This change evolved in complex dynamic patterns and in various directions illustrating that rupture propagated in a complicated manner through the multiple fractures of the injection interval. The fault rupture eventually propagated the few meters distance to the monitoring point where two main displacement signals were detected on the Monitoring Fault. Thefirst displacement signal preceded by 20 s the hydraulic connection, which was characterized by a strong pressure increase. These displacements were interpreted as stress perturbations occurring at the rupture front propagating fas-ter than the pressure front. The second displacement signal exhibited the largest displacements observed during the entire experiment, with an estimated slip magnitude of ~206μm. These displacements were con-sistent with the activation of the N050° to 61°E Monitoring Fault as a normal fault with a right‐lateral strike slip component. Associated to the slip‐induced‐normal‐opening of ~71 μm, several pressure transients were recorded at the monitoring borehole (Figure 9c).
5.2. Relation Between the Measured Displacement Events and the Stress State at Mont Terri
In this section, we analyzed the influence of stress conditions on the average displacement trends observed in the experiments. To conduct this analysis, we used the stress tensor commonly adopted at the Mont Terri underground laboratory scale (Table 1) and entered it into the MohrPlotter open source software [R. W. Allmendinger©], which calculates the orientation and magnitude of the shear stressτ and normal stress σnon a single, planar discontinuity of given geometry. In the stereograms of Figure 10, the resultingτ and
σnare respectively plotted as orange and green points for each of the fault planes intersected by the injection
and the monitoring intervals. Assuming that the shear stress direction on any fault plane corresponds to the slip direction (Bott, 1959; Gephart, 1990; Wallace, 1951), we then varied the tensor orientation and magni-tude until we got a reasonable match of the calculated shear stress orientation with the slip vector u!3
mea-sured on the Injection Fault during Event 1. This was done manually by trial and error and no uncertainty analysis was undertaken. The resulting stress tensor, which best explains the slip event measured during Event 1, could then be compared against the well‐constrained Mont Terri stress tensor.
Figure 10 and Table 2 show that the tensor orientation and magnitude for which the calculated shear stress on the Injection Fault (red plane in Figure 10) best matches with the orientation of the slip vector u!3 is in
reasonable agreement with the average Mont Terri tensor. Indeed, the maximum difference between our bestfit tensor and the average orientation of the principal stresses is only 6° while our estimated magnitudes match the average values (Table 2). Using our bestfit tensor direction and magnitude, we then calculated that the initial normal stressσnon the injection fault to be 5.5 ± 0.3 MPa. This is highlighting that, when
Event 3 occurred at an injection pressure of 5.43 MPa, this pressure was sufficient to fully overcome the nor-mal stress on the fault and thus to open the Injection Fault plane. In other words, the fault plane opened once the effective normal stress was sufficiently lowered.
In contrast, when using the same bestfit tensor to compare the directions of the resolved shear stresses to the displacement vector v!4mcorresponding to the Monitoring Fault reactivation, we found that vector v!4m
orien-tation is poorly explained by this stress tensor. The reason for this discrepancy is not fully understood. We may postulate that either the local stress state on the Main Fault is different or that stress is not the only fac-tor driving the reactivation of the Monifac-toring Fault.
5.3. Fault Displacements and Flow Transmission Through the Fault Zone
During Event 3, the Injection Fault opened and an increase inflowrate occurred at an injection pressure of 5.43 MPa. In contrast, no significant flow variation was seen during the first injection cycle when Event 1 occurred on the fault at 3.4 MPa nor during the second injection cycle when the smaller Event 2 occurred at 3.69 MPa. Thus, these earlier slip events did not seem to significantly unlock the fault and they failed to generate a leakage pathway. One reason could be that Event 1 generated a permeable path in the fault zone but this patch was of limited radius (since no signal was recorded at the Monitoring Hole 3 m away) and hydraulically confined. Event 2 was probably too small for the fault slip to propagate much. One simple explanation is thatflow transmission through the fault zone between the two boreholes was observed only when the injection pressure got high enough to reduce the effective normal stress on the fault to about zero. This corresponds to an extreme pressurization of the fault, a likely necessary condition to grow the rupture in initially low permeability fault.
6. Discussion
Fault rupture andfluid leakages are documented in hydraulic injection operations in subsurface rocks. However, in situ studies aimed to identify fault activation andfluid flow mechanisms are rare, in particular, in very low permeability conditions. In this paper, the Mont Terri experiment provides valuablefield scale insights into the role of stress in the injection‐induced activation of an initially impermeable fault zone inter-secting a clay formation. Wefind that the rupture initiation occurring near the injection borehole can rea-sonably be described by a conventional Coulomb stress criterion. Although the fault is unfavorably oriented with respect to the“regional” stress field, we conclude based on direct displacement measurements thatfluid injection is producing a slip event at the fluid pressure source. This result is in good accordance with theoretical and crustal scale observations of highfluid pressures favoring the apparent weakness of faults unfavorably oriented toward stress (Axen, 1992; Faulkner & Rutter, 2001; Garagash & Germanovich, 2012; Rice, 1992). Nevertheless, we observe that rupture propagation is limited until the injec-tion pressure is large enough to equal the normal stress on the fault(s) at the pressure source. This observa-tion is in accordance with theoretical work showing that the localfluid pressure may have to reach the total normal stress on the fault before an eventual rapid rupture can be nucleated (Viesca & Rice, 2012). We observe that dilation induced by sliding is not enough to generate fault permeability and leakage in this type of “closed” fault that has a very small permeability initially, close to that of the intact Opalinus Clay. Two mechanisms can explain why this mechanism is not enough. First, the complex chan-neling usually associated with dilatant slip may allow lessfluid flow from an injection source point than the complete separation of the fault or fracture walls (Watanabe et al., 2008). Second, it has been observed in the laboratory that slip on rough fault surfaces can be associated with periods of dilation as well as with the progressive formation of gouge potentially leading to a permeability drop with cumulated shear (Faoro et al., 2009).
Thus it appears that a significant driving force is needed for fluids to flow into the fault, which would then increase the local pressure over a sufficiently large region, reduce the effective stress and trigger a large stress and strain perturbation at the tip of the overpressurized patch. Such dilatancy‐assisted flow would allow
fluid to permeate along an initially “closed” fault and would finally pressurize a sufficiently large area to get shear. This behavior can only partially be explained by the orientation of fault structures toward stress. In addition, we suspect that the tortuousfluid propagation patterns expected in a complex fault zone is another key factor to consider when assessingfluid leakage in fault zones. Our direct field observations which couple local fault displacements withfluid pressure are in good agreement with laboratory tests, which show that for samples with low intact rock permeability and low fault permeability, excessfluid pressure is needed to significantly reduce the effective normal stress and trigger frictional sliding on a preexisting weak plane (Rutter & Hackston, 2017). In addition, Cuss et al. (2015) demonstrated in their laboratory studies that high‐pressure migration of fluids into slipping clay‐rich fault zones may generate preferential flow paths of small dimensions resulting in a complex spatial distribution of fluid pressure. Our field data show micrometer‐scale variations in the displacement vectors with time, which suggests the development of com-plex preferentialflow paths. We conclude that simple effective stress laws that consider a uniform pore pres-sure distribution in a fault of simple geometry is often not adequate for the prediction of fault reactivation in shale formations. Thisfinding is consistent with Passelègue et al. (2018) who showed at laboratory scale that a nonlocal rupture initiation criterion should be considered to describe fault reactivation because of thefluid pressure heterogeneity within the fault.
Because we have two observations points withfluid pressure and mechanical displacement data in the rup-ture zone of the fault, we can evaluate dynamics offluid and rupture propagation along the fault plane. We find that the largest rupture perturbation occurs after an overpressurized fault place in the damage zone con-nects with the principal shear zone of the Mont Terri Main Fault. In detail, the pressure source is located in a relatively less deformed zone, which is affected by secondary faults parallel to the Main Fault and almost perpendicular to the maximum horizontal stress. The injectedfluids force their way along these initially low permeability planes of weakness (creation of new fractures could also occur given the uncertainty and the heterogeneity of the local stress state), creating large stress perturbations during the rupture growth in the fault zone. We observe that strain perturbation occurs ahead of the pressure perturbation and thus beyond the pressurized patch propagation. Ourfield observations are consistent with laboratory‐scale obser-vations from Rutter and Hackston (2017) who observed that overpressurizedfluids suddenly entering a low‐ permeability fault zone after connection from a hydrofracture produced strong rupture instability character-ized by stick‐slip sliding. In addition, Cappa et al. (2018) showed through fully coupled hydromechanical modeling that the lower the initial fault permeability the larger is the stress and strain perturbation beyond the pressurized patch propagation.
Overall, we observe roughly 2.4 times smaller displacement magnitudes at the injection point compared to the monitoring point. It is not obvious that such contrasts can be explained by differences in the fault strength measured on laboratory‐scale samples. Indeed, Thoeny (2014) conducted exhaustive shear tests in the laboratory on faults and reactivated bedding planes samples similar to the ones activated at the injec-tion point and found a coefficient of friction of 0.19 to 0.4. These values are in the same range as the values of 0.31‐to‐0.37 obtained by Orellana et al. (2018) for saturated gouge samples from the principal shear zone instrumented at the monitoring point. Thus, at the laboratory scale the principal shear zone is not signi fi-cantly weaker than the damage zone faults. However, its meter‐scale roughness characterized by asperities mainly related to two directions (parallel to bedding and oblique to bedding), its kilometer size extent and the variability of stress levels may explain its overall larger weakness at thefield scale. We speculate that the larger observed displacement at the monitoring point compared to the injection point caused by its smal-ler field‐scale strength as has been suggested from observations on different faults zones (Fang & Dunham, 2013).
7. Conclusion
Thefield scale fault activation experiment conducted in the low‐permeability Opalinus Clay in the Mont Terri Underground Research Laboratory (Switzerland) allowed the observation of fault rupture growth from afluid injection point in the fault damage zone to a monitoring point within the fault core. Continuous mea-surements of downhole three‐dimensional displacements coupled to fluid pressure changes were related to fault reactivation events and the potential for generating leakage pathways. We observed that significant pressure increases were required for the injected fluid to migrate through the initially almost
impermeable and mechanically weak fault planes connected to the injection source. Diffusion of injected fluid generated mixed mode rupture instability on the fault characterized by slip and opening of fractures associated with pressure transients. Our work suggests that the geometry of the fault zone is also a primary source of the rupture andflow complexity during fluid injection, which should be considered as a comple-mentary mechanism to current models of rupture propagation andfluid pressure diffusion in faults. This highly controlled and instrumented experiment showed details of the complex rupture processes related to highfluid pressures in a mature fault zone which are similar to those suggested from indirect observations on deep faults at reservoir and crustal scale. Our proposed explanation is that such dilatant deformation and channelingflow allow fluids to permeate along “closed” but heterogeneous fault zones, andfinally pressurize a sufficiently area to get shear failure. Our observations have important implications about the way we typically evaluate fault reactivation, and how such activation may lead to loss of integrity of shale caprock and host rock barriers. Indeed, our experiments suggest that whatever its orientation toward the regional stress, a fault can become a leakage pathway even when displacements are very small as long as there is a large enough pressurized patch. Thus, given its practical implications, these results are of importance to better estimate the leakage potential of faults affecting low‐permeability caprocks and highlight the need of investigating hydromechanical behavior of fault zone and local stress conditions at depth to characterize rupture and leakage mechanisms.
Finally, the injected volume in our experiments and the extent of the pressure perturbation were small com-pared to the size of the fault. Thus, upscaling these experimental results to larger scales is not a trivial chal-lenge. On the other hand, although this is afield experiment, our in situ observations were made at a laboratory scale resolution. Thus, our observations may help to contribute to close the gap between labora-tory scale and the tens‐of‐meter scales equivalent to fault rupture nucleation scales.
References
Amann, F., LeGonidec, Y., Senis, M., Gschwind, S., Wassermann, J., Nussbaum, C., & Sarout, J. (2018). Analysis of acoustic emissions recorded during a mine‐by experiment in an underground research laboratory in clay shales. International Journal of Rock Mechanics and Mining Sciences, 106, 51–59.
Amann, F., Wild, K., Loew, S., Yong, S., Thoeny, R., & Franck, E. (2017). Geomechanical behaviour of Opalinus Clay at multiple scales: results from Mont Terri rocl laboratory (Switzerland). Swiss Journal of Geosciences. https://doi.org/10.1007/s00015‐016‐0245‐0 Axen, G. J. (1992). Pore pressure, stress increase, and fault weakening in low‐angle normal faulting. Journal of Geophysical Research, 97(35),
8979–8991. https://doi.org/10.1029/92JB00517
Barton, C. A., Zoback, M. D., & Moos, D. (1995). Fluidflow along potentially active faults in crystalline rock. Geology, 23(8), 683–686. Barton, N., Bandis, S., Bakhtar, K. (1985). Strength, deformation and conductivity coupling of rock joints. International Journal of Rock
Mechanics and Mining Sciences and Geomechanics Abstracts, Vol. 22, N° 3, 121– 140.
Bock, H., Dehandschutter, B., Martin, C. D., Mazureck, M., Haller, A. D., Skoczylas, F., Davy, C. (2010). Self‐dealing of fractures in argil-laceous formations in the context of geological disposal of radioactive waste—Review and synthesis. OECD, NEA (N°6184). Bott, M. H. P. (1959). The mechanics of oblique slip faulting. Geological Magazine, 96, 109–117.
Cappa, F., Guglielmi, Y., Nussbaum, C., & Birkholzer, J. (2018). On the relationship between fault permeability increases, induced stress perturbation, and the growth of aseismic slip duringfluid injection. Geophysical Research Letters, 45, 11,012–11,020. https://doi.org/ 10.1029/2018GL080233
Choi, J. H., Edwards, P., Ko, K., & Kim, Y. S. (2016). Definition and classification of fault damage zones: A review and a new methodological approach. Earth‐Science Reviews, 152, 70–87.
Corkum, A. G., & Martin, C. D. (2007). Modelling a mine‐by test at the Mont Terri rock laboratory, Switzerland. International Journal of Rock Mechanics and Mining Sciences, 44, 846–859.
Cuss, R. J., Harrington, J. F., Noy, D. J., Sathar, S., & Norris, S. (2015). An experimental study of theflow of gas along synthetic faults of varying orientation to the stressfield: Implications for performance assessment of radioactive waste disposal. Journal of Geophysical Research‐ Solid Earth, 120, 3932–3945. https://doi.org/10.1002/2014JB011333
Doe, T., &Vietor, T. (2015). DS (Determination of stress) Experiment: Review of in situ stress measurements and their context. Synthesis report, Mont Terri Technical Report TR 2012‐06. Federal Office of Topography (Swisstopo), Wabern, Switzerland. www.mont‐terri.ch Ellsworth, W. (2013). Injection‐induced earthquakes. Science, 341.
Evans, K. F. (2005). Permeability creation and damage due to massivefluid injections into granite at 3.5 km at Soultz: 2. Critical stress and fracture strength. Journal of Geophysical Research, 110, B04204. https://doi.org/10.1029/2004JB003169
Fang, Z., & Dunham, E. M. (2013). Additional shear resistance from fault roughness and stress levels on geometrically complex faults. Journal of Geophysical Research‐ Solid Earth, 118, 3642–3654. https://doi.org/10.1002/jgrb.50262
Faoro, I., Niemeijer, A., Marone, C., & Elsworth, D. (2009). Influence of shear and deviatoric stress on the evolution of permeability in fractured rock. Journal of Geophysical Research, 114, B01201. https://doi.org/10.1029/2007/JB005372
Faulkner, D. R., Lewis, A. C., & Rutter, E. H. (2003). On the internal structure and mechanics of large strike‐slip faults: Field observations from the Carboneras fault, southeastern Spain. Tectonophysics, 367, 235–251.
Faulkner, D. R., Mitchell, T. M., Healy, D., & Heap, M. J. (2006). Slip on“weak” faults by the rotation of regional stress in the fracture damage zone. Nature, 444. https://doi.org/10.1038/nature05353
Faulkner, D. R., & Rutter, E. H. (2001). Can the maintenance of overpressuredfluids in large strike‐slip fault zones explain their apparent weakness? Geology, 29, 503–506. https://doi.org/10.1130/0091‐7613(2001)029<0503:CTMOOF>2.0.CO;2
Acknowledgments
The authors are deeply grateful to the four partners of the Mont Terri Project that contributed to the funding of the FS experiment: the Swiss Federal Office of Topography (Swisstopo), the Swiss Federal Nuclear Safety Inspectorate (ENSI), the Japanese Atomic Energy Agency (JAEA), and the U.S. Department of Energy. The Mont Terri Project is an international research project for the hydrogeological, geochemical, and geotechnical characterizations of a clay formation (Opalinus Clay). Funding for Berkeley Lab's analysis of the FS data described in this study was provided by the Assistant Secretary for Fossil Energy as part of the Core Carbon Storage and Monitoring Research (CCSMR) and National Risk Assessment Partnership (NRAP) programs of the U.S. Department of Energy under Contract DEAC02‐05CH11231. We thank the Editor, D. Schmitt, and the anonymous reviewers for insightful input that improved this paper. Experimental data are available in the supporting information.