HAL Id: hal-02624593
https://hal.inrae.fr/hal-02624593
Submitted on 26 May 2020
HAL is a multi-disciplinary open access
archive for the deposit and dissemination of
sci-entific research documents, whether they are
pub-lished or not. The documents may come from
teaching and research institutions in France or
abroad, or from public or private research centers.
L’archive ouverte pluridisciplinaire HAL, est
destinée au dépôt et à la diffusion de documents
scientifiques de niveau recherche, publiés ou non,
émanant des établissements d’enseignement et de
recherche français ou étrangers, des laboratoires
publics ou privés.
Distributed under a Creative Commons Attribution| 4.0 International License
Beverage consumption patterns among 4-19 y old
children in 2009-14 NHANES show that the milk and
100% juice pattern is associated with better diets
Mathieu Maillot, Colin D. Rehm, Florent Vieux, Chelsea M. Rose, Adam
Drewnowski
To cite this version:
Mathieu Maillot, Colin D. Rehm, Florent Vieux, Chelsea M. Rose, Adam Drewnowski. Beverage
con-sumption patterns among 4-19 y old children in 2009-14 NHANES show that the milk and 100% juice
pattern is associated with better diets. Nutrition Journal, BioMed Central, 2018, 17,
�10.1186/s12937-018-0363-9�. �hal-02624593�
R E S E A R C H
Open Access
Beverage consumption patterns among
4
–19 y old children in 2009–14 NHANES
show that the milk and 100% juice pattern
is associated with better diets
Matthieu Maillot
1, Colin D. Rehm
2, Florent Vieux
1, Chelsea M. Rose
3and Adam Drewnowski
3*Abstract
Background: Patterns of beverage consumption among children and adolescents can be indicative of food choices and total diet quality.
Methods: Analyses of beverage consumption patterns among 8119 children aged 4–19 y were based on the first 24-h recall of the National Health and Nutrition Examination Survey (2009–14 NHANES). Four pre-defined beverage patterns were: 1) milk pattern; 2) 100% juice pattern; 3) milk and 100% juice pattern; and 4) other caloric
beverages. Food- and nutrient-based diet quality measures included the Healthy Eating Index 2010.
Results: Most children drank other caloric beverages, as opposed to milk (17.8%), 100% juice (5.6%), or milk and 100% juice (13.5%). Drinkers of milk and 100% juice had diets that did not differ from each other in total calories, total and added sugars, fiber, or vitamin E. Milk drinkers consumed more dairy and had higher intakes of calcium, potassium, vitamin A and vitamin D as compared to all other patterns. Juice drinkers consumed more total fruit, same amounts of whole fruit, and had higher intakes of vitamin C as compared to the other consumption patterns. Drinkers of both milk and 100% juice had the highest HEI 2010 scores of all the consumption patterns. Conclusions: Beverage consumption patterns built around milk and/or 100% juice were relatively uncommon. Promoting the drinking of milk and 100% juice, in preference to other caloric beverages, may be an effective strategy to improve children’s diet quality. Restricting milk and 100% juice consumption may encourage the selection of other caloric beverages.
Keywords: Milk, 100% juice, Beverage consumption, Children, Diet quality Background
The place of milk and 100% fruit juice in U.S. children’s diets continues to be a topic of debate [1]. The con-sumption of whole milk and 100% fruit juice by young children has been linked to higher body weight in some studies [2, 3], though not in others [4, 5]. To prevent excess weight gain, the American Academy of Pediatrics (AAP) recommends that children switch to low-fat or non-fat milk after the age of 2 y [6]. The AAP has also
set limits on the consumption of 100% juices. The sug-gested amounts are 4–6 oz./d for children aged 4–6 y and up to 8 oz./d for children aged 7–18 y [7].
The current trend in nutritional epidemiology is to examine food and beverage patterns as opposed to indi-vidual nutrients, foods, or dietary ingredients [8–12]. Most published studies have explored children’s bever-age consumption, a dependent variable, by gender, bever-age subgroup, household income, or race/ethnicity [13–15]. Classifying children by their beverage consumption pat-terns is a relatively novel approach.
The present analyses, based on the three most recent cycles of the National Health and Nutrition Examination Survey (NHANES 2009–2014), identified children aged
* Correspondence:adamdrew@uw.edu
3Center for Public Health Nutrition, University of Washington, Box 353410,
Seattle, WA 98195, USA
Full list of author information is available at the end of the article
© The Author(s). 2018 Open Access This article is distributed under the terms of the Creative Commons Attribution 4.0 International License (http://creativecommons.org/licenses/by/4.0/), which permits unrestricted use, distribution, and reproduction in any medium, provided you give appropriate credit to the original author(s) and the source, provide a link to the Creative Commons license, and indicate if changes were made. The Creative Commons Public Domain Dedication waiver (http://creativecommons.org/publicdomain/zero/1.0/) applies to the data made available in this article, unless otherwise stated.
4–19 y whose beverage drinking patterns were built around 1) milk and milk beverages, 2) 100% juices, and 3) milk and 100% juices. Their diet quality was then compared to that of children who drank other caloric beverages in preference to milk or 100% juice.
The primary hypothesis was that beverage drinking patterns characterized by milk and/or 100% juice would be associated with better dietary choices and higher quality diets. The secondary hypothesis was that bever-age patterns featuring both milk and 100% juice would be associated with best dietary nutritional profiles and with highest Healthy Eating Index (HEI 2010) scores, a composite measure of diet quality.
Methods
The 2009–14 NHANES sample
Dietary intake data came from 3 cycles of the National Health and Nutrition Examination Survey (2009–10, 2011–12 and 2013–14 NHANES). Data from 2013 to 2014 NHANES were released in October 2016. Data analyses, based on the first-day single 24-h recall, were conducted for the entire population (4–19 y, n = 8119) and separately by age group: 4–8 y, 9–13 y, and 14–19 y.
Dietary intake assessment
The NHANES 24-h recall multi-pass method, conducted by a trained interviewer [16, 17], captured types and amounts of all food and beverages consumed during the previous 24-h, along with the time and occasion for each food item. For children aged 4–5 y the dietary recall was completed by a proxy respondent (parent or guardian). For children 6–11 y, the child was the primary respond-ent, but a proxy respondent was present and able to assist. Children aged 12–19 y were the primary respon-dents, but could be assisted by an adult when needed.
Classification of beverages
Beverages were classified into 14 categories following the USDA coding scheme: milk and milk beverages, cit-rus juices, apple juices (including fruit juice blends), other non-citrus juices, soda (regular & diet), fruit drinks (regular & diet), sports and energy drinks (regular & diet), vegetable juice, water (bottled & tap), flavored and enhanced water, alcoholic bever-ages, coffee, tea, and meal replacement beverages (See Additional file 1: Table S1).
The milk category included whole milk, 2%, 1%, skim, flavored milk, and nutritionally equivalent milk alterna-tives, but excluded milkshakes, eggnog, and Yoo-Hoo type milk drinks. Milk consumers were defined as those consuming milk as a beverage, and not e.g. with cereal, using NHANES food combination codes.
The 100% juices included citrus juices, apple juice, and non-citrus juices, and vegetable juices. The 100% fruit
juice blends (e.g. apple-cranberry) were included but sweetened fruit-based drinks with added sugars were not. All the remaining beverages were classified as “other.” Drinking water (bottled and tap) was excluded, as were alcohol and meal replacements.
Classification of beverage consumption patterns
Children can consume multiple beverages within a 24-h period. Beverage consumption patterns were categorized into 4 groups 1) milk and milk beverages pattern (no 100% juice); 2) 100% juice pattern (no milk); 3) milk and 100% juice pattern; and 4) other beverages pattern. To be assigned to the milk and/or 100% juice patterns, the consumption of milk and/or 100% juice (separate or joint) had to exceed the consumption of all other caloric beverages. A similar method had been used to identify drinkers of regular and diet sodas [18]. The groups were characterized as 1) milk drinkers; 2) 100% juice drinkers; 3) milk and 100% juice drinkers and 4) drinkers of other caloric beverages. Given the widespread use of caloric beverages, we expected the milk and/or 100% juice bev-erage patterns to be relatively infrequent.
Analytic approach
Dietary outcomes of interest were: dietary energy (kcal), total sugars (grams), added sugars (teaspoon equiva-lents), calcium (mg), vitamin D (mcg), vitamin A (IU), vitamin E (mcg), vitamin C (mg), potassium (mg), and fiber (g). Food groups of interest were dairy products (milk, yogurts and cheese), total fruit (whole fruit and fruit juice) and whole fruit, and total vegetables. The Healthy Eating Index 2010 (HEI 2010) was the princi-pal measure of diet quality. The HEI measures com-pliance with the Dietary Guidelines for Americans along a 100-point scale and food group components are represented as “cup-equivalents.” For example, 1 cup-equivalent of milk or juice equals 1 cup (237 ml). All analyses accounted for the complex survey design of NHANES data and are representative of the US population. Data analyses were conducted using Stata 13.1 (College Station, TX) and SAS 9.4 (SAS institute, Cary, NC).
Funding
Funding for these analyses of publicly available federal data was provided by the Dr. Pepper Snapple group.
Results
Four out of five children (82.0%) drank multiple bever-ages on the same day. Out of 8119 children, 1209 (17.8%) showed the milk pattern; 543 (5.6%) showed the 100% juice pattern, and 1081 (13.5%) showed the milk and 100% juice pattern. The majority of children (5286
or 63.2%) drank other caloric beverages, with smaller amounts of milk, juice, or both.
Beverage patterns
The NHANES sample was evenly split between boys (4160 or 51.0%) and girls (3959 or 49.0%). Beverage con-sumption patterns varied by gender (p = 0.0008) and age group (p< 0.001). The milk pattern was more common among boys than among girls (54.1 vs. 45.9%); the 100% juice pattern was more common among girls than among boys (57.7 vs. 42.3%), consistent with past studies [19–21]. Other caloric beverages were consumed equally by both boys and girls (49.6% male vs. 50.4% female). The prevalence of the milk and 100% juice pattern dropped precipitously with age (from 60.8 to 14.3%), whereas the consumption of other caloric beverages in-creased (21.4 to 48.0%), doubling from the 4–8 y to the 14–19 y age group.
Milk drinkers drank 511.4 g of milk (95% CI: 478.8, 544.1) and 151.2 g of other beverages (95% CI: 127.5, 174.9), but no 100% juice. Juice drinkers drank 404.3 g of juice (95% CI: 365.7, 442.9) and 102.8 g of other bev-erages (95% CI: 78.4, 127.1) but no milk. Milk and juice drinkers drank 376.5 g of milk (95% CI: 350.4, 402.5), 274.5 g of juice (95% CI: 258.2, 290.7) and 155.2 g of other beverages (95% CI: 135.9, 174.4). Most children (63%) drank large volumes of other beverages (758.7 g (95% CI:729.8, 787.6)) but negligible amounts of either milk (89.3 g (95% CI: 80.7, 98.0)) or 100% juice (38.2 g (95%CI: 31.4, 45.1)).
Milk drinkers derived 15.3% of energy from milk; juice drinkers derived 11.6% energy from 100% juice. Drinkers of milk and juice derived 17.6% energy from those two beverages combined. No significant relation with age was observed. By contrast the amounts of other caloric beverages increased sharply with age: from 11.8% energy in young children to 15.1% energy in adolescents. Chil-dren who drank 100% juice had energy intakes that were lower when compared to drinkers of other beverages.
Drinkers of milk and 100% juice consumed amounts of 100% juice that were close to AAP guidelines:
250 g for 4–8 y (95% CI: 231.4, 268.9), 270 g for
9–13 y (95% CI: 253.0, 285.6) and 386 g for 14–19 y (95% CI: 313.5, 460.1). The age-related increase in consumption was modest for milk drinkers (milk 457 to 610 g, p for trend < 0.001) and for 100% juice drinkers (FJ 346 to 477 g, p for trend = 0.007), but very sharp for other beverages (502 to 950 g, p for trend < 0.001).
Diet quality among the beverage patterns
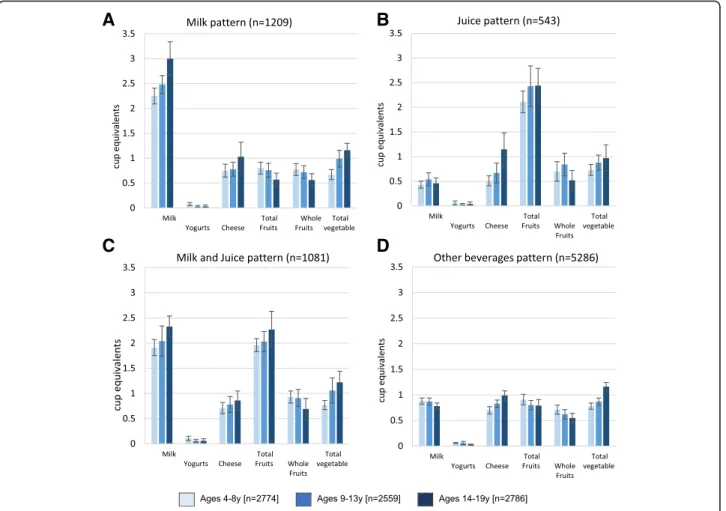
Table 1 shows that children classified as milk drinkers had diets with 3.44 cup-eq/day of dairy, largely from milk (2.53 cup-eq). Their consumption of milk (but not
yogurt or cheese) was higher compared to 100% juice drinkers (0.47 cup-eq, p < 0.001) or drinkers of other beverages (0.83 cup-eq,p < 0.001).
Children classified as 100% juice drinkers had diets with 2.31 cup-eq of total fruit (including 0.68 cup-eq whole fruit). Importantly, their diets were not reduced in whole fruit. Milk drinkers and juice drinkers ate compar-able amounts of vegetcompar-ables (p = 0.999).
Drinkers of milk and 100% juice had diets with 2.85 cup-eq of dairy, 2.02 cup-eq of total fruit, including 0.89 cup-eq of whole fruit. This group also had the highest HEI 2010 scores (55.70), compared to juice drinkers (52.44,p = 0.005), milk drinkers (49.65, p < 0.001) and to children who drank neither milk nor 100% juice (44.36, p < 0.001).
Figure1 shows that comparable effects were observed across all age groups. Drinkers of milk, 100% juice or both had higher quality diets as compared to drinkers of other caloric beverages. Drinkers of both milk and 100% juice had the highest HEI 2010 scores.
Table 1 also shows that there were no significant dif-ferences between milk and 100% juice drinkers in terms of total energy (1924 vs. 1798 kcal/d, p = 0.241); total sugars (108.6 vs. 109.3 g, p = 0.153); added sugars (13.4 vs. 11.0 tsp-eq, p = 0.250), or fiber (14.8 vs. 14.5 g, p = 0.999). Milk drinkers consumed more calcium (1379 mg vs 920 mg), vitamin A (792 vs. 499 IU, p < 0.001) and vitamin D (9.1 vs. 3.9 mcg, p < 0.001) than did juice drinkers. Diets of juice drinkers were higher in vitamin C (144 vs. 47 mg,p < 0.001). There were no differences in vitamin E (p = 0.999).
Children classified as drinkers of milk and 100% juice had more nutrient-rich diets than did drinkers of either milk or 100% juice alone. Their potassium intakes were higher than for the other 3 beverage patterns (p < 0.001), calcium was higher than for juice (p < 0.001) or for other beverages (p < 0.001). Intakes of calcium (p < 0.029), vitamin A (p < 0.001), and vitamin D (p < 0.001) were higher than for milk drinkers. The diet’s content of vita-min C (118 mg/d) was higher than for milk drinkers (47 mg/d, p < 0.001) but not as high as for juice (144 mg/d, p < 0.001). Drinkers of other beverages had the highest-energy diets with most added sugar.
HEI 2010 scores were highest for the milk and 100% juice pattern (55.70), followed by the juice pattern (52.44), and then by milk pattern (49.65) and other bev-erages (44.36).
Figure 2 shows that the drinkers of milk and 100% juice had the highest HEI 2010 scores. Whereas milk-based patterns provided more calcium, juice based patterns were associated with more vitamin C. Drinking both milk and juice was associated with higher levels of calcium and vitamin C. By contrast, beverage patterns built around other caloric beverages provided the most
added sugar, the consumption of which sharply in-creased with age.
Discussion
Stratifying NHANES participants by beverage drinking patterns is less common than exploring beverage consumption by gender, age group, or race/ethnicity [22–26]. The present analyses assigned children into four categories: milk drinkers, 100% juice drinkers, milk and 100% juice drinkers, and drinkers of other caloric beverages. For most children, other caloric beverages were the overwhelming beverage of choice; the milk and/or 100% juice drinking patterns were relatively in-frequent. Furthermore, the consumption of other caloric beverages sharply increased with age, displacing both milk and 100% juice.
HEI 2010 scores for milk drinkers and 100% juice drinkers were comparable. Milk drinkers consumed more dairy products than did juice drinkers; juice drinkers con-sumed more total fruit and comparable amounts of whole fruit. Milk drinking did not reduce consumption of yogurt
and cheese; juice drinking did not cut into the eating of whole fruit. Diets of milk drinkers and juice drinkers did not differ in terms of energy, total or added sugars, fiber, or vitamin E. Diets of milk drinkers were higher in cal-cium, potassium, vitamin A and vitamin D than those of juice drinkers. Diets of juice drinkers were higher in vita-min C than those of milk drinkers.
Children rarely limit their drinking choices to a single beverage. The present analyses identified children whose drinking patterns were built around milk and 100% juice, with smaller amounts of other caloric beverages. That group had diets that were close to the dietary recom-mendations for both dairy (2.85 servings) and for total fruit (2.0 servings). This composite beverage pattern fea-turing both milk and 100% juice was associated with higher intakes of calcium, potassium, vitamin A and vitamin D along with vitamin C and with the highest HEI 2010 scores. Importantly, drinkers of milk and 100% juice consumed amounts of 100% juice that were close to AAP guidelines: 250 g for 4-8 y, 270 g for 9–13 y and 386 g for 14-19 y. The 100% juice drinkers had
Table 1 Food patterns, energy, and selected nutrients for drinkers of milk, 100% juice, milk and 100% juice, and other beverages NHANES 2011–2014: Ages 4-19 y [n = 8119]
Milk Pattern 100% Juice Pattern Milk and 100% Juice Pattern Other Beverages Pattern pa
Adb
n = 1209 n = 543 n = 1081 n = 5286
Mean 95% CI Mean 95% CI Mean 95% CI Mean 95% CI Food groups and HEI
Total Dairy (cup-eq) 3.44 3.25 3.63 1.30 1.13 1.48 2.85 2.69 3.01 1.76 1.70 1.83 <.001 <.001 Milk (cup-eq) 2.53 2.39 2.67 0.47 0.42 0.52 2.00 1.87 2.13 0.83 0.79 0.87 <.001 <.001 Yogurts (cup-eq) 0.05 0.03 0.06 0.04 0.02 0.06 0.09 0.06 0.12 0.04 0.03 0.05 0.007 0.012 Cheese (cup-eq) 0.84 0.74 0.94 0.78 0.62 0.94 0.75 0.65 0.84 0.88 0.83 0.93 0.034 0.120 Total Fruits (cup-eq) 0.72 0.65 0.80 2.31 2.15 2.48 2.02 1.92 2.12 0.82 0.74 0.89 <.001 <.001 Whole Fruits (cup-eq) 0.70 0.62 0.77 0.68 0.55 0.81 0.89 0.81 0.97 0.60 0.54 0.67 <.001 0.001 Total vegetable (cup-eq) 0.91 0.81 1.00 0.86 0.75 0.96 0.91 0.82 1.00 0.99 0.95 1.03 0.034 0.33 HEI 2010 49.65 48.79 50.51 52.44 51.09 53.79 55.70 54.36 57.04 44.36 43.69 45.02 <.001 <.001 Energy and nutrients
Energy (kcal) 1924 1828 2020 1798 1718 1879 1998 1933 2063 2029 1991 2066 <.001 – Total sugars (g) 109 104 113 109 103 115 133 129 137 130 127 134 <.001 <.001 Added sugars (teaspoon eq) 13 13 14 11 10 12 14 13 15 23 22 24 <.001 <.001 Fiber (g) 15 14 16 15 14 15 15 15 16 14 14 14 0.008 <.001 Calcium (mg) 1379 1308 1450 920 837 1004 1314 1262 1366 934 909 958 <.001 <.001 Potassium (mg) 2475 2339 2611 2182 2069 2295 2713 2629 2796 2100 2058 2142 <.001 <.001 Vitamin A (IU) 796 753 839 499 461 538 698 660 736 527 510 545 <.001 <.001 Vitamin C (mg) 47 40 54 144 130 158 118 111 124 70 66 75 <.001 <.001 Vitamin D (mcg) 9 9 10 4 3 4 8 8 9 4 4 4 <.001 <.001 Vitamin E (mcg) 7 6 8 7 6 7 7 6 7 7 7 8 0.032 0.008 a
unadjusted regression models
b
regression models adjusted for gender, poverty level and total dietary energy
energy intakes that were actually lower when compared to drinkers of other beverages [6].
It should be noted that the milk pattern was strongly age-dependent; milk consumption typically decreases with age. The juice pattern showed less of an age de-pendence; typically 100% apple juice consumed in child-hood is replaced by more citrus juices in adolescence. However, both patterns were vulnerable to a dramatic age-related increase in other beverages, with substantial amounts of added sugars.
The current dietary recommendations are for older children and teens to limit fruit juice to only one of the recommended 2 to 2 ½ cups of fruit servings per day. In the present analysis, the consumption of more than 2 fruit servings per day was only observed among exclusive or predominant 100% juice drinkers. There was no evidence in the present cross-sectional data that juice drinkers ate less whole fruit. In past studies, a combination of whole fruit and 100% juice was an effective way to address fruit shortfall, without increasing diet cost [27].
The current dietary recommendations are to replace whole milk with low fat or skim starting at age 2 y. It should be noted that milk drinking patterns follow a so-cioeconomic gradient. More whole milk is consumed by groups of lower socioeconomic status (SES); higher SES groups drink more low-fat and nonfat milk [19]. Lower SES groups also drink more 100% fruit juice, whereas higher SES groups eat more whole fruit. Higher SES groups drink more plain water (bottled and tap) [28]. Linking the consumption of selected beverages with health outcomes may not have adequately accounted for all the potential (and mostly unobserved) socioeconomic determinants of body weight and health [8].
The study had limitations. First, the data were based on self-report, including proxy report for younger chil-dren. However, that is a characteristic of the NHANES database, still the basis for food and nutrition policy in the US. Second, a single 24-h recall may not be sufficient to separate regular consumers from non-consumers; the database only provides beverage patterns on that particular day [21]. Third, the algorithm to identify
A
B
C
D
predominant consumption of milk, 100% fruit juice or both was based on weight, as opposed to calories. How-ever, most beverages other than diet beverages or skim milk, are of comparable energy density (< 1 kcal/g). Finally, the HEI 2010 score, technically a measure of compliance with the 2010 Dietary Guidelines, may not capture the multiple components of a healthy diet.
Conclusions
In summary, beverage patterns built around milk and/or 100% juice were relatively rare. Most US children drank other caloric beverages. Yet beverage drinking patterns built around milk and 100% juice were associated with better dietary choices and highest quality diets. Dietary intervention strategies ought to promote rather than re-strict milk and 100% juice. Based on the current ana-lyses, milk and 100% juice, along with plain, drinking water should be the main beverages of choice.
Additional file
Additional file 1:Table S1. Common varieties by beverage category. (DOCX 15 kb)
Abbreviations
AAP:American Academy of Pediatrics; HEI: Healthy Eating Index; NHANES: National Health and Nutrition Examination Survey
Funding
Funding for these analyses of publicly available federal data was provided by the Dr. Pepper Snapple group.
Availability of data and materials
NHANES data are publicly available on the NCHS website (URL:https:// www.cdc.gov/nchs/nhanes/nhanes_questionnaires.htm). Analysis of publicly available data are exempt from IRB review at the University of Washington.
Author’s contributions
MM, FV, CDR, FV, and AD designed the study. CDR developed the databases. MM and FV conducted the analyses. AD took the lead on writing the paper,
A
B
C
D
Fig. 2 a-d: HEI and nutrient intakes by beverage pattern and by age group, NHANES 2011–2014
along with CMR. All authors have responsibility for final contact. All authors read and approved the final manuscript.
Ethics approval and consent to participate
NHANES data are publicly available on the NCHS website (URL:https:// www.cdc.gov/nchs/nhanes/nhanes_questionnaires.htm). Analysis of publicly available data are exempt from IRB review at the University of Washington.
Competing interests
AD: Has received grants, contracts, and honoraria from private industry, foundations, and public agencies on projects on nutrient profiling, diet and health.
FV and MM: are employed by MS-Nutrition.
CMR and CDR: have no competing interests to disclose.
Publisher’s Note
Springer Nature remains neutral with regard to jurisdictional claims in published maps and institutional affiliations.
Author details
1
MS-Nutrition, 27 bld Jean Moulin Faculté de Médecine la Timone, Laboratoire NORT, 13385 Marseille cedex 5, France.2Albert Einstein College
of Medicine, Montefiore Medical Center, New York, NY 10467, USA.3Center for Public Health Nutrition, University of Washington, Box 353410, Seattle, WA 98195, USA.
Received: 28 December 2017 Accepted: 13 May 2018
References
1. Heyman MB, Abrams SA. Fruit juice in infants, children, and adolescents: current recommendations. Pediatrics. 2017:e20170967.
2. Shefferly A, Scharf RJ, DeBoer MD. Longitudinal evaluation of 100% fruit juice consumption on BMI status in 2–5-year-old children. Pediatric obesity. 2016;11:221–7.
3. LaRowe TL, Moeller SM, Adams AK. Beverage patterns, diet quality, and body mass index of US preschool and school-aged children. J Am Diet Assoc. 2007;107:1124–33.
4. Auerbach BJ, Wolf FM, Hikida A, Vallila-Buchman P, Littman A, Thompson D, Louden D, Taber DR, Krieger J. Fruit juice and change in BMI: a meta-analysis. Pediatrics. 2017;139:e20162454.
5. Rolland-Cachera MF, Akrout M, Péneau S. Nutrient intakes in early life and risk of obesity. Int J Environ Res Public Health. 2016;13:564.
6. Gidding SS, Dennison BA, Birch LL, Daniels SR, Gilman MW, Lichtenstein AH, Rattay KT, Steinberger J, Stettler N, Van Horn L. Dietary recommendations for children and adolescents: a guide for practitioners. Pediatrics. 2006;117: 544–59.
7. Baker SS, Cochran WJ, Greer FR, Heyman MB, Jacobson MS, Jaksic T, Krebs NF, Blum-kemelor D, Dietz W, Grave G. The use and misuse of fruit juice in pediatrics. Pediatrics. 2001;107:1210–3.
8. Aggarwal A, Monsivais P, Drewnowski A. Nutrient intakes linked to better health outcomes are associated with higher diet costs in the US. PLoS One. 2012;7:e37533.
9. Rose CM, Savage JS, Birch LL. Patterns of early dietary exposures have implications for maternal and child weight outcomes. Obesity. 2016;24:430–8. 10. Santos LP, Assunção MCF, Matijasevich A, Santos IS, Barros AJ. Dietary intake
patterns of children aged 6 years and their association with socioeconomic and demographic characteristics, early feeding practices and body mass index. BMC Public Health. 2016;16:1055.
11. Hamner HC, Perrine CG, Gupta PM, Herrick KA, Cogswell ME. Dietary patterns among children birth to 23 months of age, NHANES 2009-2014. J Nutr Educ Behav. 2017;49:S1.
12. Mikkilä V, Vepsäläinen H, Saloheimo T, Gonzalez S, Meisel J, Hu G, Champagne CM, Chaput J-P, Church TS, Katzmarzyk PT. An international comparison of dietary patterns in 9–11-year-old children. International journal of obesity supplements. 2015;5:S17.
13. Mesirow MS, Welsh JA: Changing beverage consumption patterns have resulted in fewer liquid calories in the diets of US children: National Health and nutrition examination survey 2001-2010. J Acad Nutr Diet. 2015; 115: 559–566. e554.
14. Wang YC, Bleich SN, Gortmaker SL. Increasing caloric contribution from sugar-sweetened beverages and 100% fruit juices among US children and adolescents, 1988–2004. Pediatrics. 2008;121:e1604–14.
15. Ford CN, Ng SW, Popkin BM. Ten-year beverage intake trends among US preschool children: rapid declines between 2003 and 2010 but stagnancy in recent years. Pediatric obesity. 2016;11:47–53.
16. Blanton CA, Moshfegh AJ, Baer DJ, Kretsch MJ. The USDA automated multiple-pass method accurately estimates group total energy and nutrient intake. J Nutr. 2006;136:2594–9.
17. Moshfegh AJ, Rhodes DG, Baer DJ, Murayi T, Clemens JC, Rumpler WV, Paul DR, Sebastian RS, Kuczynski KJ, Ingwersen LA. The US Department of Agriculture Automated Multiple-Pass Method reduces bias in the collection of energy intakes. Am J Clin Nutr. 2008;88:324–32.
18. Drewnowski A, Rehm CD. Consumption of low-calorie sweeteners among US adults is associated with higher healthy eating index (HEI 2005) scores and more physical activity. Nutrients. 2014;6:4389–403.
19. Kit BK, Carroll MD, Ogden CL. Low-fat milk consumption among children and adolescents in the United States, 2007–2008. Centers for Disease Control and Prevention, National Center for Health Statistics: US Department of Health and Human Services; 2011.
20. Murphy MM, Douglass JS, Johnson RK, Spence LA. Drinking flavored or plain milk is positively associated with nutrient intake and is not associated with adverse effects on weight status in US children and adolescents. J Am Diet Assoc. 2008;108:631–9.
21. Ahluwalia N, Dwyer J, Terry A, Moshfegh A, Johnson C. Update on NHANES dietary data: focus on collection, release, analytical considerations, and uses to inform public policy. Advances in Nutrition: An International Review Journal. 2016;7:121–34.
22. Kant AK, Graubard BI. Energy density of diets reported by American adults: association with food group intake, nutrient intake, and body weight. Int J Obes. 2005;29:950.
23. Drewnowski A, Rehm CD. Consumption of added sugars among US children and adults by food purchase location and food source. Am J Clin Nutr. 2014;100:901–7.
24. Virudachalam S, Long JA, Harhay MO, Polsky DE, Feudtner C. Prevalence and patterns of cooking dinner at home in the USA: National Health and nutrition examination survey (NHANES) 2007–2008. Public Health Nutr. 2014; 17:1022–30.
25. Wang DD, Leung CW, Li Y, Ding EL, Chiuve SE, Hu FB, Willett WC. Trends in dietary quality among adults in the United States, 1999 through 2010. JAMA Intern Med. 2014;174:1587–95.
26. Ahluwalia N, Herrick KA, Rossen LM, Rhodes D, Kit B, Moshfegh A, Dodd KW. Usual nutrient intakes of us infants and toddlers generally meet or exceed dietary reference intakes: findings from NHANES 2009–2012. Am J Clin Nutr. 2016;104:1167–74.
27. Rehm CD, Drewnowski A. Dietary and economic effects of eliminating shortfall in fruit intake on nutrient intakes and diet cost. BMC Pediatr. 2016;16:83.
28. Dubowitz T, Heron M, Bird CE, Lurie N, Finch BK, Basurto-Dávila R, Hale L, Escarce JJ. Neighborhood socioeconomic status and fruit and vegetable intake among whites, blacks, and Mexican Americans in the United States. Am J Clin Nutr. 2008;87:1883–91.