HAL Id: hal-01419527
https://hal-amu.archives-ouvertes.fr/hal-01419527
Submitted on 6 Jan 2017
HAL is a multi-disciplinary open access
archive for the deposit and dissemination of
sci-entific research documents, whether they are
pub-lished or not. The documents may come from
teaching and research institutions in France or
abroad, or from public or private research centers.
L’archive ouverte pluridisciplinaire HAL, est
destinée au dépôt et à la diffusion de documents
scientifiques de niveau recherche, publiés ou non,
émanant des établissements d’enseignement et de
recherche français ou étrangers, des laboratoires
publics ou privés.
The geomagnetic dipole moment variation between 250
and 800 ka BP reconstructed from the authigenic
10Be/9Be signature in West Equatorial Pacific sediments
Lucie Ménabréaz, Nicolas Thouveny, Didier Bourlès, Laurence Vidal
To cite this version:
Lucie Ménabréaz, Nicolas Thouveny, Didier Bourlès, Laurence Vidal. The geomagnetic dipole moment
variation between 250 and 800 ka BP reconstructed from the authigenic 10Be/9Be signature in West
Equatorial Pacific sediments. Earth and Planetary Science Letters, Elsevier, 2014, 385, pp.190-205.
�10.1016/j.epsl.2013.10.037�. �hal-01419527�
The geomagnetic dipole moment variation between 250 and 800 ka BP
reconstructed from the authigenic 10Be/9Be signature in West
Equatorial Pacific sediments
Lucie Ménabréaz
∗
, Nicolas Thouveny, Didier L. Bourlès, Laurence Vidal
Aix-Marseille Université, CNRS, IRD, CEREGE UM 34, Technopôle de l’Environnement Arbois-Méditerranée, BP80, 13545 Aix-en-Provence, France
Keywords:
marine sediment geochemistr, 10Be cosmogenic production, geomagnetic dipole moment , Brunhes
paleomagnetic excursions Brunhes/Matuyama transition
The authigenic 10Be/9Be ratio, proxy of the cosmogenic radionuclide 10Be production rate in the atmosphere, was measured in sediments deposited in the West Equatorial Pacific (Gulf of Papua; 10◦25 S; 146◦15 E), in order to reconstruct the geomagnetic dipole moment variations in the 250–800 ka time
interval, independently from paleomagnetic methods. The pelagic clayey-carbonate muds continuously deposited between marine isotope stages 8 and 20 were subsampled every 10 cm. The 10Be production rate record reconstructed for the 250–800 ka interval is described and compared over the same time interval with global paleomagnetic stacks (SINT-2000 and PISO-1500). The highlighted cosmogenic 10Be overproductions appear to be triggered by the series of Geomagnetic Dipole Lows (GDL) that have occurred since the Brunhes–Matuyama reversal. Calibration using absolute values of the geomagnetic dipole moment drawn from a paleomagnetic database produces a new record of the dipole moment variations over the 250–800 ka time interval. The timing and amplitude of the GDL succession revealed by such records will contribute to improving knowledge of the geodynamo rhythms and rate of changes at millennial to million year scales.
1. Introduction
Reconstructing past intensity variations in the Earth’s magnetic
field over the last million years is necessary in order to better
understand planetary magnetic field dynamics, and hence the
pro-cesses that govern the geodynamo. Accurate records of past
geo-dynamo rhythms are also fundamental to understand present-day
geomagnetic field behaviour, and thus to better predict its future
dynamics and adapt our societal responses. Current knowledge
about the geomagnetic dipole moment variation at millennial or
longer time scales has until now been deduced mainly from
pa-leomagnetic investigations. Relative PaleoIntensity (RPI) variations
recorded in sediment archives provide nearly continuous time
se-ries of the Virtual (Axial) Dipole Moment (V(A)DM), while
paleoin-tensity determinations performed on lava flows provide
discontin-uous series of absolute V(A)DM values (see Tauxe, 1993 and Valet,
2003 for comprehensive reviews).
Sedimentary paleomagnetic records can, however, be biased by
magnetization acquisition processes such as delayed remanence
acquisition and/or progressive magnetization lock-in after
sedi-ment deposition (e.g. Coe and Liddicoat, 1994; Roberts and
Win-klhofer, 2004). Normalized intensity records can also be affected
*
Corresponding author. Tel.: +33 04 42 97 15 08; fax: +33 04 42 97 15 95.E-mail address: menabreaz@cerege.fr (L. Ménabréaz).
by paleoclimatic and paleoenvironmental contamination. This has
led to questioning of the geomagnetic significance of relative
pale-ointensity records (e.g. Channell et al., 1998; Guyodo et al., 2000;
Xuan and Channell, 2008) and to the development of strategies
to reduce such influences (e.g. Tauxe et al., 2006; Hofmann and
Fabian, 2009).
The most common strategy consists in compiling single RPI
records obtained from several varied sediment sequences, and
us-ing statistical filterus-ing and smoothus-ing methods to produce mean
normalized RPI records of regional or global significance. Such
re-gional stacks (e.g. Laj et al., 2000; Stoner et al., 2002; Thouveny et
al., 2004; Yamazaki and Oda, 2002) or global stacks (e.g. Guyodo
and Valet, 1999; Laj et al., 2004; Valet et al., 2005; Channell et al.,
2009) are generally calibrated using absolute VDM (or VADM)
val-ues obtained from absolute paleointensity data sets and are thus
expressed in 10
22Am
2. These stacks produce consistent dipole
moment variations over the last million years that satisfactorily
correlate with the series of magnetic anomalies recorded from
the South-East Pacific seafloor by Gee et al. (2000) (e.g. Fig. 2
of Thouveny et al., 2008). Furthermore, the chronological
agree-ment between minimum dipole moagree-ment signals and well-known
excursions and reversals (e.g. Valet, 2003; Laj and Channell, 2007;
Thouveny et al., 2008) confirms their accuracy as proxies of the
geomagnetic dipole lows. Spectral analyses of these stacks reveal
periods in the same range as orbital parameters, reintroducing
the hypothesis of an orbital influence on the geodynamo (e.g.
Xuan and Channell, 2008; Fuller, 2006; Thouveny et al., 2008;
Saracco et al., 2009). However, detailed comparison between the
different dipole moment reconstructions points out noticeable
am-plitude discrepancies and chronological mismatches.
The current debates surrounding these results, as well as the
limited understanding of the physical processes controlling
mag-netization acquisition in sediments and lavas, highlight the need
to reconstruct dipole field intensity variations using an
indepen-dent approach, integrating the global-scale magnetospheric signal.
For these purposes, studies of the variations of the
cosmo-genic
nuclide
Beryllium-10
(
10Be,
half-life
∼ 1.4
Ma)
atmospheric production rate have recently been performed. At
millennial or
longer timescales, the geomagnetic dipole moment that
modu-lates the galactic cosmic ray flux penetrating the Earth’s
environ-ment undoubtedly constitutes the main modulation factor of the
global atmospheric
10Be production rate (e.g. Elsasser et al., 1956;
Lal, 1988; Wagner et al., 2000; Masarik and Beer 1999, 2009). Once
atmospherically produced,
10Be is rapidly transferred through
pre-cipitations to the Earth’s surface (Raisbeck et al., 1981; Bourlès,
1992; Baroni et al., 2011), where it accumulates in natural archives
that thus record the production rate variations. Using
10Be
at-mospheric transport modelling, Heikkilä et al. (2009, 2013) have
shown that the stratospheric, well-mixed fraction of
10Be is
al-ways dominant in worldwide
10Be depositional fluxes. These
re-sults have been reinforced by the reproducibility and
synchronic-ity of
10Be production records in Greenland ice and in mid- to
low-latitude marine sediments over the 20–50 ka time interval
(Ménabréaz et al., 2012), further strengthening the earlier
as-sumption that long-term changes in
10Be fluxes recorded in ice
sheets reflect a geomagnetic signal modulation (e.g. Muscheler et
al. 2004, 2005; Wagner et al., 2000). Evidence of this
modula-tion over the past million years are documented by
10Be fluxes in
ice cores (e.g. Raisbeck et al., 1992; Finkel and Nishiizumi, 1997;
Yiou et al., 1997; Muscheler et al., 2005; Raisbeck et al., 2006)
and in marine sediments, using either
10Be/
230Th
xs
(e.g. Frank et
al., 1997; Christl et al. 2003, 2007, 2010; Ménabréaz et al., 2011;
Fig. 1A) or
10Be/
9Be of the authigenic fraction – i.e. fraction due to
the adsorption onto settling particles – (e.g. Raisbeck et al., 1985;
Henken-Mellies et al., 1990; Robinson et al., 1995; Carcaillet et al.
2003, 2004a, 2004b; Ménabréaz et al., 2011, 2012; Fig. 1A) in order
to correct for the environmental biases due to oceanic transport
processes. The fundamentals of these two normalization methods,
as well as their possible associated biases, have been discussed
in e.g. François et al. (2004) and Ménabréaz et al. (2011, 2012),
respectively. In the latter studies, it has been proven that the
authi-genic
10Be/
9Be methodology, notably confirmed by a
10Be/
230Th
xs
cross-evaluation, reliably corrects for ocean secondary
contribu-tions. Most of the available records span the last 250–300 ka, as
the use of
230Th
xs
as a constant flux proxy is limited to 350 ka
due to the
230Th half-life (75 690 yr; e.g. Henderson and
Ander-son, 2003). This is not the case for the authigenic
10Be/
9Be method,
which is limited, at most, to the last 14 Ma due to
10Be radioactive
decay. Authigenic
10Be/
9Be studies are, however, scarce, and there
are no data documenting the cosmogenic nuclide production rate
variations during the 300–500 ka time period, and a few
measure-ment data points were obtained over the 500–800 ka time period
(Carcaillet et al., 2003).
Here, we present an authigenic
10Be/
9Be record from a deep-sea
sediment core which documents
10Be global atmospheric
produc-tion rate changes between 250 and 800 ka (and which thus
in-cludes the last geomagnetic reversal at about 780 ka) and we aim
to reconstruct the associated dipole moment variations, notably
those accompanying excursions and reversal. The studied core was
retrieved near the equator, where the geomagnetic modulation of
the galactic cosmic ray flux is the most effi cient. The choice of a
study area on a continental margin (Gulf of Papua; Fig. 1) is
jus-tified by a high vertical particle flux not only minimizing the Be
residence time with respect to scavenging, but also reducing the
effects of mixing in the water column and the influence of
biotur-bation processes, and hence of
10Be signal attenuation and shifting
(see for example Christl, 2007; Ménabréaz et al., 2012).
2. Materials and methods
2.1. Environmental setting of core MD05-2930
The Gulf of Papua (GOP) comprises an
∼ 150 000 km
2area south of Papua New Guinea, east of the Torres Strait (Fig. 1B
and C). The GOP continental shelf is wide to the West and
Northwest (∼ 200 km) and narrows to the Northeast (∼ 10–30
km). Several major rivers drain southern Papua New Guinea
Island, of which the Fly, Kikori and Purari Rivers currently
discharge 200 to 400 megatons per year of terrigeneous
siliciclastic material, mainly deposited onto the inner shelf of
the GOP (Harris et al., 1993; Milliman, 1995). To this large
volume of siliciclastic sediments are added important sources of
neritic carbonates (see Francis et al., 2008 and references therein)
that can produce up to 10 to 20 Mt per year of carbonate detrital
particles (Dickens et al., 2006). Car-bonate sedimentation in the
GOP originates firstly from the north-ern extension of the Great
Barrier Reef, which covers the western GOP shelf. This reef
system is at present composed of a nearly continuous barrier
reef along the shelf break, with patch reefs in the inner and
middle shelves toward the southern Fly River delta. Secondly,
isolated Miocene carbonate platforms evolved into large atolls
during the Pleistocene (Ashmore, Boot, Portlock and East-ern
Fields Reefs). Given the continental margin’s shallow water
depth (0 to 125 m), the Pleistocene sea-level fluctuations
influ-enced the nature and rhythm of the GOP sedimentation (see Jorry
et al., 2008). During sea-level lowstands (Glacials), the
continen-tal shelf was subaerially exposed, the main rivers extended to the
present shelf edge and reef systems karstified. This led to an
in-creased dilution of the carbonate fluxes by the siliciclastic fluxes.
The MD05-2930 core (10
◦25 S; 146
◦15 E; Fig. 1C) was collected
at 1490 m water depth on an intra-slope bathymetric plateau
(Eastern Plateau,
∼ 25 000 km
2; see Francis et al., 2008),
dominated by a siliciclastic sedimentation, with less than 40%
carbonates
dur-ing the last glacial–interglacial cycles (e.g. McFadden et al., 2006).
This 36.88 m long core was retrieved using a giant CALYPSO piston
corer on board of the R/V Marion Dufresne (MD-148 PECTEN Cruise,
2005). The sediment sequence is mainly composed of
homoge-neous grey–green clayey and silty clayey muds, rich in foraminifera
(Beaufort et al., 2005).
2.2. Chronostratigraphic framework
Benthic foraminifera, Cibicidoides wuellerstorfi and Uvigerina
peregrina, were picked at each 20 cm interval from the 250–
355 mm size-fraction. All benthic foraminiferal
δ
18O
measure-ments were carried out at CEREGE using a mass spectrometer
(Finnigan Delta Advantage) equipped with a carbonate
prepara-tion device. The measured isotopic values have been normalized
against NBS19. Mean external reproducibility is better than 0
.05h.
The C. wuellerstorfi
δ
18O values were corrected by
+0.64h to fit
the U. peregrina d18O values (Shackleton, 1974). The
glacial/inter-glacial amplitude of benthic foraminiferal
δ
18O variations in core
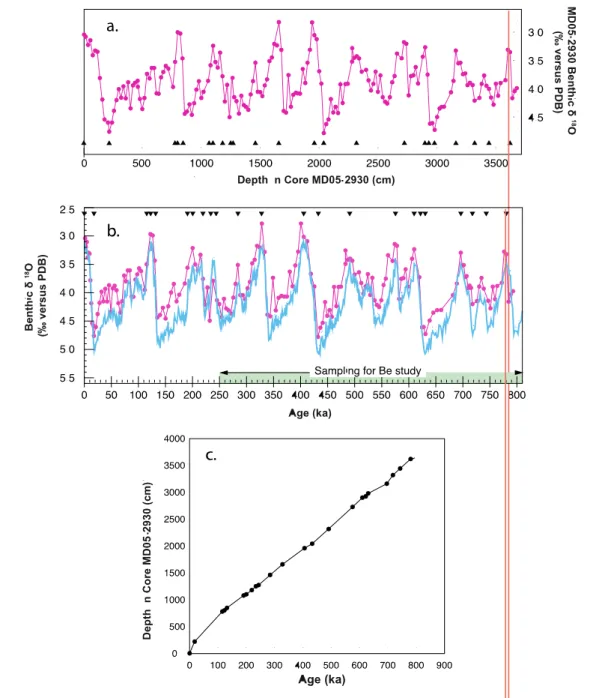
MD05-2930 (Fig. 2a) is very close to that of the benthic stack
LR04. The chronology of the whole sediment sequence was
ob-tained by correlating the MD05-2930 benthic foraminiferal
δ
18O
record with the LR04 reference benthic stack (Lisiecki and Raymo,
2005) (Fig. 2b). This correlation places the MD05-2930 core bottom
Fig. 1. (A) Location of the studied site among several recently published 10Be/9Be and 10Be/230Th
xs high-resolution marine records spanning the past ∼300 ka (yellow) and
older (red). 1: Carcaillet et al. (2004b); Ménabréaz et al. (2011). 2: Ménabréaz et al. (2012). 3: Carcaillet et al. (2003). 4, 5: Christl et al. (2010); Knudsen et al. (2008). 6: Christl et al. (2007). The star represents the location of core MD05-2930. (B) precise core location and (C) bathymetry of the Gulf of Papua. The contour lines represent the lines of equal intensity of cosmic rays at sea level (after Legrand, 1984). (For interpretation of the references to colour in this figure, the reader is referred to the web version of this article.)
(3670 cm depth) in Marine Isotope Stage (MIS) 20. This is in
agree-ment with the identification of a paleomagnetic reversal recorded
at 3610 cm in MIS 19, corresponding to the Brunhes–Matuyama
(B/M) polarity transition (Thouveny et al., in preparation) dated
between 773 and 781 ka by absolute datings on lava flows (e.g.
Singer and Pringle, 1996; Quidelleur et al., 2003) or by
astro-nomical tuning of sediment sequences (e.g. Bassinot et al., 1994;
Tauxe et al., 1996; Channell et al., 2010). According to these
chronological constraints, the average sedimentation rate of the
MD05-2930 sedimentary sequence is about 4.6 cm/ka (Fig. 2c).
2.3. Sampling and chemical procedures for authigenic
10Be and
9Be
extraction, and authigenic
10Be and
9Be measurements
The sampling of core MD05-2930 was performed from 1400 to
3670 cm depth, which corresponds to the 250–800 ka time
inter-val (Fig. 2b). Since the upper part of core MD05-2930 is affected
by artefacts due to piston coring, the last 250 ka are presently
studied on core MD05-2920, collected on the Northern Papua
mar-gin (see Ménabréaz et al., 2012 for the 20–50 ka time interval).
Sediment slices measuring 1cm thick were extracted every 10 cm
besides u-channels collected for paleomagnetic sampling and X-ray
fluorescence measurements. A total of 224 sediment samples were
taken and were chemically treated to extract and analyse Beryllium
isotopes in their authigenic phase.
All samples were processed for the Be isotopes analysis at
the CEREGE National Cosmogenic Nuclides Laboratory, France.
Al-ready summarized by Carcaillet et al. (2003, 2004a, 2004b) and
Ménabréaz et al. (2011, 2012), the chemical procedure is detailed
below. Several procedural blanks and replicates were performed
along with the samples in order to assess both cleanliness and
re-producibility during the chemical extraction.
10
Be and its stable isotope
9Be were co-extracted with the
au-thigenic phase of sediments using 20 ml/g
sedimentof 0.04M
hy-droxylamine (NH
2OH-HCl) in a 25% acetic acid leaching solution
at
(95 ± 5)
◦C for 7 hr (Bourlès et al., 1989). A 2 ml aliquot of
the resulting leaching solution was taken for flameless Atomic
Fig. 2. Stable isotopes record of core MD05-2930 used for the time scale reconstruction: (a) benthic foraminifera C. Wuellerstorfi and Uvigerina sp. δ18O records on the depth scale; black triangles locate the tie-points used for the correlation with the reference record LR04 of Lisiecki and Raymo (2005). (b) Benthic δ18O record (pink) on the time
scale established by correlation with the dated benthic stack LR04 (blue); black triangles locate the correlation tie points. The green bar indicates the interval 250–800 ka sampled for the Be isotopes analysis. (c) depth-age relationship used to transfer all studied parameters to the time scale. The red vertical line situates the stratigraphic position of the Brunhes–Matuyama reversal (see text). (For interpretation of the references to colour in this figure, the reader is referred to the web version of this article.)
concentration. The remaining solution was spiked with 300 μl of
a 10
−3g
/g
9Be-carrier before the chemical extraction that was
to be performed prior to the AMS measurement of the resulting
10
Be/
9Be ratio. The spiked solution was then evaporated to
dry-ness the residues dissolved in HNO
3and diluted with distilled
water. The thus-solubilised Beryllium was then chelated at pH 7
by adding 2 ml of acetylacetone in the presence of EDTA 50%.
The obtained Be-acetylacetonates were separated by organic
sol-vent extraction using CCl
4, and heat decomposed in HCl. The solid
residues resulting from the evaporation of the HCl – acidified
ex-tracted organic fraction were dissolved in a 4 ml HNO
3– 2 ml
HClO
4acidic solution that was brought to dryness. The obtained
residues were dissolved in ultra-pure HNO
3, the resulting
solu-tion was again evaporated to dryness and the solid residues were
finally dissolved in ultra-pure HCl. Be oxy-hydroxides were
pre-cipitated at pH 8 from this final solution by adding NH
4OH. The
precipitate was separated by centrifugation and rinsed twice by
re-suspension and centrifugation in pH 8 ultra-pure water. After
dissolution of this rinsed precipitate in HCl, the previously
de-scribed precipitation and rinse steps were repeated. These purified
Beryllium oxy-hydroxides were solubilised in HNO
3and the
result-ing solution was transferred into a quartz crucible where it was
gently evaporated to dryness at 200
◦C. Finally, the Beryllium
oxy-hydroxides deposit was fully converted to BeO by oven heating at
800
◦C for 1 hr in order to condition it for AMS measurements.
10
Be concentration measurements were performed at the French
AMS national facility ASTER (CEREGE) operating at 5MV. Once
an aliquot is taken for natural authigenic
9Be measurements,
the addition of an accurately and precisely known
concentra-tion of
9Be-carrier to the leaching solutions before any chemical
handling allows to accurately determine
10Be sample
Table 1
AMS measurements, authigenic 10Be and 9Be concentrations, and authigenic 10Be/9Be ratios of core MD05-2930 samples. Sample: depth in core MD05-2930 (cm) Age Sample (ka BP) weight (g) Measured 10Be/9Be (10−11)* [10Be]auth. corrected from radioactive decay (10−15 g/g)* Authigenic [9Be] (10-7 g/g)* Authigenic 10Be/9Be (10−8)* MD05-2930_1401 MD05-2930_1411 MD05-2930_1421 MD05-2930_1431 MD05-2930_1441 MD05-2930_1451 MD05-2930_1461 MD05-2930_1471 MD05-2930_1481 MD05-2930_1491 MD05-2930_1501 MD05-2930_1511 MD05-2930_1521 MD05-2930_1531 MD05-2930_1541 MD05-2930_1551 MD05-2930_1561 MD05-2930_1571 MD05-2930_1581 MD05-2930_1591 MD05-2930_1601 MD05-2930_1611 MD05-2930_1621 MD05-2930_1631 MD05-2930_1641 MD05-2930_1651 MD05-2930_1661 MD05-2930_1671 MD05-2930_1681 MD05-2930_1691 MD05-2930_1701 MD05-2930_1711 MD05-2930_1721 MD05-2930_1731 MD05-2930_1741 MD05-2930_1751 MD05-2930_1761 MD05-2930_1771 MD05-2930_1781 MD05-2930_1791 MD05-2930_1801 MD05-2930_1811 MD05-2930_1821 MD05-2930_1831 MD05-2930_1841 MD05-2930_1851 MD05-2930_1861 MD05-2930_1871 MD05-2930_1881 MD05-2930_1891 MD05-2930_1901 MD05-2930_1911 MD05-2930_1921 MD05-2930_1931 MD05-2930_1941 MD05-2930_1951 MD05-2930_1961 MD05-2930_1971 MD05-2930_1981 MD05-2930_1991 MD05-2930_2001 MD05-2930_2011 MD05-2930_2021 MD05-2930_2041 MD05-2930_2051 MD05-2930_2061 MD05-2930_2071 MD05-2930_2081 MD05-2930_2091 MD05-2930_2101 MD05-2930_2111 MD05-2930_2121 271 1.03 273 0.69 275 1.03 278 1.12 280 0.87 282 0.93 284 1.04 286 0.90 288 0.81 291 1.02 293 0.81 295 1.00 297 0.94 299 1.10 302 0.98 304 1.05 306 0.92 308 1.10 310 1.02 313 1.02 315 0.85 317 0.88 319 0.54 322 1.04 324 0.76 326 0.75 328 0.74 331 0.97 333 0.70 336 0.89 339 0.91 341 1.03 344 0.67 346 0.89 349 1.12 351 1.02 354 1.01 357 1.28 359 1.12 362 0.81 364 0.77 367 0.98 370 1.00 372 1.15 375 1.25 377 1.11 380 1.19 382 1.30 385 0.92 388 0.86 390 1.13 393 0.95 395 0.79 398 0.90 401 1.02 403 0.99 406 0.82 409 0.99 412 0.99 416 1.21 419 1.05 422 1.25 425 1.23 432 1.05 434 1.16 437 1.06 439 1.20 441 1.02 443 0.62 445 1.07 447 1.07 449 1.21 2.984±0.043 2.143±0.020 3.196±0.022 3.014±0.048 2.237±0.021 2.781±0.020 3.164±0.051 2.865±0.029 2.373±0.018 2.877±0.044 2.517±0.019 3.055±0.023 2.448±0.039 2.571±0.019 1.950±0.019 2.263±0.040 2.476±0.024 3.174±0.022 2.722±0.043 3.041±0.021 2.170±0.016 2.166±0.033 1.408±0.013 2.874±0.022 1.978±0.055 1.969±0.016 1.942±0.019 1.940±0.054 1.281±0.014 1.767±0.015 1.994±0.074 2.040±0.021 1.068±0.015 1.547±0.073 2.418±0.017 2.288±0.019 2.528±0.057 3.281±0.020 2.714±0.022 1.828±0.061 1.819±0.016 2.512±0.015 2.585±0.046 3.252±0.021 3.451±0.021 3.180±0.051 3.482±0.022 3.401±0.028 2.460±0.043 2.091±0.018 3.292±0.020 2.579±0.054 2.111±0.017 2.308±0.020 2.347±0.043 2.600±0.017 2.275±0.017 2.691±0.057 2.683±0.018 2.849±0.019 2.169±0.026 2.547±0.018 2.468±0.017 2.464±0.022 3.197±0.021 3.049±0.029 3.401±0.026 2.034±0.018 1.137±0.022 2.334±0.022 2.901±0.019 3.462±0.039 9.43±0.14 10.09±0.10 10.21±0.08 8.93±0.15 8.51±0.09 9.78±0.08 10.27±0.17 10.65±0.11 9.93±0.08 9.47±0.15 10.48±0.08 10.27±0.08 8.63±0.14 7.83±0.06 6.70±0.07 7.20±0.13 8.89±0.09 9.17±0.07 8.96±0.14 9.92±0.07 8.63±0.07 8.25±0.13 8.83±0.08 9.33±0.07 8.70±0.24 8.78±0.07 8.68±0.09 6.70±0.19 6.11±0.07 6.59±0.06 7.24±0.27 6.65±0.07 5.14±0.07 5.80±0.28 6.87±0.05 7.51±0.07 8.26±0.19 8.64±0.06 8.15±0.07 7.45±0.25 8.02±0.07 8.50±0.05 8.64±0.16 9.41±0.06 9.25±0.06 9.58±0.16 9.80±0.06 8.73±0.07 8.93±0.16 8.13±0.07 9.77±0.06 9.07±0.19 8.90±0.07 8.54±0.08 7.65±0.14 8.76±0.06 9.10±0.07 9.06±0.20 9.14±0.06 7.80±0.06 6.86±0.08 6.80±0.05 6.73±0.05 7.86±0.07 9.27±0.07 9.49±0.09 9.49±0.07 6.68±0.06 6.10±0.12 7.34±0.07 9.02±0.06 9.58±0.11 3.15±0.07 3.38±0.06 3.55±0.07 3.19±0.19 3.58±0.06 3.09±0.05 2.80±0.19 2.80±0.07 2.72±0.04 3.05±0.14 3.34±0.02 3.19±0.05 3.24±0.20 3.19±0.03 2.66±0.03 3.42±0.08 3.87±0.04 2.93±0.06 2.79±0.05 3.00±0.06 2.73±0.09 3.08±0.11 2.60±0.05 3.26±0.08 2.91±0.11 2.70±0.06 2.74±0.04 3.17±0.08 3.19±0.05 3.15±0.04 3.26±0.08 2.68±0.04 2.09±0.07 3.04±0.06 2.43±0.07 2.43±0.07 2.89±0.10 2.95±0.02 2.60±0.01 3.06±0.04 3.09±0.09 2.48±0.05 3.24±0.10 2.85±0.05 3.14±0.06 3.27±0.09 2.92±0.05 3.31±0.07 4.18±0.04 3.03±0.03 3.59±0.14 3.30±0.13 2.79±0.08 2.72±0.06 2.3751±0.0002 2.48±0.07 2.46±0.08 3.05±0.04 2.54±0.08 3.04±0.08 2.83±0.08 2.77±0.08 2.70±0.09 2.50±0.03 2.96±0.13 3.04±0.06 2.94±0.04 2.56±0.05 2.51±0.08 2.39±0.11 2.66±0.02 3.11±0.03 2.99±0.08 2.98±0.06 2.87±0.06 2.80±0.17 2.37±0.05 3.16±0.05 3.68±0.25 3.81±0.10 3.65±0.06 3.11±0.15 3.14±0.03 3.22±0.06 2.66±0.17 2.45±0.03 2.52±0.04 2.11±0.06 2.30±0.03 3.13±0.06 3.20±0.08 3.31±0.07 3.16±0.11 2.68±0.11 3.40±0.08 2.86±0.07 2.99±0.14 3.25±0.07 3.16±0.06 2.11±0.08 1.92±0.04 2.09±0.03 2.22±0.10 2.49±0.05 2.47±0.08 1.91±0.10 2.83±0.08 3.09±0.09 2.85±0.12 2.93±0.03 3.13±0.03 2.44±0.09 2.59±0.08 3.43±0.07 2.67±0.09 3.30±0.06 2.95±0.06 2.93±0.09 3.36±0.06 2.64±0.06 2.14±0.05 2.69±0.04 2.72±0.10 2.75±0.11 3.20±0.09 3.14±0.08 3.22±0.06 3.54±0.11 3.70±0.13 2.97±0.07 3.60±0.12 2.57±0.07 2.43±0.08 2.45±0.07 2.49±0.08 3.14±0.04 3.13±0.14 3.12±0.06 3.23±0.15 2.60±0.05 2.43±0.09 3.06±0.14 3.38±0.03 3.08±0.05
Table 1 (continued) Sample: depth in core MD05-2930 (cm) Age Sample (ka BP) weight (g) Measured 10Be/9Be (10−11)* [10Be] auth. corrected from radioactive decay (10−15 g/g)* Authigenic [9Be] (10-7 g/g)* Authigenic 10Be/9Be (10−8)* MD05-2930_2131 MD05-2930_2141 MD05-2930_2151 MD05-2930_2161 MD05-2930_2181 MD05-2930_2191 MD05-2930_2201 MD05-2930_2211 MD05-2930_2221 MD05-2930_2231 MD05-2930_2241 MD05-2930_2251 MD05-2930_2261 MD05-2930_2271 MD05-2930_2281 MD05-2930_2291 MD05-2930_2301 MD05-2930_2311 MD05-2930_2321 MD05-2930_2331 MD05-2930_2341 MD05-2930_2351 MD05-2930_2361 MD05-2930_2371 MD05-2930_2381 MD05-2930_2391 MD05-2930_2401 MD05-2930_2411 MD05-2930_2421 MD05-2930_2431 MD05-2930_2441 MD05-2930_2451 MD05-2930_2461 MD05-2930_2471 MD05-2930_2481 MD05-2930_2491 MD05-2930_2501 MD05-2930_2511 MD05-2930_2521 MD05-2930_2531 MD05-2930_2541 MD05-2930_2551 MD05-2930_2561 MD05-2930_2571 MD05-2930_2581 MD05-2930_2591 MD05-2930_2601 MD05-2930_2611 MD05-2930_2621 MD05-2930_2631 MD05-2930_2641 MD05-2930_2651 MD05-2930_2661 MD05-2930_2671 MD05-2930_2681 MD05-2930_2691 MD05-2930_2701 MD05-2930_2711 MD05-2930_2721 MD05-2930_2731 MD05-2930_2741 MD05-2930_2751 MD05-2930_2761 MD05-2930_2771 MD05-2930_2781 MD05-2930_2791 MD05-2930_2801 MD05-2930_2811 MD05-2930_2821 MD05-2930_2831 MD05-2930_2841 MD05-2930_2851 MD05-2930_2861 451 1.18 453 0.95 455 0.98 458 0.91 462 0.79 464 0.86 466 1.09 468 0.99 470 1.21 472 1.06 474 1.11 477 1.16 479 0.89 481 0.85 483 0.86 485 1.01 487 1.04 489 1.05 491 0.96 493 1.16 495 1.12 498 1.14 500 0.87 502 0.75 504 0.96 506 0.51 508 0.94 510 0.95 512 0.73 514 0.84 516 0.97 518 0.45 520 0.86 522 0.94 524 0.58 526 1.11 529 1.06 531 0.72 533 0.83 535 1.09 537 0.60 539 1.00 541 1.10 543 0.53 545 1.18 547 0.78 549 0.60 551 0.85 553 0.97 555 0.83 557 0.88 559 1.06 562 0.75 564 1.11 566 0.81 568 0.79 570 0.88 572 0.73 574 0.59 576 0.88 578 1.10 580 0.76 582 1.10 584 1.10 586 0.99 588 1.06 590 0.86 592 0.68 594 0.80 596 0.91 598 0.86 600 0.90 602 1.08 3.052±0.024 2.356±0.019 1.594±0.027 1.906±0.015 2.257±0.025 1.824±0.014 2.737±0.018 2.593±0.021 3.001±0.024 2.588±0.020 2.428±0.036 2.252±0.017 1.801±0.032 1.295±0.023 0.664±0.008 1.867±0.021 1.948±0.037 2.215±0.016 2.416±0.018 3.052±0.043 2.864±0.023 2.920±0.029 2.059±0.040 1.652±0.014 2.014±0.015 1.046±0.012 1.949±0.016 1.966±0.016 1.516±0.018 1.705±0.014 1.871±0.018 0.991±0.012 2.182±0.017 2.360±0.020 1.567±0.018 3.106±0.022 2.813±0.023 1.767±0.021 1.949±0.014 3.295±0.019 2.054±0.022 3.640±0.022 3.857±0.027 1.686±0.018 3.202±0.018 1.988±0.015 1.596±0.020 2.341±0.018 2.787±0.018 1.956±0.022 2.016±0.014 2.264±0.019 1.586±0.018 2.519±0.017 1.745±0.016 1.760±0.019 1.934±0.016 1.540±0.015 1.306±0.015 1.904±0.028 2.426±0.027 1.869±0.021 3.343±0.037 3.871±0.042 3.547±0.039 3.334±0.041 2.355±0.032 1.566±0.017 1.597±0.025 1.924±0.023 1.819±0.021 2.059±0.029 2.422±0.027 8.73±0.07 8.33±0.07 5.43±0.10 7.02±0.06 9.47±0.11 7.11±0.06 8.28±0.06 8.71±0.07 8.36±0.07 8.14±0.07 7.33±0.11 6.49±0.05 6.67±0.12 5.11±0.10 2.61±0.04 6.22±0.07 6.27±0.12 7.18±0.05 8.40±0.06 8.79±0.13 8.65±0.07 8.59±0.09 7.87±0.16 7.42±0.06 7.04±0.05 6.89±0.08 6.98±0.06 6.89±0.06 6.95±0.08 6.77±0.06 6.49±0.07 7.37±0.09 8.50±0.07 8.43±0.07 9.04±0.10 9.44±0.07 8.95±0.08 8.19±0.10 7.91±0.06 10.13±0.06 11.53±0.12 12.31±0.08 11.91±0.09 10.70±0.12 9.14±0.06 8.64±0.07 8.92±0.11 9.22±0.07 9.11±0.06 7.77±0.09 7.72±0.06 7.19±0.06 7.07±0.08 7.62±0.05 7.20±0.07 6.97±0.08 7.27±0.06 7.13±0.07 7.28±0.09 7.22±0.11 7.39±0.09 8.34±0.09 10.21±0.12 11.80±0.13 11.94±0.13 10.56±0.13 9.21±0.13 7.67±0.09 6.67±0.11 7.10±0.09 7.09±0.08 7.64±0.11 7.47±0.09 2.80±0.03 2.84±0.02 3.18±0.06 3.16±0.04 4.15±0.08 4.22±0.04 4.07±0.09 4.48±0.04 3.58±0.06 4.17±0.09 4.19±0.10 3.59±0.04 4.10±0.06 4.29±0.13 2.22±0.01 3.78±0.09 2.62±0.04 2.79±0.02 3.06±0.06 3.64±0.02 3.32±0.06 3.26±0.04 3.51±0.16 3.19±0.02 2.96±0.03 2.91±0.15 2.91±0.03 2.97±0.04 3.30±0.08 3.18±0.04 2.97±0.01 3.58±0.17 2.97±0.03 2.84±0.05 3.23±0.09 3.00±0.10 3.09±0.03 3.57±0.03 2.97±0.08 3.48±0.07 3.07±0.12 3.22±0.11 3.06±0.09 3.40±0.04 3.71±0.13 3.42±0.07 3.71±0.04 3.10±0.08 3.70±0.05 3.73±0.06 3.58±0.13 4.06±0.03 3.82±0.08 4.36±0.16 3.68±0.13 3.43±0.09 2.56±0.05 2.87±0.06 2.80±0.11 2.48±0.06 2.48±0.18 3.47±0.10 3.49±0.07 4.08±0.08 3.33±0.10 3.90±0.07 3.20±0.12 3.59±0.08 3.09±0.08 3.13±0.07 3.54±0.08 3.57±0.02 3.76±0.03 3.12±0.04 2.93±0.03 1.71±0.04 2.22±0.04 2.28±0.05 1.68±0.02 2.03±0.05 1.94±0.03 2.34±0.04 1.95±0.05 1.75±0.05 1.81±0.03 1.63±0.04 1.19±0.05 1.18±0.02 1.64±0.05 2.39±0.06 2.58±0.03 2.75±0.06 2.42±0.04 2.61±0.05 2.63±0.04 2.24±0.11 2.33±0.03 2.38±0.03 2.37±0.13 2.40±0.03 2.32±0.04 2.11±0.06 2.13±0.04 2.18±0.03 2.06±0.10 2.86±0.04 2.97±0.06 2.80±0.09 3.14±0.11 2.90±0.04 2.29±0.03 2.66±0.08 2.91±0.06 3.76±0.16 3.82±0.13 3.88±0.11 3.15±0.13 2.46±0.09 2.53±0.05 2.40±0.10 2.97±0.08 2.46±0.04 2.08±0.04 2.16±0.08 1.77±0.02 1.85±0.05 1.75±0.07 1.96±0.07 2.03±0.06 2.83±0.06 2.49±0.06 2.60±0.11 2.91±0.08 2.98±0.22 2.40±0.08 2.93±0.07 2.89±0.06 3.58±0.12 2.71±0.06 2.87±0.11 2.14±0.05 2.16±0.07 2.27±0.06 2.01±0.05 2.14±0.04 1.99±0.03 (continued on next page)
Table 1 (continued) Sample: depth in core MD05-2930 (cm) Age Sample (ka BP) weight (g) Measured 10Be/9Be (10−11)* [10Be] auth. corrected from radioactive decay (10−15 g/g)* Authigenic [9Be] (10-7 g/g)* Authigenic 10Be/9Be (10−8)* MD05-2930_2871 MD05-2930_2881 MD05-2930_2891 MD05-2930_2911 MD05-2930_2921 MD05-2930_2931 MD05-2930_2941 MD05-2930_2951 MD05-2930_2961 MD05-2930_2971 MD05-2930_2981 MD05-2930_2991 MD05-2930_3001 MD05-2930_3011 MD05-2930_3021 MD05-2930_3031 MD05-2930_3041 MD05-2930_3051 MD05-2930_3071 MD05-2930_3081 MD05-2930_3091 MD05-2930_3101 MD05-2930_3111 MD05-2930_3121 MD05-2930_3131 MD05-2930_3141 MD05-2930_3151 MD05-2930_3161 MD05-2930_3171 MD05-2930_3181 MD05-2930_3191 MD05-2930_3201 MD05-2930_3211 MD05-2930_3221 MD05-2930_3231 MD05-2930_3241 MD05-2930_3251 MD05-2930_3261 MD05-2930_3271 MD05-2930_3281 MD05-2930_3291 MD05-2930_3301 MD05-2930_3311 MD05-2930_3321 MD05-2930_3331 MD05-2930_3341 MD05-2930_3351 MD05-2930_3361 MD05-2930_3371 MD05-2930_3381 MD05-2930_3391 MD05-2930_3401 MD05-2930_3411 MD05-2930_3421 MD05-2930_3431 MD05-2930_3441 MD05-2930_3451 MD05-2930_3461 MD05-2930_3471 MD05-2930_3481 MD05-2930_3491 MD05-2930_3501 MD05-2930_3511 MD05-2930_3521 MD05-2930_3531 MD05-2930_3541 MD05-2930_3551 MD05-2930_3561 MD05-2930_3571 MD05-2930_3581 MD05-2930_3591 MD05-2930_3601 MD05-2930_3611 604 0.51 606 0.73 608 0.78 615 0.98 620 0.82 623 0.60 624 1.21 626 1.29 627 0.57 629 0.83 631 0.92 634 0.66 638 1.18 642 1.25 645 0.74 649 0.91 653 0.97 656 0.74 663 1.02 667 0.53 671 0.92 674 1.28 678 0.65 682 0.52 685 1.02 688 0.95 692 0.74 696 1.02 698 0.88 699 0.66 700 0.84 702 0.93 703 0.83 704 0.94 706 1.23 707 0.58 708 1.09 710 1.16 711 0.50 712 1.08 714 1.23 715 0.60 716 0.99 718 0.73 720 0.51 722 0.87 724 0.99 726 0.71 728 0.90 730 0.85 732 0.69 734 0.86 736 0.88 738 0.67 741 0.88 743 0.81 745 0.68 747 0.77 749 0.86 751 0.94 753 0.96 755 0.79 757 0.80 759 0.82 761 0.86 763 1.08 766 1.03 768 0.81 770 0.71 772 0.88 774 0.85 776 1.01 778 0.69 1.241±0.010 1.843±0.029 1.771±0.029 2.722±0.031 1.957±0.026 1.346±0.011 2.948±0.037 3.189±0.041 1.229±0.010 1.324±0.025 1.500±0.027 1.171±0.013 2.075±0.028 2.347±0.025 1.257±0.013 1.590±0.019 1.686±0.020 0.999±0.011 1.805±0.012 0.874±0.011 1.654±0.012 2.053±0.014 1.447±0.010 1.279±0.014 2.684±0.020 2.497±0.009 1.877±0.009 2.443±0.011 1.769±0.012 1.303±0.011 1.721±0.013 1.975±0.012 1.654±0.009 1.779±0.012 2.533±0.009 1.126±0.014 1.782±0.012 2.152±0.011 0.917±0.012 1.957±0.012 2.497±0.012 1.239±0.013 1.879±0.008 1.330±0.011 0.897±0.012 1.657±0.010 1.723±0.012 1.211±0.013 1.481±0.011 1.465±0.012 1.163±0.011 1.479±0.010 1.391±0.011 1.103±0.016 1.458±0.012 1.276±0.013 1.022±0.013 1.058±0.013 1.320±0.014 1.497±0.009 1.458±0.010 1.298±0.012 1.212±0.018 1.255±0.013 1.555±0.010 2.304±0.010 2.501±0.009 2.369±0.009 2.350±0.009 3.103±0.008 2.684±0.009 2.451±0.009 1.340±0.013 8.17±0.06 8.37±0.13 7.46±0.13 9.26±0.11 8.03±0.11 7.42±0.06 8.15±0.11 8.30±0.11 7.14±0.06 5.33±0.10 5.42±0.09 5.80±0.06 5.88±0.08 5.93±0.07 5.60±0.06 5.78±0.07 5.76±0.07 4.50±0.05 5.90±0.07 5.35±0.06 6.03±0.07 5.38±0.08 7.38±0.08 8.21±0.12 8.85±0.18 8.86±0.08 8.44±0.08 8.11±0.09 6.80±0.08 6.70±0.08 6.91±0.09 7.12±0.09 6.69±0.06 6.39±0.08 6.93±0.07 6.59±0.09 5.50±0.07 6.28±0.07 6.13±0.07 6.14±0.08 6.78±0.08 7.09±0.10 6.27±0.05 6.09±0.07 5.90±0.07 6.36±0.07 5.85±0.07 5.76±0.07 5.52±0.06 5.73±0.07 5.69±0.07 5.77±0.06 5.34±0.06 5.56±0.09 5.59±0.07 5.33±0.07 5.05±0.07 4.63±0.06 5.10±0.07 5.36±0.05 5.10±0.05 5.44±0.07 4.99±0.09 5.13±0.07 6.05±0.06 7.11±0.07 8.12±0.07 9.78±0.09 11.01±0.09 11.71±0.09 10.57±0.09 8.17±0.07 6.56±0.09 4.05±0.15 3.45±0.03 2.85±0.03 2.96±0.08 3.04±0.08 2.92±0.10 2.92±0.01 3.35±0.08 3.21±0.03 3.03±0.10 3.20±0.12 3.07±0.08 2.77±0.05 3.13±0.06 2.88±0.03 2.85±0.01 2.93±0.04 2.34±0.10 3.46±0.08 2.94±0.09 2.77±0.10 2.52±0.06 3.23±0.10 3.43±0.17 3.63±0.04 4.28±0.12 3.32±0.06 3.46±0.08 3.14±0.02 2.65±0.11 2.33±0.05 3.04±0.06 2.65±0.08 2.54±0.02 3.49±0.05 3.25±0.09 3.28±0.08 3.81±0.08 3.45±0.03 3.46±0.06 3.12±0.06 2.81±0.11 2.70±0.04 2.91±0.10 2.88±0.05 3.02±0.06 2.91±0.08 2.84±0.11 3.54±0.06 4.20±0.06 3.19±0.04 3.54±0.06 2.64±0.04 3.01±0.06 3.13±0.07 3.01±0.07 2.60±0.02 2.78±0.02 2.77±0.06 2.83±0.03 3.11±0.07 2.91±0.03 2.95±0.05 2.82±0.03 2.29±0.03 3.06±0.07 3.00±0.03 2.57±0.06 3.08±0.05 2.74±0.07 3.03±0.05 2.47±0.05 2.53±0.04 2.02±0.08 2.43±0.05 2.61±0.06 3.13±0.09 2.64±0.08 2.54±0.09 2.79±0.04 2.48±0.07 2.23±0.03 1.76±0.07 1.69±0.07 1.89±0.05 2.12±0.05 1.90±0.04 1.95±0.03 2.03±0.03 1.97±0.04 1.93±0.08 1.70±0.05 1.82±0.06 2.18±0.08 2.14±0.06 2.28±0.08 2.39±0.12 2.44±0.06 2.07±0.06 2.54±0.05 2.35±0.06 2.16±0.03 2.53±0.11 2.97±0.07 2.34±0.05 2.53±0.08 2.52±0.04 1.99±0.03 2.03±0.07 1.68±0.05 1.65±0.04 1.78±0.03 1.77±0.04 2.17±0.05 2.53±0.11 2.32±0.04 2.10±0.08 2.05±0.05 2.11±0.05 2.01±0.06 2.03±0.09 1.56±0.03 1.37±0.03 1.79±0.03 1.63±0.03 2.02±0.04 1.85±0.05 1.79±0.05 1.77±0.05 1.94±0.03 1.67±0.03 1.84±0.05 1.90±0.03 1.64±0.04 1.87±0.03 1.69±0.04 1.82±0.03 2.63±0.04 2.32±0.06 2.70±0.04 3.81±0.09 3.58±0.07 4.28±0.10 3.48±0.06 3.32±0.07 2.60±0.05
Table 1 (continued) Sample: depth in core MD05-2930 (cm) Age Sample (ka BP) weight (g) Measured 10 Be/9Be (10−11)* [10Be]auth. corrected from radioactive decay (10−15 g/g)* Authigenic [9Be] (10-7 g/g)* Authigenic 10 Be/9Be (10−8)* 780 0.78 782 1.05 784 0.61 786 0.57 789 0.84 791 1.09 1.400±0.011 1.794±0.010 1.074±0.013 1.130±0.011 2.163±0.009 2.589±0.008 6.00±0.07 5.71±0.06 5.88±0.06 6.65±0.06 8.50±0.06 7.98±0.06 2.53±0.03 2.60±0.12 2.94±0.09 2.81±0.04 3.04±0.08 3.12±0.04 2.37±0.04 2.20±0.10 2.00±0.07 2.37±0.05 2.80±0.08 2.56±0.04 MD05-2930_3621 MD05-2930_3631 MD05-2930_3641 MD05-2930_3651 MD05-2930_3661 MD05-2930_3671 mean ± std. dev. mean ± SDOM 7.71±1.65 7.71±0.11 3.12±0.46 3.12±0.03 2.51±0.58 2.51±0.04 *
1-sigma uncertainties rounded to the higher value.
NIST 4325 Standard Reference Material (
(2.79 ± 0.03) × 10
−11;
Nishiizumi et al., 2007). The measured ratios and their
uncer-tainties are presented in Table 1. Chemistry blank ratios range
from 5
.01 × 10
−15to 4
.82 × 10
−14, which is at least 3 orders
of magnitude lower than the sample
10Be/
9Be ratios. The
preci-sion (from statistical and instrumental uncertainties) of the
mea-sured
10Be/
9Be ratios ranges from 0.5% to 4%. Decay-corrected
10Be
concentrations have been computed using the
10Be half-life of
1
.387 ± 0.012 Ma (Chmeleff et al., 2010; Korschinek et al., 2010).
9
Be concentrations were measured at the CEREGE National
Cosmogenic Nuclides Laboratory, France, using a graphite-furnace
Atomic Absorption Spectrophotometer (AAS) with a Zeeman effect
background correction (Thermo Scientific ICE 3400). The
standard-additions method was used to eliminate the matrix effects
dur-ing the absorption and to allow measurements near the detection
limit.
9Be sample concentrations (Table 1) were determined from
repeated absorbance measurements (4 times) performed on each
of the four 200 μl aliquots of the sample solution, three of them
being spiked with increasing amount of a Sharlau
9Be-carrier
di-luted to 0
.34 × 10
−8g
/g using HNO
30.2%. Procedure blanks were,
in addition, processed for each sample run. The standard
devia-tion of repeated absorbance measurements for each aliquot must
be less than 1% to be considered.
9Be concentrations of the
un-spiked sample aliquot were measured in the 10
−10g/g range. After
correcting for sample dilution, the authigenic
9Be sample
concen-trations along core MD05-2930 cluster around 10
−7g/g (Table 1).
Associated uncertainties (1
σ
) vary from 0.01 to 7%.
3. Results
The authigenic Be concentrations presented in Fig. 3 along with
the
δ
18O profile (Fig. 3a) on the depth scale show that the
au-thigenic
9Be concentrations vary from 2.09 to 4
.48 × 10
−7g
/g
and that the authigenic
10Be concentrations vary from 2.61 to
12
.31 × 10
−15g
/g (Fig. 3b, c). It should be noted that the
au-thigenic
10Be and
9Be concentrations are most likely influenced
by the sedimentary particles adsorption effi ciency depending, in
particular, on their chemical composition and grain size
distribu-tion. Thus, contrary to the
10Be/
9Be ratio, some of the
10Be and
9
Be concentration variations may theoretically be attributable to
environmental effects. However, the authigenic
9Be variability is
approximately twice as low as that of authigenic
10Be, and most of
the resulting
10Be/
9Be variability is thus carried by the authigenic
10
Be signal (Fig. 3d). Comparison of the authigenic
10Be/
9Be
pro-file with the
δ
18O paleoclimate proxy does not show any strong
similarity (Fig. 3), which could be interpreted as a clue for a
de-pendence of the
10Be sedimentary fluxes on the glacial/interglacial
cycles alternation.
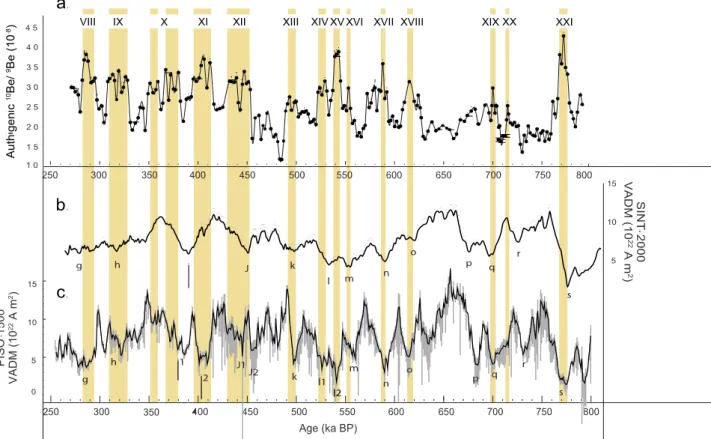
The authigenic
10Be/
9Be ratios vary between 1.18 and 4
.28 ×
10
−8. The
10Be/
9Be peaks are labelled from VIII to XXI, in
ac-cordance with the nomenclature introduced by Carcaillet et al.
(2004a) for the authigenic
10Be/
9Be ratio peak series of the
Por-tuguese margin. All peaks recorded in core MD05-2930 represent
1.4 to 2 times the values of the framing depth intervals, and
ex-ceed the value defined by “mean
+1
σ
”, except for numbers XIII,
XVI, XIX and XX. The average of the highest
10Be/
9Be values (above
“mean +1
σ
”) is 3.37 × 10
−8, and corresponds to a doubling of the
average of the lowest values (below “mean
−1
σ
”) (1.68 × 10
−8).
The most prominent
10Be/
9Be ratio peak, recorded at 3550–
3600 cm, documents a 1.7-fold increase compared to the average
ratio (2
.51 × 10
−8) calculated over the whole studied time interval.
The second major feature, recorded at 2530–2570 cm, documents
a 1.55-fold increase compared to the long-term mean value. All the
10
Be/
9Be enhancement factors are listed in Table 2.
4. Interpretation of the
10Be/
9Be dataset on a chronological scale:
Global character and implications for the cosmogenic nuclides
production during the B/M reversal and early Brunhes excursions
After being transferred to a time scale (cf. Section 2.2), the se-ries
of
10Be/
9Be ratio peaks can be correlated with the series of
the Geomagnetic Dipole Lows (GDL) documented in the SINT-2000
(Valet et al., 2005) and PISO-1500 (Channell et al., 2009)
paleo-magnetic reference records (Fig. 4).
The general correspondence between these time series confirms
that the
10Be/
9Be ratio variations recorded between 250 and 800
ka reflect the variation of the global
10Be atmospheric
produc-tion rate modulated by the magnetospheric shielding created by
the geomagnetic dipole field. The events of cosmogenic Be
over-production recorded between 250 and 800 ka undoubtedly
cor-respond to the series of Geomagnetic Dipole Lows evidenced in
the SINT-2000 and PISO-1500 stacks, that are generally associated
to paleomagnetic excursions (e.g. Channell et al., 2012) or to the
Brunhes/Matuyama reversal (Table 2).
1
– Between 280 and 290 ka, interval VIII documents a significant
( .5-fold) increase of the
10Be global production rate (Table 2)
correlated with GDL g in both SINT-2000 and PISO-1500. GDL
g was also reported at
∼ 290 ka as an RPI low, inducing a
10
Be enhancement associated with the Portuguese Margin
excursion
(Thouveny et al., 2004; Carcaillet et al., 2004a). The new
re-sults presented herein are the first confirmation at low latitude
of the occurrence of a global
10Be overproduction at
∼ 290 ka.
– Interval IX documents at
∼ 313 and ∼ 326 ka two
events (∼ 1.3-fold increases) of enhanced
10Be
global
production rate corresponding to GDL h characterized by a
double VDM
min-imum in PISO-1500. GDL h is associated with excursions
re-ported at 310–330 ka (Langereis et al., 1997; Lund et al., 2001;
Channell et al., 2012).
– Interval X documents several rapid and significant
10Be
over-production events (∼ 1.2- to ∼ 1.3-fold increases) between
350 and 380 ka (Fig. 4). Between 395 and 415 ka,
interval XI
Fig. 3. Geochemical and paleomagnetic proxies measured along core MD05-2930 depth scale: (a) benthic δ18O record with identified Marine Isotope Stages (MIS). (b) au-thigenic 9Be concentrations with 1
σ
uncertainty. (c) Decay-corrected authigenic 10Be concentrations with 1σ
uncertainty. (d) Decay-corrected authigenic 10Be/9Be ratioswith 1
σ
uncertainty. Dotted lines delimit the ±1-sigma envelope of the distribution around the long-term mean value ((2.51 ±0.04) ×10−8). Authigenic 10Be/9Beenhance-ments are highlighted by the vertical yellow bars and numbered from VIII to XXI, following the labelling system proposed by Carcaillet et al. (2004a) (Interval VIII has been correlated with GDL “g”). (For interpretation of the references to colour in this figure, the reader is referred to the web version of this article.)
Table 2
Geomagnetic Dipole Lows (GDL) in the MD05-2930 record (expressed as 10Be/9Be increases), and corresponding GDL in the SINT-2000 and/or in the PISQ-1500 records. 10Be/9Be enhancements labels Depth (cm) Depth of the 10Be/9Be maxima (cm)
Age of the 10Be/9Be
maxima (ka) Enhancement factors vs. longterm average (vs. framing values) Marine isotope stages GDL label* 1.5 (1.7) 1.3 (1.6) 1.25 (1.55) 1.5 (1.5) 1.3 (1.6) VIII IX X XI XII XIII XIV XV XVI XVII XVIII XIX XX XXI 1440–1520 1570–1660 1740–1860 1900–1980 2030–2140 2310–2360 2460–2500 2530–2570 2600–2620 2700–2810 2880–2960 3090–3220 3290–3380 3550–3600 1470 1590; 1620; 1650 1810; 1830; 1860 1960 2070; 2110 2320 2490 2560 2610 2780 2910 3190 3300 3580 ∼285 ∼313; ∼319; ∼326 ∼367; ∼372; ∼380 ∼406 ∼439; ∼447 ∼493 ∼52 5 ∼54 0 ∼55 3 ∼58 8 ∼61 5 ∼70 0 ∼71 5 ∼77 3 1.25 (1.5) 1.55 (2.0) 1.2 (1.45) 1.4 (1.7) 1.25 (1.6) 1.2 (1.6) (1.4) 1.7 (2.5) 8 9 10 11 12 13 14 14 14 15 15 17 18 19 g h i1 i2 j k l1 l2 m n o p, q r s
* According to a nomenclature proposed by Thouveny et al. (2008).
![Table 1 (continued) Sample: depth in core MD05-2930 (cm) Age Sample (ka BP) weight(g) Measured10Be/9Be (10 − 11 ) * [ 10 Be] auth](https://thumb-eu.123doks.com/thumbv2/123doknet/13669663.430446/8.892.52.866.114.1098/table-continued-sample-depth-core-sample-weight-measured.webp)
![Table 1 (continued) Sample: depth in core MD05-2930 (cm) Age Sample (ka BP) weight(g) Measured10Be/9Be (10 − 11 ) * [ 10 Be] auth](https://thumb-eu.123doks.com/thumbv2/123doknet/13669663.430446/9.892.63.892.103.276/table-continued-sample-depth-core-sample-weight-measured.webp)