HAL Id: hal-03060157
https://hal.archives-ouvertes.fr/hal-03060157
Submitted on 13 Dec 2020HAL is a multi-disciplinary open access archive for the deposit and dissemination of sci-entific research documents, whether they are pub-lished or not. The documents may come from teaching and research institutions in France or abroad, or from public or private research centers.
L’archive ouverte pluridisciplinaire HAL, est destinée au dépôt et à la diffusion de documents scientifiques de niveau recherche, publiés ou non, émanant des établissements d’enseignement et de recherche français ou étrangers, des laboratoires publics ou privés.
Co3O4-MnOx oxides supported on SBA-15 for CO and
VOCs oxidation
S Todorova, J Blin, A Naydenov, Lebeau Bénédicte, H Kolev, P Gaudin, A
Dotzeva, R Velinova, D Filkova, I Ivanova, et al.
To cite this version:
S Todorova, J Blin, A Naydenov, Lebeau Bénédicte, H Kolev, et al.. Co3O4-MnOx oxides sup-ported on SBA-15 for CO and VOCs oxidation. Catalysis Today, Elsevier, 2020, 357, pp.602-612. �10.1016/j.cattod.2019.05.018�. �hal-03060157�
Co3O4-MnOx oxides supported on SBA-15 for CO and VOCs oxidation
S. Todorova1*, J. L. Blin2, A. Naydenov3, B. Lebeau4, H. Kolev1, P. Gaudin2, A.
Dotzeva1, R. Velinova3, D. Filkova1, I. Ivanova1, L. Vidal4, L. Michelin4, L. Josien4, K.
Tenchev1
1Institute of Catalysis, Bulgarian Academy of Sciences, Acad. G. Bonchev St., Bldg.
11, 1113 Sofia, Bulgaria
2Université de Lorraine/CNRS, L2CM, UMR7053, F-54506 Vandoeuvre-lès-Nancy
cedex, France
3 Institute of General and Inorganic Chemistry, Bulgarian Academy of Sciences, Acad.
G. Bonchev St., Bldg. 11,1113 Sofia, Bulgaria
4 Université de Haute Alsace (UHA)/CNRS, IS2M, UMR 7361, 68093 Mulhouse cedex,
France
Abstract
Mono- and bi-component cobalt and manganese samples were prepared by ‘‘two-solvent’’ technique using SBA-15 as a support. The obtained materials were characterized by SAXS (Small angle X-Ray scattering), N2 adsorption-desorption, X-ray diffraction, TEM
(Transmission Electron Microscopy), X-ray photoelectron spectroscopy (XPS), TPR (Temperature-programmed reduction) and O2-TPD (Oxygen Temperature-programmed
desorption). The catalytic properties were tested in the complete oxidation of propane, n-hexane, and carbon monoxide.
The modification of the SBA-15 materials with Co, Mn or simultaneously with both cobalt and manganese does not change significantly the mesoporous structure, however its pores are partially blocked by the oxides, resulting in the decrease in the specific surface area and in the pore volume. In the case of mono component Co-SBA-15, the clusters of Co3O4 are
on the surface and they are partially located inside the pore system of SBA-15 while for Mn-SBA-15 sample, the oxide phases preferentially fill up the channels of Mn-SBA-15 forming nanowires. The mixed oxide nanowires are formed in the channels of CoMn-SBA-15 material along with small nanoparticles, aggregated outside of the channels.
The mesoporous structure and morphology of SBA-15, type of oxide phases and the size of the oxide particles remain almost unchanged after tests in reaction of complete n-hexane oxidation and this is valid for all studied samples. The observed resistance towards agglomeration can be attributed to the mesoporous structure. On the other hand, after reaction the surface concentration of different cobalt and manganese species undergoes significant changes, except for the sample with equimolar Co:Mn ratio.
The most active catalyst among bi-component Co-Mn samples in all studied reactions, is the catalyst where the Co:Mn molar ratio is 1:0.5, which can be explained by the formation of finely divided oxides, thus ensuring highest reducibility and oxygen mobility.
Key words: SBA-15; Co-Mn-SBA-15; n-hexane combustion; propane oxidation, CO oxidation
Introduction
Abatement of volatile organic compounds (VOCs) and CO contents in the waste gases is an important task for environmental protection and odour control. There exist a great number of successful commercial catalysts developed for CO and VOC complete oxidation. Nevertheless, there still exists a demand for developing some new optimized catalysts with increased efficiency of mass and heat transfer and which should not contain any noble metals. Transition metal oxides have shown some very good catalytic activities in oxidation reactions, but their main drawback is the deactivation of the catalysts as result of sintering. Among all studied metal oxides the most active single metal oxides are those of Cu, Co, Mn and Ni [1]. Manganese and cobalt containing catalysts are less expensive and demonstrate high activity in CO and VOCs complete oxidation [2]. The catalytic properties of MnOx-based catalysts are attributed to the ability of manganese to form oxides having different oxidation states and their high oxygen storage capacities (OSC) [3, 4]. The Co3O4-based catalysts offer the best
balance between cost and catalytic activity since their behaviour is often very close to that of expensive noble metals and its selectivity to CO2 is higher, when comparing them to other
transition metal oxide catalysts (such as Mn2O3 or V2O5) [5, 6, 7, 8]. Cobalt oxide is reported
to be quite promising among the metal oxides used for preparation of supported catalysts for the removal of CO even at room and lower temperatures [9]. Wang et al. [10] determined the key factors for the extraordinarily high catalytic activity of Co3O4-based catalysts: CO
adsorption strength, the barrier of CO reacting with the lattice oxygen and the redox properties of Co3O4. There are investigations, according to which the cobalt - based catalysts
with high cobalt dispersion degrees are active in methane [11], propane [12] toluene [13, 14] removal. It is generally observed that the morphology or the crystal plane of Co3O4
nanocrystals can remarkably alter their catalytic performance [5]. The combination of Co3O4
and other different oxides such as CeO2, ZrO2, Al2O3, etc. often affects the textural,
morphological, redox, acidic and basic properties, as well as the catalytic activity. Cobalt-manganese oxides demonstrate high catalytic efficiency in oxidation of CO, benzene, toluene, 2-propanol, propane and other pollutants [15, 16]. In our previous study [17] we established that the combination between cobalt and manganese oxides changed significantly the activity in the n-hexane and methane oxidation [18] and this activity depended on the sequence of cobalt and manganese introduction to the catalyst sample.
The main drawback of the transition metal oxides-based catalysts is their deactivation as a result of an aggregation. The problem could be overcome by applying novel preparation methods and application of supports with some new properties, as those demonstrated by nanostructured mesoporous oxides. The mesoporous supports would give rise to well-dispersed and stable metal particles, supplying abundant pores and large specific surface areas, thus possessing a great potential in further improvement of the catalytic performance. SBA-15, MCM-41, MCM-48, KIT-6 are used as supports for noble and transition metal catalysts for oxidation of CO and VOC. SBA-15 has attracted much interest since it possesses a regular hexagonal array of pores with uniform diameter, a very high specific surface area and high pore volume. It is also inert and stable at elevated temperature and has good mechanical stability. Moreover, its surface can be easily functionalized [19]. Z. Xiao-Dong et al. summarized the recent results in the removal of volatile organic compounds by mesoporous silica materials and supported catalysts [20].The strong effect of support pore topology on the formation of cobalt [13, 21], iron [22] and bi-component copper and ceria [23], manganese [24] nanoparticles hosted in mesoporous silicas type SBA-15 and KIT-6 are
illustrated in the investigation by Tsoncheva and co-authors. In their work [22] the modifications of SBA-15, KIT-5 and KIT-6 mesoporous silicas with different pore sizes with cobalt oxide was studied. It was established that the supports with larger mesopores facilitated the formation of easily reducible Co3O4 spinel particles. However, the interconnectivity of the
mesopores and the uniformity of the channel dimensions also had some influence on the catalytic activity, implying that mass-transfer effects occur, especially in the case of supports with cage-like mesopores. More homogeneously dispersed MnOx nanoparticles are formed on 2D-silica type SBA-15, while the more opened 3D-structure of KIT-6 provokes the formation of more highly exposed to the reactants manganese species [24]. To the best of our knowledge there are no reports concerning simultaneous modification of SBA-15 with both cobalt and manganese oxides.
As it was mentioned above in our previous investigations the combination between cobalt and manganese oxides changed significantly the activity in the n-hexane and methane oxidation [17, 18]. The present work is a continuation of our research efforts in the field of application of mixed Co-Mn oxide catalysts for the combustion of different VOC. The work is focused on the investigation of the structural and catalytic properties of series of mono-component cobalt and manganese and bi-mono-component Co-Mn catalysts supported on SBA-15.
The selected test reactions are CO oxidation and combustion of propane and n-hexane. The specified volatile organic compounds are chosen because the propane is the main component in LPG (composed of primarily propane and butane) and n-hexane, because it is the component of many products related to industry and it participates in a radical chain reaction yielding compounds, which exist in the photochemical smog. CO is widespread and highly toxic gas, which requires its elimination in waste gases.
2.Materials and methods 2.1. Catalysis preparation
SBA-15 was synthesized by a sol-gel route according to a standard procedure in the presence of a triblock copolymer, Pluronic P123 [(EO)20(PO)70(EO)20], as structure-directing
agent [25]. In a typical synthesis: 2.66 g of P123 were dissolved in 100 mL of a hydrochloric acid solution (1 M). Then, 4.17 g of TMOS, the inorganic precursor, were added and the mixture was stirred at room temperature for 30 min. Afterwards the solution was transferred into an autoclave and heated at 40 °C in the course of 24 h following by a heating at 100 °C for 48 h. The mesoporous silica material was obtained after surfactant extraction by ethanol lasting for 48 h using a Soxhlet apparatus. The powder was then dried up in vacuum overnight to achieve SBA-15 as a white powder.
Both single component (Co and Mn) as well as bi-component samples were prepared according to the ‘‘two-solvent’’ technique [26]. The SBA-15 material was first suspended in dry hexane, used as hydrophobic solvent. Then, a desired amount of metal nitrate was dissolved in distilled water, the quantity corresponding to the pore volume of SBA-15 determined by N2 adsorption. This aqueous solution containing metal precursors was then
added dropwise to the suspension. The gel was allowed to age for 2 h under vigorous stirring. The solid phase was recovered by filtration and dried up in air and then calcined for 3 h at 500°C in air atmosphere. The samples were denoted as Co-SBA-15, Mn-SBA-15, 1CoMn0.5SBA-15, 1Co1Mn-SBA-15, and 1Co2Mn-SBA-15, where the number represents the Mn and Co number of moles.
2.2. Catalyst samples characterization
The obtained materials were characterized by SAXS, N2 adsorption-desorption, X-ray
diffraction, SEM and TEM microscopy.
Small angle X-Ray scattering (SAXS) data were collected on a “SAXSess mc²” instrument (Anton Paar), using line-collimation system. This instrument is attached to an ID 3003 laboratory X-Ray generator (General Electric) equipped with a sealed X-Ray tube (PANalytical, λ Cu, Kα = 0.1542 nm) operating at 40 kV and 50 mA. Each sample was introduced into a “Special Glass” capillary for liquids and liquid crystals (Ф = 1.5 mm and 2.0 mm for micellar solutions and liquid crystals, respectively), or between two sheets of Kapton® for materials, then placed inside an evacuated sample chamber, and exposed to X-Ray beam. Scattering of X-X-Ray beam was registered by a CCD detector (Princeton Instruments, 2084 x 2084 pixels array with 24 x 24 µm² pixel size) at 309 mm distance from the sample. Using SAXSQuant software (Anton Paar), the 2D image was integrated into one-dimensional scattering intensities I(q) as a function of the magnitude of the scattering vector q = (4π/λ) sin(θ), where 2θ is the total scattering angle. Thanks to a translucent beam-stop allowing the measurement of an attenuated primary beam at q = 0, all measured intensities can therefore be calibrated by normalizing the attenuated primary intensity. Data were then corrected for the background scattering from the cell and for slit-smearing effects by a desmearing procedure from SAXSQuant software, using Lake method.
Nitrogen adsorption–desorption isotherms were carried out at −196 °C within a wide relative pressure (P/P0) range varying from 0.010 to 0.995 with a volumetric adsorption
analyzer TRISTAR 3000 manufactured by Micromeritics. Before measurements, the samples were outgassed under vacuum (pressure = 0.13 mBar) at 25 °C for 16 hours. The specific surface area of each sample was calculated by the Brunauer–Emmett–Teller (BET) method [25]. The pore diameter and the pore size distribution were determined from the adsorption branch of the corresponding isotherm using the Barret–Joyner–Halenda (BJH) method [28].
Wide angles X-Ray diffraction patterns were collected on a PANalytical MPD X'Pert Pro diffractometer operating with Cu Kα radiation (Kα=0.15418 nm) equipped with an X'Celerator real-time multiple strip detector (active length=2.12°2θ). The XRD powder patterns were collected at 25°C within the range 3<2θ<70, step= 0.017°2θ, time/step=220s. The phases identification has been realised with the X’PertHighscore software (PANalytical) and the PDF-4+ 2018 database from the International Centre for Diffraction Data (ICDD).
Transmission Electron Microscopy (TEM) images, chemical analyses and electron diffraction of the samples were performed using a JEOL ARM200-CFEG microscope operating at 200 kV. Prior to the observation, the powder was dispersed into chloroform by ultrasonic treatment and a few drops of the suspension were deposited on the surface of a gold observation grid covered with a formvar or amorphous carbon film. The EDX analyses and chemical mappings were performed using a JEOL Centurio detector. The electron diffraction micrographs were acquired with a camera length of 300 mm.
X-ray photoelectron spectroscopy (XPS) was carried out using ESCALAB MkII (VG Scientific) electron spectrometer at a base pressure in the analysis chamber of 5x10⁻¹⁰ mbar
(during the measurement it was 1x10⁻⁸ mbar), using AlKα X-ray source (excitation energy
hν=1486.6 eV). The pass energy of the hemispherical analyzer was 20 eV (because of its weak signal for Co2p 50 eV pass energy was used), 6 mm slit widths (entrance/exit). The instrumental resolution measured as the full width at a half maximum (FWHM) of the Ag3d5/2 photoelectron peak is 1 eV. The energy scale is calibrated with respect to the Si2p -
peak maximum at 103.3 eV for electrostatic charging. The processing of the measured spectra is described in [17, 18].
Temperature-programmed reduction (TPR) was carried out using a flow mixture of 10% H2 in argon at a flow rate of 10 ml.min–1 and a temperature ramp of 10 deg.min–1 up to
700°C. Prior to the TPR experiments, the samples were treated in argon flow at 150°C for 1 h. Oxygen-TPD data were obtained by using of oxygen gas analyser Teledyne Mod. 802 (paramagnetic principle). The samples (0.14 g) pre-treatment consisted of heating in flow of 5% O2 in N2 at 450oC for 6 hours, then cooling down to room temperature in the same
gaseous mixture. The applied heating rate was 7.5 K. min–1, gas flow rate: nitrogen, 500
ml.min–1.
2.3. Catalytic activity
The catalytic properties were tested in the complete oxidation of propane, n-hexane and carbon monoxide.
The catalytic activity tests in CO oxidation reaction were carried out in a flow type of glass reactor at atmospheric pressure with a catalyst loading of about 0.5 cm3 (fraction 0.25–
0.31 mm). The gaseous mixture consisted of 1vol. % CO, 10 vol.% O2 and He for balance to
100 vol.%. External mass transfer limitations were minimized by operating at high gaseous hourly space velocities (GHSV) (60 00 h–1). The converted mixture analysis was performed
by a HP5890 series II gas chromatograph equipped with a thermal conductivity detector (TCD) and Carboxen-1000 GC column.
Catalytic activity tests in the complete oxidation reactions of propane and n-hexane were performed using an integrated quartz micro-reactor and mass spectrometer analysis system (CATLAB, Hiden Analytical, UK). The converted gas mixture analysis was carried out using the mass-spectrometer of the CATLAB system and in addition to it the on-line analysis of CO/CO2/O2 (Maihak, NDIR) and THC-FID (total hydrocarbon content with a
flame ionization detector, Horiba). The check for possible formation of oxidized organics by-products was performed by GC - MS analyser, model AL7890A.
Reactant gases were supplied through electronic mass flow controller system. The catalysts (particle sizes of 0.3–0.6 mm) were held between plugs of quartz wool in a quartz tubular vertical flow reactor (ø = 6 mm). In order to maintain almost the same heat, released by the reaction for each hydrocarbon, propane (ΔH = 2220.0 kJ/mol) and nhexane (ΔH = -4163.7 kJ/mol) inlet concentrations in synthetic air were kept at 2000 and 1000 ppm, respectively. The same GHSV as that for CO tests was used (60 000 h–1).
3. Results and Discussion
3.1. Characterization of catalyst samples
The characterization of all catalyst samples was done as prepared and after n-hexane oxidation.
3.1.1. Characterization of the mesoporous catalysts
The SAXS pattern of the parent SBA-15 exhibits three lines at 10.7, 6.2 and 5.3 nm (Fig. 1A Supplementary data). They are characteristic of the (100), (110) and (200) reflections of the 2D-hexagonal arrangement of the mesoporous channels. SBA-15 exhibits a type IV isotherm (Fig. 1B Supplementary data), according to the IUPAC classification [29]. An H1 type of hysteresis loop, in which adsorption and desorption branches are steep, has been observed. The specific surface area and pore volume values are respectively 982 m²/g and
0.99 cm3/g. The pore diameter distribution determined by using the BJH method is quite
narrow and it is centred at ca. 9.0 nm (Fig. 1C Supplementary data).
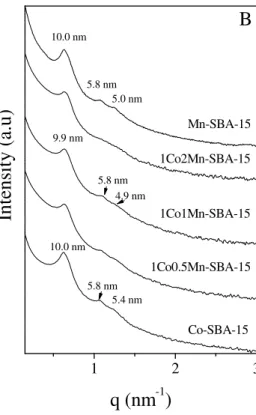
After the introduction and decomposition of the cobalt and/or manganese precursors the hexagonal mesopore ordering is still observed (Fig. 1A) but the d100 is slightly shifted
towards lower values (from 10.7 to about 10.0 nm) and the intensity of the peaks decreases (Fig 1A). The d100 shift indicates shrinkage of the mesopores after calcination at 500°C to
decompose the Co and Mn precursors, whereas the decrease in the intensity implies that some metal species fill up the mesopores of the SBA-15 [30]. More noticeable reduction in intensity is observed with the samples with a higher manganese content indicating that Mn most likely is responsible for filling up the mesopores. This fact is further confirmed by TEM images. The hexagonal structure is preserved after the reaction (Fig. 1B). There is no variation in the d-spacing values but it can be seen that the reflections are better resolved and that they present a higher intensity, in particular for the case of Mn-rich catalysts.
The TEM images of all materials (Fig. 2) are coherent with the presence of SBA-15 particles with well-ordered mesopores in a 2D hexagonal arrangement. Both Co-SBA-15 and Mn-SBA-15 show the presence of well dispersed large dark particles that are in contrast with the dark grey silica walls and the light grey voids of the pores (Fig. 2a-d). Dark particles more or less spherical are observed for Co-SBA-15 with an average size ranging 100 nm that is much larger than the diameter of the parent SBA-15 (Fig. 2a). At high magnification ordered channels could be distinguished on the large nanoparticles, which indicates that the large nanoparticles were inside the nanochannels and these are composed of small nanoparticles in adjacent channels due to the micropores in the walls of SBA-15 (Fig. 2b). Similar morphology was observed for Co3O4 nanoparticles generated within the mesopores of
SBA-15 in supercritical CO2 and nitric acid as co-solvent [31]. When aggregates are being formed
close to the particle surface, the formation of Co3O4 outside the pores is also observed. In the
case of Mn-SBA-15 dark nanowires along pores and images at high magnification indicate that they fill up the mesopores (Fig. 2c, d). For the mixed 1Co1Mn-SBA-15 material, a mixture of aggregated small nanoparticles in adjacent channels and nanowires is observed (Fig. 2 e, f).
The EDX analyses (Fig. 3) were performed with the all studied samples and Co and Mn element mapping confirmed the only presence of Co and Mn in the same phase in the two component catalysts.
The TEM observations after carrying out reaction (Fig 2 Supplementary data) were performed on the Co-SBA-15, Mn-SBA-15 and 1Co1Mn-SBA-15 materials. Among two-component Co-Mn sample the 1Co1Mn-SBA-15 was chosen for TEM study after reaction, due to the fact that the surface concentration of cobalt and manganese species changed insignificant and this gave us reason to assume that this sample would show the highest stability. In all cases the SBA-15 particles were observed partially broken. The morphologies of the Co and Mn nanoparticles are similar to those before reaction (Fig. 2 Supplementary data a-d). For mono component manganese sample, some aggregates of nanoparticles are coexisting with nanowires (Fig. 2 Supplementary data e, f). EDX analyses (Fig. 3 Supplementary data) were also performed and element mapping is coherent with the only presence of Co, Mn and mixed Co/Mn in Co-SBA-15, Mn-SBA-15 and 1Co1Mn-SBA-15 materials, respectively. EDX spectra were also recorded at low magnification by using SEM to determine the element composition (Table 1). The Co-SBA-15, Mn-SBA-15 and 1Co1Mn-SBA-15 materials have roughly the same composition before and after carrying out the reaction: about 7.3% of Co, 8.0 % of Mn, 3.5%Co/4.1%Mn, respectively.
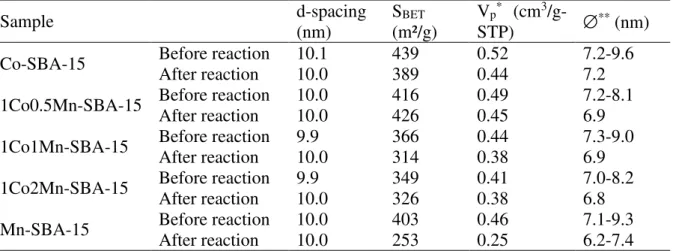
Except a decrease in the nitrogen adsorbed volume, no significant change is noted in the adsorption branch of the isotherm (Fig 4A). In contrast to it the shape of the desorption branch indicates that some of the mesopores are blocked. After the introduction of the active metals a decrease both in the specific surface area and in the pore volume was observed (Table 2). Meanwhile, the pore size distribution (Fig. 5A) presents two components at about 7.0 nm and 9.0 nm, taking into account the error of the measurement. The smallest value is in accordance with the introduction of the metal species in the mesopores and their shrinkage upon calcination at 500°C and the second one reflects a mesopores blocking.
All the results reported above imply that the active metal oxides are confined inside the mesopores but also that some part of them is deposited at the entrance of the channels.
Figure 4B represents nitrogen adsorption- desorption analyses after the reaction. Based on the nitrogen adsorption- desorption analyses it can also be concluded that the feature of the isotherm is not significantly modified. We still have type IV isotherm, characteristic of mesoporous materials. A decrease in the specific area and in the mesopore volume is noticed (Table 2). Concerning the specific surface area, the decrease varies between 6.5 and 11% for the Co and for the mixed catalysts and it reaches 33% for the Mn-based catalyst. The latter sample also shows the highest decrease in the mesopore volume: 45% comparing with the other materials (between 9 and 15%). We can also observe a modification of the mesopore size distributions (Fig. 5B). Even if they are asymmetric, it seems that the component at about 9.0 nm disappears, while the other one at about 7.0 nm still persists. It can be assumed that during the reaction, which has been performed up to 500°C, the clogged mesopores shrink to reach a similar diameter than the ones filled by the metal oxides. The mesopore diameter after the reaction is in accordance with the one obtained for a bare SBA-15 calcined in this range of temperature [30]. The size of the mesopores containing the metal oxides is not significantly modified since their presence prevents the shrinkage. The metal oxides species seem to consolidate the mesoporous silica framework.
Based on the results from the applied instrumental methods it can be concluded that the modification of SBA-15 with Co and Mn does not change significantly the mesoporous structure of silica support. It can be supposed that the decrease in the specific BET surface area, pore volume and the insignificant modification of the adsorption-desorption curve shape is due to the partial pore blocking by cobalt and manganese oxide particles, which is confirmed also by ТЕM images. The most significant lowering of the surface area and pore volume is observed in the mono-component manganese sample, indicating that most of the oxide is located in the SBA-15 channels. As it is shown by the TEM images, the manganese oxide formed nanowires. Significant changes in the mesoporous structure and morphology are not observed after the reaction.
3.1.2. Characterization of the supported metal species
The oxidation states of Co and Mn on the surface is examined by XPS. Fig. 4 from Supplementary data shows an example curve fitting of Co2p1/2 (left-hand side) and Mn2p
(right-hand side) core levels of investigated samples before the catalytic activity test. A peak in the energy range of 792-798 eV is measured for cobalt with defined binding energies (BEs) either of 794.9 eV (Co3+) or 795.9 eV (Co2+), respectively. The presence of Co2+ ions in the
cobalt-containing samples is confirmed by the presence of a peak with binding energy of 795.9 eV, together with the relatively intensive 3d→4s "shake-up" satellite with binding energy of 803-804 eV (Figure 4A Supplementary data). The Mn2p peaks are measured in the energy range 636-658 eV consisting of both Mn2p3/2 and Mn2p1/2 core levels. For all
measured samples we have observed both Mn3+ and Mn4+ oxidation states (Supplementary
data Fig. 4B) with BE of 640.4 eV and 642.0 eV, respectively. The small satellite structure with BE of ca. 644.0 eV also proves the presence of Mn4+ ions on the surface, according to
the curve fitting procedure [33]. Mn4+predominates on the surface in all samples containing
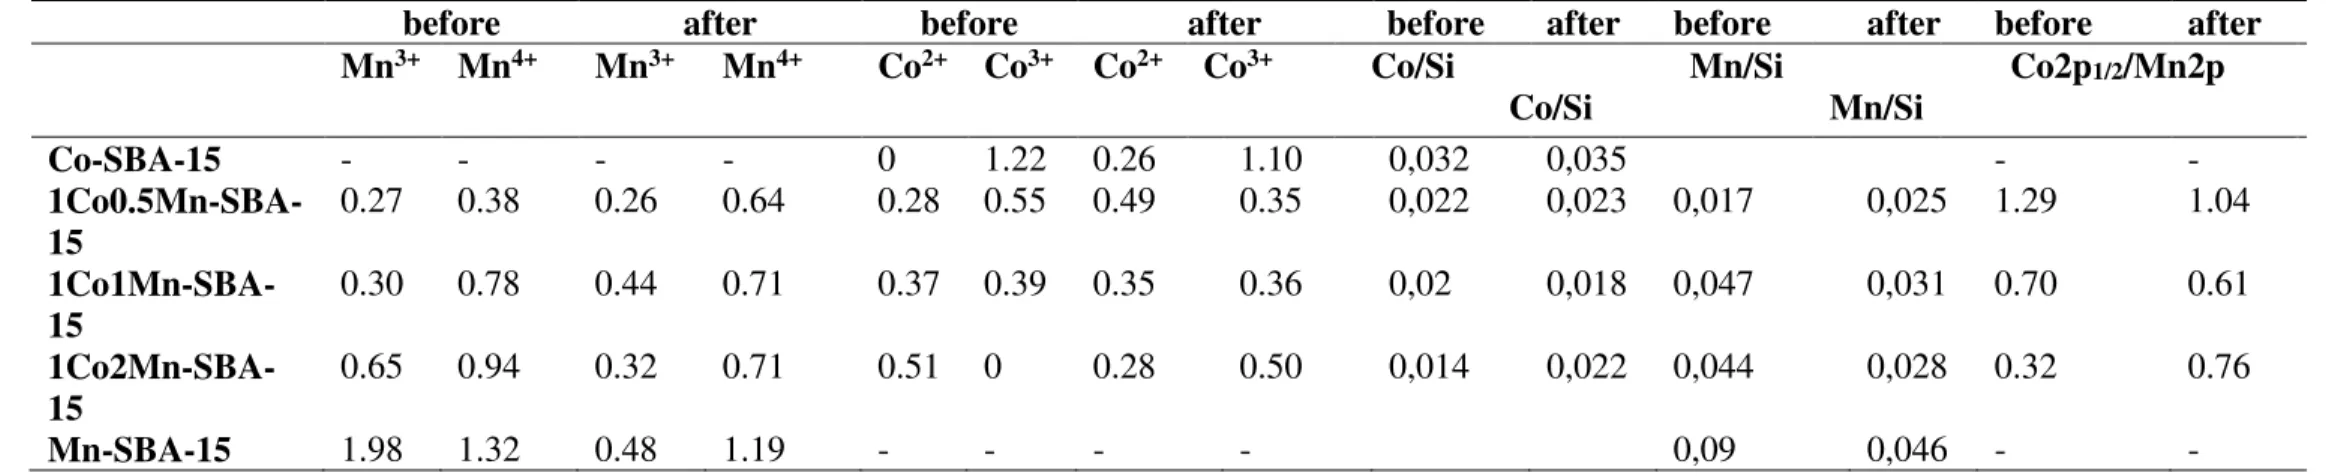
manganese and its concentration increases with increasing Mn loading (see Table 3). The only manganese containing sample before catalytic activity test differs from this behavior showing predominanceof Mn3+ ions on the surface. From the XPS analysis it is visible, that with
increasing of the amount of manganese the relative abundance of Co3+ ions sharply decrease
and Co2+ is only species in the sample with highest Mn concentration (see Table 3). The
same tendency was observed in our previous investigations regarding bi-component Co-Mn catalysts supported on SiO2 [17] or bulk Co-Mn mixed oxide [34]. According to the authors
of ref. [35], the doping of manganese into the spinel structure of cobalt oxide increased crystal defects, which probably caused the increase in the amount of octahedrally coordinated divalent cobalt cations that are responsible for catalytic activity. El-Shobaky et al. [36] explained the increase in the lattice constant of Co3O4 after incorporation of manganese with
the conversion of some Co3+ into Co2+.
After the n-hexane oxidation reaction, one can summarize the results from XPS – investigation as follows:
• The Co2p1/2/Mn2p ratio on the surface of the samples 1Co0.5Mn-SBA-15 and
1Co1Mn-SBA-15 decreases demonstrating enrichment in the Mn component. The opposite trend is observed for the 1Co2Mn-SBA-15 material.
• The Co/Si ratio decreases insignificantly for all cobalt containing samples, except for the 1Co2Mn-SBA-15 where it is increased. The ratio between different cobalt species (Co2+/Co3+) varies depending on the manganese content - it increases about three
times for 1Co0.5Mn-SBA-15 and it changes insignificantly for 1Co1Mn-SBA-15. For the sample, in which before the reaction (1Co2Mn-SBA-15) the cobalt was present mainly as Co2+, part of it was oxidized to Co3+.
• The concentration of Mn4+ on the surface of 1Co0.5Mn-SBA-15 increases by
68% and that of Co2+ by 75%. These very close values could be explained by the electronic
transfer between Co and Mn according the following equation:
Co3+–Mn3+↔ Co2+–Mn4+ (1)
It can be expected that in the MnxCo3−xO4 solid solution, the electron transfer between
Co2+ and Mn4+. could occur [37]. Thus, a part of Co3+and Mn3+ might be converted into Co2+
and Mn4+. The formation of Mn-Co solid solution is confirmed by TEM and XRD
measurements.
The wide-angle XRD pattern (Fig. 6) of the 2Co-SBA-15 material presents low and broad peaks corresponding to crystalline Co3O4 phase (Card N 01-071-4921). Concerning the
Mn-SBA-15 material, the wide-angle XRD pattern exhibits low and broad peaks indicating the coexistence of the phases MnO2 Pyrolusite (card N° 01-071-4824) and Mn2O3 Bixbyite
(Card N°00-041-1442). The broad line at a slightly lower 2θ angle (2θ =36,5) in comparison with that of single component cobalt is observed with the bi-component Co-Mn samples indicating Co-Mn mixed oxide formation, a loss of crystallinity and decrease in the particle size [17]. The particle size calculation using the reflection at 2θ=36.5, coming from the [311] plane, decreases from 15 nm for mono-component cobalt down to 4 nm for bi-component Co:Mn samples. The decomposition of supported mixed cobalt and manganese nitrates at low
temperatures (250–400 ºC) often produces finely divided non-stoichiometric spinels. In order to verify this hypothesis and to determine whether the solid solution corresponds to Mn inserted into Co3O4 or to Co inserted into Mn3O4, electron diffraction was applied. The
obtained electron diffraction micrograph was compared with the electron micrographs of Co3O4 and Mn3O4 from ICDD data base (cards N° 03-065-3103 and N° 00-024-0734,
respectively) and it was found out to be similar to the one of Co3O4 (Fig 7). This comparison
is in agreement with the formation of solid solutions MnxCo3-xO4 corresponding to Mn
inserted into Co3O4 phase [38].
After the n-hexane oxidation the XRD patterns (Fig. 5 Supplementary data) of mono component Co-SBA-15, Mn-SBA-15 and bi-component CoMn-SBA-15 materials are similar to those before reaction indicating that crystalline phases are not affected.
The TPR profiles of all samples are shown in Figure 8. Three reduction peeks are visible in the TPR spectra of mono component cobalt sample. The first two at 324 and 354 ºC are attributed to the reduction of large size supported Co3O4 particles [17]. The third one,
which is centered at 481ºC, is to be ascribed to small particles strongly interacting with the support [21]. As it was shown by TEM the large nanoparticles were located inside the nanochannels and composed of small nanoparticles in adjacent channels due to the micropores in the walls of SBA-15. The reduction profiles of the single component manganese samples correspond to the two-step reduction of Mn3O4 (MnO2→ Mn3O4
→Mn3O4; Mn3O4→MnO) [33].
The Co-Mn catalysts start their reduction process at lower temperature comparing with the mono component one. For all bi-component samples, three reduction peaks are visible. According to the authors of ref. [15] the hydrogen consumption at lowest temperature can be associated with easily reducible highly dispersed surface Mn4+ species coming from by nano
Co-Mn oxide and adsorbed oxygen species (CoxMnyOz (s)+H2(g)→ Mn3O4 - Co3O4 (s) +
H2O(g)). The second reduction band could be ascribed to the reduction of Mn3O4 and Co3O4
(Mn3O4-Co3O4 (s)+H2(g)→MnO-CoO(s) +H2O(g)) [39, 40]. The third step is to be assigned
to reduction of Co2+ to metallic cobalt since the process of Mn2+→Mn0 needs temperature
higher than 1200℃ [41]. As can be seen, the modification with manganese leads to a shift of the three reduction peaks to a lower temperature, indicating that the reduction of the samples increases. The highest shift is observed for the sample with the smallest quantities of manganese ‒ 1Co0.5Mn-SBA-15, which indicates that it is with best reduction properties among all two component catalysts.
The O2-TPD experiment was performed in order to obtain information about the type
of oxygen species on the surface of the studied catalyst samples. Three desorption regions are observed in the O2-TPD spectra: 50-170 oC, 200-300 oC and 300-425 oC (Figure 9). Acording
to the current literature the lower temperature desorption peak (< 200°C) is ascribed to desorption of physically adsorbed oxygen. The desorption of chemisorbed oxygen occurs at 200°C to 400°C, while the desorption at higher temperatures (> 400 °C) corresponds to the bulk lattice oxygen in the structure [42, 43]. Song et al. [44] have classified the oxygen desorption peaks for mesoporous cobalt oxides as follows:
-desorption of surface adsorbed peroxy O2−(ad) species within 150−250°C interval;
-desorption of surface adsorbed O−(ad) species within the interval 280−340 °C;
-desorption of surface lattice oxygen O2− (ad/lattice) within the interval 350−670 °C;
and beyond 700 °C appears the desorption of bulk lattice oxygen.
By comparing our results with the data in the literature, we can ascribe the TPD peak in the T1 region to desorption of physically adsorbed oxygen in the T2 to the O2−(ad) species
and in the T3 interval to the O−(ad) species. As can be seen from the figure, the oxygen
continues to desorbs above 400 °C for the catalyst with 0.5 mol manganese (1Co0.5Mn-SBA-15). According to the literature, this form of adsorbed oxygen can be related to the surface lattice oxygen O2− (ad/lattice). If we camper the O
2-TPD spectra of the monocomponent
cobalt sample with that of the two component Co-Mn, it is visible that the doping of cobalt oxide with manganese shifts desorption peaks in the T2 interval to the lower temperature, revealing the greater mobility of the O2−(ad) species. Only the sample1Co0.5Mn-SBA-15
shows desorption of oxygen from the surface lattice at temperatures lower than 450 °C. As the experiment was terminated at 450° (temperature at which 100% conversion for all tested compounds was observed) for other catalysts most likely that desorption is performs at higher temperatures. The shifts of the desorption peaks in the intervals T2 and T3 to the lower temperature could be explained by the loss of crystallinity (as it was shown by XRD data) and as a result an increase in the number of vacancies due to structural defects. These vacancies can provide centers for adsorption of oxygen [8, 45]. The concentration of Co2+ ions on the
surface of two component samples is increased as was revealed from XPS data (seen on Fig. 3). Co2+ ions can be centres for oxygen adsorption and formation of active oxygen species
which are a prerequisite for catalytic oxidation [47]. The correlation between catalytic activity in toluene combustion and surface Co2+ concentration was demonstrated by E. Genty and
co-authors [8].
Based on the results discussed in this section it can be concluded that:
• The main phase for a single component cobalt sample is Co3O4. The co-existence of
two types of Co3O4 particles could be assumed: large supported Co3O4 particles and
small particles strongly interacting with the support. The particle clusters of Co3O4 are
on the surface and they are partially located inside the pore system of SBA-15. The Co3+ is the only species on the Co-SBA-15 surface.
• MnO2 (pyrolusite) and Mn2O3 (bixbyite) are formed in a single component Mn
catalyst supported on the SBA-15. The oxide particles are mostly located inside the channels of SBA-15 filling them up, leading to a substantial drop in the surface area and in the pore volume.
• The doping of cobalt oxide with Mn leads to: (1) Formation of finely divided oxides. (2) Higher oxygen mobility in the bi-component Co-Mn samples. The sample with highest mobility of the surface adsorbed O2−(ad) and surface lattice oxygen species is
that with 0.5 mol manganese (1Co0.5Mn-SBA-15). (3) Upon increasing the amount of Mn the relative abundance of Co2+ ions on the surface increases.
3.2. Catalytic activity
The temperature dependencies of the CO, propane and n-hexane complete oxidation over the mono- and bi-component catalysts are shown in Figure 11. H2O and CO2 were the
only detectable reaction products of VOC oxidation on all investigated samples. The only detectable product of incomplete oxidation was CO at concentration range below 10 ppm.
As it is evident in Figure 10, the order of activity depends on the reaction compound. In the cases of complete oxidation of propane and CO, the mono-component cobalt sample is the most active. These data are consistent with results in literature relating to the oxidation of these compounds in the presence of cobalt catalysts. It is widely accepted that the Co3+species on the surface of Co
3O4 are the reactive sites or centres for CO oxidation [7, 48].
As it was shown above, the only surface species on the Co-SBA-15 surface is Co3+.
can be noticed that the activity is decreasing with decrease in the Co3+ surface concentration
and it is lowest at 1Co2Mn-SBA-15 catalyst, in which the cobalt is present in the form of the surface Co2+. Quite similar is the situation in the case of propane oxidation: the most active
sample is the mono component cobalt catalyst and with increasing the manganese concentration in the samples, the catalytic activity drops down. The most active catalyst among the bi-component samples is the one having Co:Mn=1:0.5 molar ratio.
In the reaction of n-hexane oxidation, the catalyst displaying highest activity is the Co1Mn0.5-SBA-15 sample and the lowest activity is shown by the monocomponent Mn-SBA-15. The catalytic activity of the other two bi-component Co-Mn samples is a comparable with that of mono-component cobalt one. In our previous investigation concerning bi-component CoMn samples, supported on SiO2, we established that the n-hexane oxidation
reaction proceeds through Mars -van Krevelen mechanism [33]. According to this mechanism the VOCs are oxidized by the solid and the oxygen species introduced in the organic molecule come from the crystal lattice. Thus, the catalytic behavior can be correlated with the lattice oxygen mobility and with the corresponding the catalyst reducibility. It has been established that high concentration of surface oxygen species is important for achieving high activity in propane [49, 50] and toluene oxidation reactions over Co3O4 containing catalysts [8].
The mono component manganese catalyst exhibits the lowest activity in all the studied reactions. One possible explanation is that the manganese oxides are situated in the mesoporous channels, which very likely result in a less accessible active manganese sites in this sample.
According to the applied physicochemical methods after the reaction of n-hexane oxidation it was established that insignificant changes occur in the mesoporous structure and morphology, oxide particle size and oxide phases. Probably the mesoporous structure prevents the agglomeration of the oxide particles after the reaction. An increase in the average particle size about twice was registered when Co-Mn oxides are supported on SiO2 [17].
4. Conclusions
It was found that the modification of SBA-15 by ‘‘two-solvent’’ technique with Co, Mn or simultaneously with both cobalt and manganese does not change significantly the mesoporous structure, however its pores are partially blocked by the oxides, resulting in the decrease in the specific surface area and in the pore volume. In the case of mono component Co-SBA-15, the clusters of Co3O4 are on the surface and they are partially located inside the
pore system of SBA-15 while for Mn-SBA-15 sample, the oxide phases preferentially fill up the channels of SBA-15 forming nanowires. The mixed oxide nanowires are formed in the channels of CoMn-SBA-15 material along with small nanoparticles, aggregated outside of the channels.
The mesoporous structure and morphology of SBA-15, type of oxide phases and the size of the oxide particles remain almost unchanged after tests in reaction of complete n-hexane oxidation and this is valid for all studied samples. The observed resistance towards agglomeration can be attributed to the role of the mesoporous structure. On the other hand, after reaction the surface concentration of different cobalt and manganese species undergoes significant changes, except for the sample with equimolar Co:Mn ratio.
In the cases of complete oxidation of propane and CO, the mono-component cobalt sample is the most active due to the presence of only Co3+species on the surface. The sample
with Co:Mn molar ratio of 1:0.5 is most active in the n-hexane combustion. It exhibits the highest activity among the synthesized bi-component samples in all studied reactions which is
explained by the formation of finely divided oxides, highest reducibility and highest mobility of the surface and lattice oxygen.
Acknowledgment: The authors thank the Bulgarian Science Fund for financial support under Contracts DNTS/France/01/5 and Franco - Bulgarian project RILA 38651RJ.
References
[1] J. Spivey, in: G. C. Bond, G. Webb, Catalysis, 8 (1989) 157–203.
[2] M. Baldi, E. Finocchio, F. Milella, G. Busca, Appl. Catal. B: Environ., 16 (1998) 43–51.
[3] R. Craciun, B. Nentwick, K. Hadjiivanov, H. Knozinger, Appl. Catal. A: Gen., 243 (2003) 67–79.
[4] Y. F. Chang, J.G. McCarty, Catal. Today, 30 (1996) 163–170.
[5] L. F. Liotta, H. Wu, G. Pantaleo, A.M. Venezia, Catal. Sci. Technol. 3 (2013) 3085–3102.
[6] H. Huang, Y. Xu, Q. Feng, D.Y.C. Leung, Catal. Sci. Technol. 5 (2015) 2649– 2669.
[7] J. Carpentier, S. Siffert, J. F. Lamonier, H. Laversin, A. Aboukaïs; J. Por. Mat. 14 (2007) 103-110
[8] E. Genty, J. Brunet, C. Poupin, S. Casale, S. Capelle, P. Massiani, S. Siffert, and R. Cousin; Catalysts 5 (2015) 851-867
[9] L. F. Liotta; X. W. Xie, Y. Li, Z. Q. Liu, M. Haruta and W. J. Shen, Nature 458 (2009) 746–749.
[10] H. F. Wang, R. Kavanagh, Y. L. Guo, Y. Guo, G. Z. Lu and P. Hu, J. Catal. 296 (2012) 110–119.
[11] V. G. Milt, M. A. Ulla, E. A. Lombardo, J. Catal. 200 (2001) 241–249.
[12] A. Torncrona, M. Skoglundh, P. Thormählen, E. Fridell, E. Jobson, Appl. Catal. B: Environ. 14 (1997) 13–22.
[13] Á. Szegedi, M. Popova, A. Dimitrov, Z. Cherkezova-Zheleva, I. Mitov, Micropor Mesopor Mat, 136 (2010) 106-114.
[14] F. Wyrwalski, J.-F. Lamonier, S. Siffert, A. Aboukaïs, Appl. Catal. B: Environ. 70 (1–4) (2007) 393-399
[15] X. Zhang, J.Yea, J. Yuan, T. Cai, B. Xiao, Z. Liu, K. Zhao, L. Yang, D. He, Appl. Catal. A: Gen. 566 (2018) 104–112.
[16] M. Haidy C, R. Molina, S. Moreno, Appl. Catal. A: Gen 492 (2015) 48–59. [17] S. Todorova, H. Kolev, J. P. Holgado, G. Kadinov, Ch. Bonev, R. Pereñíguez, A.Caballero, Appl. Catal. B: Environ. 94 (2010) 46–54.
[18] Todorova, I.Yordanova, A. Naydenov, H. Kolev, Z. Cherkezova-Zheleva, K. Tenchev, B. Kunev, Rev. Roum. Chim. 59 (2014) 259–265.
[19] S. Sadjadi, M.M. Heravi, RSC. Adv. 7 (2017) 30815-30838.
[20] Z. Xiao-Dong, W. Yin, Y. Yi-Qiong, C. Dan, Acta Phys. - Chim. Sin. 31 (2015) 1633–1646.
[21] T. Tsoncheva, L. Ivanova, J. Rosenholm, M. Linden, Appl. Catal. B: Environ. 89 (2009) 365-374.
[22] T. Tsoncheva, J. Rosenholm, C.V. Teixeira, M. Dimitrov, M. Linden, C. Minchev, Micropor Mesopor Mat. 89 (2006) 209–218.
[23] T. Tsoncheva, G. Issa, T. Blasco, M. Dimitrov, M. Popova, S. Hernández, D. Kovacheva, G. Atanasova, J. M. López Nieto, Appl. Catal. A: Gen. 453 (2013) 1–12.
[24] R. Ivanova, I. Genova, D. Kovacheva, G. Atanasova, T. Tsoncheva; J. Por. Mat., 23 (2016) 1005–1013.
[25] A. Galarneau, M. Nader, F. Guenneau, F.A. Di Renzo, J. Phys. Chem. C 111 (2007) 8268–8277.
[26] M. Imperor-Clerc, D. Bazin, M-D Appay, P. Beaunier and A. Davidson, Chem. Mater. (2004) 16 (9) 1813–1821.
[27] S. Brunauer, P.H Emmet, E. Teller, J. Am. Chem. Soc. 60 (1938) 309–31. [28] E.P. Barrett, L.G. Joyner, P.P. Halenda, J. Am. Soc. 73 (1951) 373–380.
[29] M. Thommes, K. Kaneko, A. V. Neimark, J. P. Olivier, F. Rodriguez-Reinoso, J. Rouquerol, K. S. W. Sing, Pure Appl. Chem. 87(9-10) (2015) 1051–1069.
[30] S. Zhu, Z. Zhou, D. Zhang, H. Wang, Micropor. Mesopor. Mat. 95 (2006) 257– 264.
[31] Q. Q. Xu, G. Xu, J.Z. Yin, A. Q. Wang, Y. L. Ma, J. J. Gao, Ind. Eng. Chem. Res. 53 (2014) 10366-10371.
[32] Y. Belmoujahid, M. Bonne, Y. Scudeller, D. Schleich, Y. Grohens, B. Lebeau, Micropor Mesopor Mat 201 (2015) 124–133.
[33] S. Todorova, A. Naydenov, H. Kolev, J. P. Holgado, G. Ivanov; G. Kadinov, A. Caballero, Appl. Catal. A: Gen. 414 (2012) 43–51.
[34] I. D. Yordanova, S. Zh. Todorova, H. G. Kolev, Z. P. Cherkezova-Zheleva, Bul. Chem. Comm. 49 (2017) 99–104.
[35] J. Li , Xi Liang, S. Xu, J. Hao, Appl. Catal. B: Environ. 90 (2009) 307–312. [36] H. G. El-Shobaky, M.A. Shouman, A.A. Attia, Colloid. Surf. A: Physicochem. Eng. Aspects 274 (2006) 62–70.
[37] Q. Zhang, X. Liu, W.g Fan, Y. Wang, Appl. Catal. B: Environ. 102 (2011) 207– 214.
[38] R. M. Rojas, E. Vila, O.Garcia and J. L. Martin de Vidales, J. Mater. Chem. 4(10) (1994) 1635–1639.
[39] W. Tang, W. Li, D. Li, G. Liu, X. Wu, Y. Chen, Catal. Lett. 144 (2014) 1900– 1910.
[40] J.Y. Luo, M. Ming, L. Xiang, X.G. Li, Y.Q. Zha, T.D. Hu, Y.N. Xie, Z. Jing, J. Catal. 254 (2008) 310–324.
[41] G. Zhou, X. He, S. Liu, H. Xie, M. Fu J. Ind. Eng. Chem. 21 (2015) 932–941. [42] X. Zhang, J. Ye, J. Yuan, T. Cai, B. Xiao, Z. Liu, K. Zhao, L. Yang, D. He, Appl. Catal. A: Gen. 566 (2018) 104–112.
[43] X. Liu, Q. Liu, X.G. Huang, X.L. Nie, Z. Huang, J. Chin. Chem. Soc. 61 (2014) 490–494.
[44] W. Song, Al. S. Poyraz, Y. Meng, Z. Ren, S.-Y. Chen and S. L. Suib, Chem. Mater. 26 (2014) 4629−4639.
[45] M.R. Morales, B.P. Barbero, L.E. Cadús, Fuel 87 (2008) 1177–1186.
[47] J. Łojewska, A. Kołodziej, J. Żak, J. Stoch, Catal. Today 105 (2005) 655–661. [48] B. Faure and P. Alphonse, Appl. Catal. B: Environ. 180 (2016) 715–725.
[49] Q. Liu, L.-C. Wang, M. Chen, Y. Cao, H.-Y.He, K.-N.Fan, J. Catal. 263 (2009) 104–113.
[50] T. Garcia, S. Agouram, J.F. Sanchez-Royo, R. Murillo, A.M. Mastral, A. Aranda, I. Vazquez, A. Dejoz, B. Solsona, Appl. Catal. A: Gen. 386 (2010) 16–27.
Figure captions
Figure 1. SAXS patterns of the catalysts before (A) and after (B) reaction.
Figure 2. TEM images of (a, b) Co-SBA-15, (c, d) Mn-SBA-15 and (e, f) 1Co1Mn-SBA-15 catalysts before reaction
Figure 3. TEM images in darkfield mode of (a) Co-SBA-15 with EDX Co element mapping (b), (c) Mn-SBA-15 with EDX Mn element mapping (d) and (e) 1Co1Mn-SBA-15 with EDX Co (f) and Mn (g) element mappings before reaction.
Figure 4. Nitrogen adsorption-desorption isotherms of the catalysts before (A) and after n-he xane oxidation (B).
Figure 5. Mesope size distribution of the catalysts before (A) and after (B) after n-hexane oxidation.
Figure 6. Wide angles X-ray diffraction patterns of the catalysts before reaction (the triangles correspond to Co3O4 reflections, the squares to Pyrolusite (MnO2) and the stars to Bixbyite
(Mn2O3) reflections).
Figure 7. Electron diffraction pattern of 1Co1Mn-SBA-15 (a) and electron diffraction patterns of (b) Co3O4 (card n°03-065-3103) and (c) Mn3O4 from ICDD data base (card
n°00-024-0734).
Figure 8. TPR spectra of single- and bi-component catalysts. Figure 9. O2-TPD profiles of single- and bi-component catalysts.
Figure 10. Temperature dependence of A. CO oxidation; B. propane and combustion; C. n-hexane combustion.
Figure 1 1 2 3 Co-SBA-15
B
In
te
ns
it
y
(a
.u
)
q (nm
-1)
Mn-SBA-15 1Co2Mn-SBA-15 1Co1Mn-SBA-15 1Co0.5Mn-SBA-15 10.0 nm 5.8 nm 5.4 nm 10.0 nm 5.8 nm 5.0 nm 4.9 nm 9.9 nm 5.8 nm1
2
3
1Co0.5Mn-SBA-15 1Co2Mn-SBA-15 1Co1Mn-SBA-15 Mn-SBA-15 Co-SBA-15 10.0 nm 9.9 nm 9.9 nm 10.1 nm 5.8 nm 5.1 nm 10.0 nm 5.8 nm 4.9 nmIn
te
ns
it
y
(a
.u
)
q (nm
-1)
A
Relative pressure (p/p0) 5 10 15 20 25 0.00 0.04 0.08 Co-SBA-15 9.6 nm 7.7 nm 0.00 0.05 0.10 1Co0.5Mn-SBA-15 8.1 nm 7.2 nm 0.00 0.02 0.04 0.06 7.3 nm 9.0 nm 1Co1Mn-SBA-15 0.00 0.04 0.08 8.2 nm 7.0 nm 1Co2Mn-SBA-15 0.00 0.04 0.08 Mn-SBA-15 9.3 nm 7.1 nm d V /d D ( cm 3 /g -n m -1 ) Relative pressure (p/p0) 5 10 15 20 25 0.00 0.04 0.08 Co-SBA-15 7.2 nm 0.00 0.05 0.10 1Co0.5Mn-SBA-15 6.9 nm 0.00 0.02 0.04 0.06 6.9 nm 1Co1Mn-SBA-15 0.00 0.04 0.08 1Co2Mn-SBA-15 6.8 nm 0.00 0.04 0.08 Mn-SBA-15 7.4 nm 6.2 nm d V /d D ( cm 3 /g -n m -A B Figure 5.
Position [°2Theta] (Copper (Cu)) In te ns it y (a .u .) Mn-SBA-15 1Co2Mn-SBA-15 1Co1Mn-SBA-15 1Co0.5Mn-SBA-15 Co-SBA-15
A
20 30 40 50 Figure 6. Figure 7.0
100 200 300 400 500 600 700
Co-SBA-15 Mn-SBA-15 1Co2Mn-SBA-15 1Co0.5Mn-SBA-15 330 354H
2c
on
su
m
pt
io
n,
a
rb
. u
.
Temperature,
°
C
324 423 481 567 575 608 382 304 358 340 286 249 1Co1Mn-SBA-15 Figure 8 0 50 100 150 200 250 300 350 400 450 0 20 40 60 80 100 120 140 160 180 200 220 T3 T2 T1 300-425 Co-SBA15 Mn-SBA15 1Co0.5Mn-SBA15 1Co1Mn-SBA15 1Co2Mn-SBA15 O 2 , p pm Temperature, oC 200-300 50-170 Figure 9.A. 60 80 100 120 140 160 180 200 220 240 260 280 300 0 20 40 60 80 100 C O c on ve rs io n, % TemperatureoC Mn -SBA-15 Co-SBA-15 1Co1Mn-SBA-15 1Co2Mn-SBA-15 1Co0.5Mn-SBA-15 C. 220 240 260 280 300 320 340 360 380 400 0 20 40 60 80 100 Co-SBA-15 1Co1Mn-SBA-15 1Co0.5Mn-SBA-15 1Co2Mn-SBA-15 Mn-SBA-15 n -h ex an e co nv er si on , % Temperature, oC B. 200 220 240 260 280 300 320 340 360 380 400 0 20 40 60 80 100 Co-SBA-15 1Co0.5Mn-SBA-15 1Co1Mn-SBA-15 1Co2Mn-SBA-15 Mn-SBA-15 C3 H8 c on ve rs io n, % Temperature, o C Figure 10.
Table 1: EDX elemental Co and Mn composition (% atomic) of the Co-SBA-15, Mn-SBA-15 and 1Co1Mn-SBA-15 materials before (BR) and after n-hexane oxidation (AR)
Sample Co Mn Si Co-SBA-15 BR 7.35 ± 0.34 0 27.39 ± 0.60 Co-SBA-15 AR 6.89 ± 1.00 0 26.80 ± 1.08 Mn-SBA-15 BR 0 8.00 ± 0.44 26.86 ± 0.26 Mn-SBA-15 AR 0 8.20 ± 1.01 25.84 ± 0.81 1Co1Mn-SBA-15 BR 3.45 ± 0.20 4.13 ± 0.15 27.31 ± 0.42 1Co1Mn-SBA-15 AR 3.52 ± 0.16 4.17 ± 0.27 27.41 ± 0.38
Table 2.d-spacing values, specific surface area (SBET), pore volume (Vp) and pore diameter
(
∅
) of the catalysts before and after reaction (n-hexane oxidation)Sample d-spacing (nm) SBET (m²/g) Vp* (cm3 /g-STP) ∅** (nm) Co-SBA-15 After reaction Before reaction 10.1 10.0 439 389 0.52 0.44 7.2-9.6 7.2 1Co0.5Mn-SBA-15 Before reaction After reaction 10.0 10.0 416 426 0.49 0.45 7.2-8.1 6.9 1Co1Mn-SBA-15 Before reaction 9.9 366 0.44 7.3-9.0
After reaction 10.0 314 0.38 6.9
1Co2Mn-SBA-15 Before reaction After reaction 9.9 10.0 349 326 0.41 0.38 7.0-8.2 6.8 Mn-SBA-15 Before reaction After reaction 10.0 10.0 403 253 0.46 0.25 7.1-9.3 6.2-7.4
* Single point values
Table 3. Surface atomic concentrations (at. %) of Co2+, Co3+, Mn3+ and Mn4+ ions of the investigated sample surfaces before and after catalytic test (catalytic test is n-hexane complete oxidation).
before after before after before after before after before after
Mn3+ Mn4+ Mn3+ Mn4+ Co2+ Co3+ Co2+ Co3+ Co/Si Co/Si Mn/Si Mn/Si Co2p1/2/Mn2p Co-SBA-15 - - - - 0 1.22 0.26 1.10 0,032 0,035 - - 1Co0.5Mn-SBA-15 0.27 0.38 0.26 0.64 0.28 0.55 0.49 0.35 0,022 0,023 0,017 0,025 1.29 1.04 1Co1Mn-SBA-15 0.30 0.78 0.44 0.71 0.37 0.39 0.35 0.36 0,02 0,018 0,047 0,031 0.70 0.61 1Co2Mn-SBA-15 0.65 0.94 0.32 0.71 0.51 0 0.28 0.50 0,014 0,022 0,044 0,028 0.32 0.76 Mn-SBA-15 1.98 1.32 0.48 1.19 - - - - 0,09 0,046 - -