Publisher’s version / Version de l'éditeur:
Canadian Geotechnical Journal, 7, 3, pp. 297-312, 1970-08
READ THESE TERMS AND CONDITIONS CAREFULLY BEFORE USING THIS WEBSITE. https://nrc-publications.canada.ca/eng/copyright
Vous avez des questions? Nous pouvons vous aider. Pour communiquer directement avec un auteur, consultez la
première page de la revue dans laquelle son article a été publié afin de trouver ses coordonnées. Si vous n’arrivez pas à les repérer, communiquez avec nous à PublicationsArchive-ArchivesPublications@nrc-cnrc.gc.ca.
Questions? Contact the NRC Publications Archive team at
PublicationsArchive-ArchivesPublications@nrc-cnrc.gc.ca. If you wish to email the authors directly, please see the first page of the publication for their contact information.
NRC Publications Archive
Archives des publications du CNRC
This publication could be one of several versions: author’s original, accepted manuscript or the publisher’s version. / La version de cette publication peut être l’une des suivantes : la version prépublication de l’auteur, la version acceptée du manuscrit ou la version de l’éditeur.
Access and use of this website and the material on it are subject to the Terms and Conditions set forth at
On the yielding and mechanical strength of leda clays
Mitchell, R. J.
https://publications-cnrc.canada.ca/fra/droits
L’accès à ce site Web et l’utilisation de son contenu sont assujettis aux conditions présentées dans le site LISEZ CES CONDITIONS ATTENTIVEMENT AVANT D’UTILISER CE SITE WEB.
NRC Publications Record / Notice d'Archives des publications de CNRC:
https://nrc-publications.canada.ca/eng/view/object/?id=a22223d6-ddaa-4f9d-a793-f73d47fa9984 https://publications-cnrc.canada.ca/fra/voir/objet/?id=a22223d6-ddaa-4f9d-a793-f73d47fa9984
On the yielding and mechanical strength of Leda clays
R. J . MITCHELL
Department of Civil Engineering, Queen's University, Kingston, Ontario Received September 23, 1969
The pronounced yielding observed in laboratory tests on Leda clay has been associated with the destruction of cementation bonds in the clay. Triaxial test data presented in this paper show that a yield curve can be established for a Leda clay. The form of the yield curve deviates from that expected for an isotropic material and the pre-yield strains are shown to be different for vertically and horizontally orientated specimens.
The shear strength of the clay is dependent on the mean normal stress at failure. A portion of the failure envelope is different for specimens orientated in different directions and this 'strength anisotropy' is associated with anisotropic yielding.
Le fluage important observd lors des essais de laboratoire sur l'argile LCda a et6 reli6 B l a destruction des liens de cementation dans l'argile. Les resultats d'essais triaxiaux presentds ici montrent qu'une courbe de fluage peut Ctre ttablie pour l'argile Leda. La forme de cette courbe de fluage diffkre de celle qu'on anticiperait pour un materiau isotrope et l'on obtient des dtformations avant fluage differentes pour des Cchantillons B orientation verticale et horizontale. L a rdsistance au cisaillement de l'argile est fonction de la contrainte normale moyenne B l a rupture. Une partie de l'enveloppe de rupture est variable en fonction de l'orientation des dchantillons; cette anisotropie de rdsistance dtant relide B l'anisotropie de fluage.
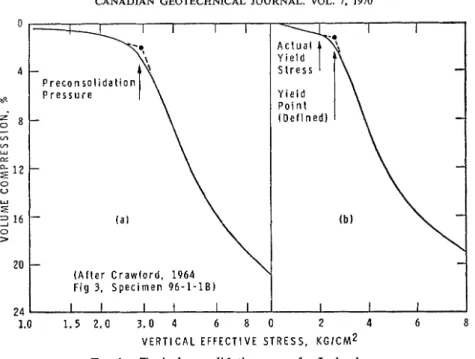
One-dimensional consolidation of naturally cemented clays such as the Leda clays of
Eastern Canada gives rise to a pressure - void ratio relation similar to that shown in Fig. l a . The very abrupt increase in compressibility and the inflection in the curve, apparent in the vicin- ity of the "preconsolidation pressure," is char- acteristic of Leda clay and has been associated (Jarrett 1967; Walker and Raymond 1968) with the rupture of cementation bonds. From the consolidation curve a preconsolidation pres- sure, PI, can be estimated (Fig. l a ) . The curve from Fig. l a is plotted on a linear stress scale in Fig. l b , and a yield point is defined for the clay material in the oedometer test. At stresses less than the yield stress, the specimen com- pression is small, mostly recoverable, and nearly a linear function of the applied stress. At stresses exceeding the yield point stress, the specimen compression is relatively large and mainly irrecoverable.
The oedometer test represents only one of an infinite number of stress paths that may be imposed on a soil specimen to cause consolida- tion. The amount of distortion accompanying volume compression will be a function of the stress-strain properties of the soil and the boundary conditions of the test. Yield points under other stress paths may be most easily
NRCC 11514
investigated using triaxial test apparatus. A
sufficient number of yield points may then de- fine a yield curve for the clay material. A knowledge of the various combinations of stress that will cause yielding in a body of clay (i.e. the yield curve) is essential in order to predict the occurrence of zones of plastic deformation when the clay is used to support a structure. Together with stress-strain data this information U may bc used, to various degrees of sophistica- tion, in predicting the excess pore water pres- sures and eventual settlements that will develop from point-to-point within the clay.
Although not explicitly stated, this work im- plies that clay behaves as an elastic-plastic continuum material. Detailed consideration of the plastic flow and the development of stress- strain relations are, however, beyond the scope of the present paper. Inherent in this general approach is the assumption that the initial yielding is not time dependent. The time lag associated with the hydrodynamic process of excess pore pressure dissipation is not of par- ticular concern because this process may be described bv conventional theoiies of consolida- tion. Time-dependent deformation of the soil skeleton is not, however, compatible with the conventional elastic-plastic approach. Consid- erable effort has been devoted to the studv of time-dependent consolidation in Leda clay (Crawford 1964; Jarrett 1967; Walker and
CANADIAN GEOTECHNICAL JOURNAL. VOL. 7. 1970 I
-
P r e c o n s o l i d a t i o n P r e s s u r e-
-
-
-
( A f t e r C r a w f o r d . 1 9 6 4 Fig 3, S p e c i m e n 9 6 - 1 - 1 8 ] I I I I I I 1 I IFIG. 1. Typical consolidation curve for Leda clay. Raymond 1968). The following conclusions of
immediate interest are drawn from these studies.
( 1 ) Major time effects occur only bithin a range of pressures in excess of the precon- solidation pressure.
( 2 ) Very slow constant rate of loading tests give rise to a void ratio
-
pressure curve essen- tially the same as the curve obtained from slow incremental loading tests.( 3 ) Volume compression in the region of the preconsolidation pressure is largely a secon- dary (or creep) phenomenon not associated with the dissipation of excess pore water pres- sures in laboratory specimens.
The first two conclusions suggest that a yield curve can be established, providing excess pore pressures are allowed to dissipate fully.
Secondary deformation rates, calculated on the basis of a linear relation between volume
data indicate that the structural time effects decrease in significance as the shearing stresses increase (i.e. the time delay for the breaking of cementation bonds is greatest in isotropic compression and least in pure shear).
Test Program
Fully drained triaxial tests were carried out on specimens (10 cm2 area) trimmed from 12.7 cm diameter Osterberg samples taken at the Canadian Forces Base Rockcliffe site in Ottawa. The tests were designed to provide information (as far as possible in triaxial com- pression tests) on the yield curve and the failure states of this clay in the stress region applicable to most civil engineering works. The results are presented in terms of the following effective stress and strain parameters.
[ I ] Mean normal stress, p = (al'
+
2u3')/3 change and the logarithm of time, have been[2] Deviatoric stress, q = (al' - agf) correlated between laboratory oedometer tests
and field consolidation (walker 1969). These [3] Volumetric strain increment,
correlations indicate that stress-strain data ob- 8v = 861
+
2863 tained from triaxial test specimens that havebeen allowed to undergo extended secondary [4] Distortional strain increment, deformation may be usefully extrapolated to
the analysis of long-term field deformations. 86 $'(a61 - 863) The test program described in this paper was Natural strains are used, and compressive carried out in view of these conclusions. Some stresses and strains are considered positive.
MITCHELL: YIELDING A N D MECHANICAL STRENGTH
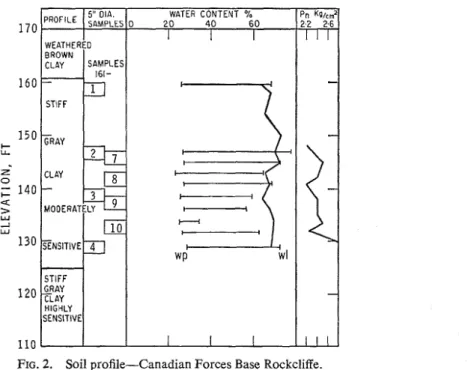
FIG. 2. Soil profile-Canadian Forces Base Rockcliffe. These parameters are reduced for the triaxial
boundary conditions from generalized functions of the invariants of the stress and strain incre- ment tensors. The reader is referred to Roscoe et al. ( 1958) and Roscoe and Burland ( 1968) for discussions concerned with the choice of fundamental stress and strain parameters.
Axial displacements and volume changes were measured during all phases of testing; strain parameters are calculated from these measurements by assuming a right circular cylindrical specimen shape. The total strains are calculated by simple summation of the natural strain increments.
All tests were carried out at constant tem- perature and under a back pressure in excess of 1.0 kg/cm2. Filter paper strips were used to facilitate drainage and the triaxial cells were equipped with rotating bushings to reduce pis- ton friction.
Load increment durations were well in excess of the time required for the complete dissipa- tion of measurable excess pore water pressures.
I Test specimens were trimmed horizontally and
vertically (a few also at 45') with respect to the in situ vertical and horizontal directions in order to investigate any manifestations of an- isotropy in the stress-strain behavior of the clay.
WEATHERED BROWN CLAY
A profile showing some of the geotechnical properties of the Leda clay at the Rockcliffe site is presented in Fig. 2. A complete listing of the triaxial tests with a description of the mode of failure is given in Table I. The spec- imen numbers given in Table I reference the specimen origin to Osterberg sample numbers shown on Fig. 2. The ground surface elevation is 170 ft (52 m ) . WATER CONTENT % 0 20 40 60 :;6n;ES SAMPLES
-
T h e o r e t i c a l S t r e s s P a t h F o l l o w e d i n C o n s t a n t R a t e o f L o a d i n g T e s t s - A c t u a l S t r e s s P a t h o f N E 1. 6 I n c r e m e n t a l L o a d i n g T e s t s U Pn K ~ I c ~ ~ ' 2 2 2.6 I I I 161-T
J
STIFF GRAY CLAY 7110
H SENSITIVE 4 WP C o n v e n t i o n a l C o n s t a n t C e l l STIFF CRAY CLAY HIGHLY SENSITIVE 0 . 4 . 8 1 . 2 1.6 2.0 2.4 p = (0; + 2 0 4 ) / 3 k g l c r n 2FIG. 3. Triaxial compressive stress paths.
I I I
-
CANADIAN GEOTECHNICAL JOURNAL. VOL. 7. 1970 TABLE I
Triaixial tests on Rockcliffe samples Constant 7 tests:
-- - - - - -
Orientation Vert Vert Vert Vert Vert Vert Horiz Horiz Horiz Horiz Horiz Horiz Depth, ft 23.8 23.8 23.8 23.8 24.0 24.0 30.9 24.0 30.9 30.9 30.9 24.5 Value of 7 0 0.23 0.41 0.73 0.58 0.95 0 0.23 0.41 0.58 0.73 0.95 Depth, m 7 . 3 7 . 3 7 . 3 7.3 7 . 3 7 . 3 9 . 4 7.3 9.4 9 . 4 9.4 7 . 5 Shear Tests: Number 161- Orientation Vert Vert Vert Vert Vert Vert Vert Vert Vert Horiz Horiz Horiz Horiz 45" 45" Vert Vert Vert Horiz Horiz Horiz Vert Vert Vert Vert Vert Vert Vert Depth Type ft of test 30.2 Const. p 30.2 Const. p 30.2 Const. p 30.2 Const. p 30.2 Const. p 31.9 C0nst.p 31.9 C0nst.p 31.9 C0nst.p 31.9 C0nst.p 24.0 C0nst.p 30.5 Const. p 30.5 Const. p 30.5 Const. p 31.2 Const. p 31.2 Const. p 38.0 C0nst.p 38.0 Const. p 38.0 - Const. p 24.0 u,'=const. 23.8 u,'=const. 23.8 u,'= const. 24.0
con con st.
38.0con con st.
32.5 Const. p 27.5 Const. p 32.5 Const. p 32.5 Const. p 27.5 Const. p Test parameter kg/cm2 p = o . 1 p = 0 . 4 p = 0 . 7 p = 1 . 0 p = 0 . 2 5 p=0.50 p=0.85 p = 1.4 p = 1 . 8 p = 1.4 p = 1 . 8 p=0.25 p=0.70 p=0.25 p=0.70 p=0.20 p=0.50. p=0.80 u,'=O. 6 u,'=l.O u,'= 1 . 6 u,'=1.o
uc'= 1.6 p = 0 . 2 p = 0 . 4 p = 0 . 8 p = 1 . 2 p = 2 . 2 Description of failure (shear anglefrom Horiz ) Remarks
Shear 55" Shear 40" Shear 53" Shear 53"
Shear 60°+ vert split Shear 54" Shear 45" and 48" Shear 47" Shear 49" Shear 45"+ bulging Excess bulging Shear 63" Shear 45" Shear 45" Shear 45" and 52" Shear 59" Shear 57" Shear 56" Bulging and tilting Bulging and tilting Bulging Bulging Bulging Shear 57" Shear 56" Shear 47" Shear 47" Shear 45" +bulging
I
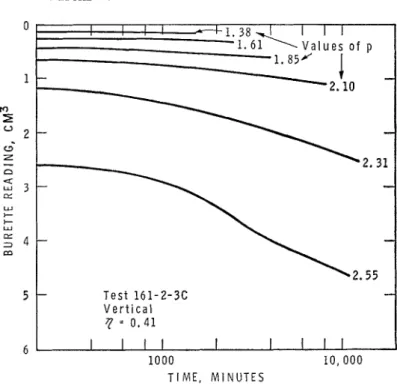
Incremental loading Constant rate of loadingYield Curve curves for a typical test are plotted in Fig. 4.
The yield curve was defined from triaxial From these curves it may be seen that incre- tests in which small incremental changes in both ment durations are extended into the the cell pressure and the axial load were simul- "cOndar~ phase of c o m ~ r e s s i o n ~ l These and taneously applied in such proportions that the data are plotted in Fig. show the ratio q / p was constant at the end of each load- between void ratio and mean
ing increment in a given test. These tests will stress for various constant 7) tests on both hor- be referred to as constant 7) tests, where izontal and vertical specimens. The incremental volumetric strain and the voids ratio are related
[51 7) = q / ~ by the equation
I
Incremental loading Constant ratethe ratio of the principal effective stresses is
also constant in a constant 7) test and is given by 8 v = - 8 e / ( l + e ) <
$
[61 ua'/ul' = ( 3 - 7 ) ) / ( 3
+
27)) 'The time required for full dissipation of excesspore water pressures was found to vary from 200 rnin
A typical 7) test path is in for early stress increments (p
<
1 kg/cmC) to 4000 Fig. 3 , and the time vs. volume compression min for later stress increments (p >, 2.5 kg/cm2).of loading Strain controlled Conventional
.
stress paths Large diam. + specimens (A = 40 cm2)MITCHELL: YIELDING AND MECHANICAL STRENGTH T e s t 1 6 1 - 2 - 3 C V e r t i c a l 7 = 0 . 4 1 6 I I I I 1 I I I 1
I
1000 1 0 , 0 0 0 T I M E , MINUTESFIG. 4. Typical time vs. volume change relations. where e is the current voids ratio of the
specimen.
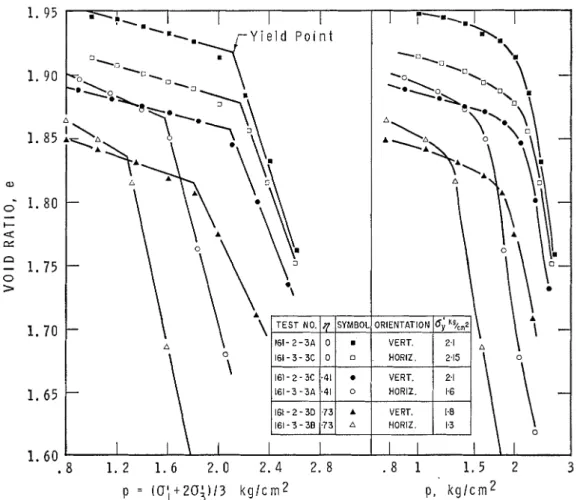
From each of the curves in Fig. 5a, the yield point is established as shown on the upper curve. Yield points for all the constant 7 tests
are plotted on the corresponding constant 7
path in the stress space of Fig. 6, and the yield curve is drawn through these yield points. Data from vertical and horizontal specimens are shown in opposing quadrants of Fig. 6. The yield curve drawn continuously between the quadrants represents yielding with respect to
in situ vertical and horizontal directions and indicates considerable anisotropy. Excepting the case of pure hydrostatic compression those combinations of stresses that are sufficient to cause yield are lesser in magnitude for horizon- tal specimens than for equivalent vertical specimens.
In addition to the constant 7 tests, several
conventional triaxial shear tests and constant p tests (axial load increments combined with a simultaneous small reduction in cell pressure such that the value of p is constant at the end of each loading increment in a given test) were carried out. A typical constant 1) stress path is drawn in Fig. 3. Stress-strain curves obtained
from the constant p tests are shown in Fig. 7 and yield points are obtained from the stress - volumetric strain curves. It is of interest to note that the stress
-
volumetric strain curves in Fig. 7 are very similar to the stress - distor- tional strain curves and that the yield points could reasonably be obtained from the latter curves. The deviatoric stresses at yield, as ob- tained from Fig. 7, are plotted on the appro- priate constant p path in Fig. 6. Yield points were obtained in a similar manner from con- ventional drained triaxial tests and these points are also plotted on Fig. 6. All these yield points lie close to the curve through the yield points obtained from the constant 7 tests and indicatea unique yield curve.
The yield points for specimens in conven- tional tests and constant p tests confirm the anisotropy of the yield curve. Such data can be represented with respect to the principal stress directions by plotting the shift in the yield curve which results from a specified rotation of the principal stresses (as shown for 90' rotation in Fig. 8 ) . This figure shows data from the triaxial test only (an1 = a3I). In a three dimensional stress space this clay will exhibit an anisotropic yield surface. Using data from
302 CANADIAN GEOTECHNICAL JOURNAL. VOL. 7, 1970 1. 95 161-2-3A 0 VERT. 2.1 A 161 - 3 - 3C 0 0 . HORIZ. 2.15 161-3 -3A .41 0 HORIZ. 1.6 161 - 2 - 3D .73 A VERT. 1.8 161-3- 38 .73 A HORIZ. 1.3
FIG. 5 . Void ratio vs. pressure relations for constant q tests.
plane strain tests and triaxial extension tests it would be possible to study the shape of these surfaces. From the data in Fig. 8 (or Fig. 6) it is possible to construct sections perpendicular to -the space diagonal) of the minimum yield surface for any given value of mean normal stress2 The minimum section for p = 1.8 is shown, along with a speculatively more realistic s h a ~ e . I ' in Fig. 9. "
General use of the parameter q implies isotropy (since ul' is defined as the maximum
principal stress independent of the specimen orientation). T o describe anisotropic yielding in a generalized form it is necessary to relate the principal axes of stress to the principal 'Stable yielding precludes a concave yield surface (Drucker 1964).
axes of anisotropy (Hill 1950). Such relations would be complex and of little use in the solu- tion of general soil mechanics problems. It is suggested, however, for the degree of anisotropy evident in the yielding of this clay that an approximate analysis incorporating this anisot- ropy in some empirical form would be more useful than a more sophisticated analysis assum-
ing isotropic yielding.
Mechanical Strength
The maximum deviatoric stress q, for the shear tests listed in Table I are plotted in Fig. 10. Failure envelopes formed by these points can be conveniently divided into three regions of mean normal stress, each region relating to a different mode of failure. These different modes of failure can be distinguished most
MITCHELL: YIELDING AND MECHANICAL STRENGTH
. RG. 6. Yield curves in triaxial compression.
0 I I I I I I I I
-
-
-
Y i e l d P o i n t s
t o L a r g e r S t r a i n s -
304 CANADIAN GEOTECHNICAL JOURNAL. VOL. 7, 1970
.
8 1. 6 2. 4 3. 2Oh =(S; k g l c m 2
FIG. 8. Effect of rotation of the principal stress directions on the yield curve.
readily by considering the stress-strain behavior of specimens in constant p tests. The constant p test path eliminates volume changes and associated distortions due to changes in mean normal pressure and allows the behavior under increases in deviatoric stress (q) to be observed directly.
Stress-strain data for several constant p tests in the low stress region are plotted in Fig. 11. These data show that the volumetric strain prior to and at failure is negative (dilation). Physical observation of the specimens after failure indicates that dilatant behavior is asso-
0 ' . k g / c m 2 m i n i m u m s e c t i o n
FIG. 9. A section of the anisotropic yield surface. ciated with a breaking up of the material into small nodules (ranging in dimensions from about 1 to 10 mm on a side and tending to prismatic shapes). The formation of these nodules is attributed to pre-existing planes of weakness in the specimens. The small nodules are quite sensitive and can be remoulded into a quasiliquid state. A detailed discussion of this behavior and its application to slope stability
6
. .
2 8 / S t r e s s l n t e r m e d i a t e ' R e g i o n S t r e s s R e g i o n * * : F a i l u r e P e a k S t r e n g t h D u e t o A t t r i b u t e d t o ' P l a n e s o f C e m e n t a t i o n W e a k n e s s B o n d s 2. 8 2 . 4 - 2 . 0 - H i g h S t r e s s R e g i o n W o r k H a r d e n i n g P l a s t i c F l o w1
I I I I I I V e r t i c a l S p e c i m e n.
H o r i z o n t a l S p e c i m e n s A 4 5 S p e c i m e n s-
L a r g e D i a m e t e r ( 4 0 c m 2 )/
S p e c i m e n s U n c o n f i n e d C o m p r e s s ~ o n /*-
. 4 . 8 1 . 2 1 . 6 2 . 0 2 . 4 2 . 8 p, k g l c m 2MITCHELL: YlELDlNG AND MECHANICAL STRENGTH
-
2-
1 0 1 2 0 1 2 3 4D I L A T I O N
V % C O M P R E S S I O N & 70FIG. 11. Stress-strain behavior in the low stress region. problems has been presented by Eden and
Mitchell ( 1969) and the following conclusions are drawn from tests on this fissured clay in the low stress region of Fig. 10.
( 1 ) The failure envelope is curved and rela- tively independent of specimen size or orienta- tion.
( 2 ) Failure is not affected by rates of testing ranging from 3 h to 1 week. (The general dilatancy allows fluid to enter the specimen on demand at failure.)
( 3 ) The failure envelope appears to be in- dependent of the stress path (for triaxial boundary conditions), providing that stress path lies wholly within the yield curve.
A post-peak decrease in shearing resistance of less than 10% was noted from several strain- controlled constant p tests sheared to a distor- tional strain of about 6 % .
Leda clay from six different locations in the Ottawa area were tested to failure in the low stress region (sample depths up to 20 m ) . The clay from all sites except Green's creek valley exhibited a low stress failure envelope and a nodular structure similar to that described above. The clay from Green's creek valley exhibited a typical brittle fracture when broken (no evidence of weak planes) and triaxial
-
rI
-
failure corresponded with the unconfined com- pression line (Fig. 10) up to a deviatoric stress of about 1.4 kg/cmg. For higher mean normal stresses (up to
p
= 1 kg/cm" the deviatoric stress at failure remained nearly constant at 1.4 kg/cm2. Samples that failed on the uncon- fined compression line showed evidence of vertical cracking at failure.When the mean normal stress at failure is greater than about 1 k g / c m V n the fissured clays dilation of the clay nodules is prevented and the mode of failure changes. Typical stress- strain curves in the intermediate stress range have been discussed earlier with reference to Fig. 7. Following yield, the stress-strain curves are relatively flat and a shear failure is obtained at a deviatoric stress somewhat in excess of that at which yield occurred. The failure envelope in this intermediate stress region (Fig. 10) is, like the yield curve, dependent on the specimen orientation. It has been postulated that yield corresponds to the initial breaking of cementa- tion bonds. It is suggested that failure in the intermediate stress range results from the con- tinued destruction of these bonds until a rupture plane forms.
In strain-controlled tests post-peak behavior indicates a gradual reduction of shearing resis-
v
30, SYMBOL VERTICAL: VI V2 V3 HORIZONTAL:-
H20,-
-
-
H I H2 p u,,,~ .25 .50 .85 TIME TO FAILURE IN HOURS 19 27 40 .25 .70 165 46CANADIAN GEOTECHNICAL JOURNAL. VOL. 7. 1970
1. 6
. 4 . 8 1 . 2 1.6 2 . 0 2.4 2 . 8 p, k g l c m 2
FIG. 12. Contours of equal strain from constant p tests.
-
-
H o r i z o n t a l-
-
S p e c i m e n s I 1 I I I Itance up to very large distortional strains. The post-peak volume compression apparently re- duces the specimen to a normally consolidated state. It was also noted that the peak in the stress-distortional strain curves from these tests was more pronounced in vertical specimens than in horizontal specimens. These observa- tions tend to suggest that the apparent strength anisotropy is related to the anisotropic yielding of the clay.
The intermediate stress region is associated with loading the soil to stress levels above the in situ stresses, as in the construction of earth embankments. Building foundation stresses should, however, be kept within the yield curve. Conventional drained tests carried out after isotropic or anisoptropic initial yield exhibit a work hardening type of plastic deformation and fail, by rupture or by excess bulging, in the high stress region on a line given by q/p = 0.85
(4' = 22'). Tests carried out on a conven- tional stress path in the high stress region undergo such large volumetric strains that bending normally occurs in the specimen. A constant p stress path in this stress region was found to give a more satisfactory failure con-
dition. Failure in the high stress region is of relatively little practical significance.
Stressatrain Data
A complete description of the stress - strain
-
time behavior of Leda clay is clearly beyond the scope of this paper. It is of interest, how- ever, to explore the possibility of establishing strain contours for the triaxial boundary con- ditions. The moduli of deformation obtained from vertical and horizontal specimens are seen to differ in Figs. 7 and 11 and the strains will be considered separately.Distortional strain contours from the con- stant 1) tests listed in Table I are shown super- imposed on the (q, p ) space in Fig. 12. These contours of equal distortional strain can be drawn with reasonable accuracy and are seen to form curved lines within the yield curves. The latter curves correspond, approximately, to the contour of 1.0% distortional strain. Both constant rate of loading tests (total duration about one day) and incremental loading tests (total duration about one week) are included in the data of Fig. 12. Strain contours, yield, and failure correspond for these quite different
MITCHELL: YlELDlNG AND MECHANlCAL STRENGTH
V O L U M E T R I C S T R A I N . V- 70 FIG. 13. Development of strains in constant q tests.
rates of testing indicating that time effects are not of major significance during shear in this stress region.
Incremental strains during each constant 7
test on the vertical specimens are summed to give the curves plotted in Fig. 13. These strains are calculated from an initial stress of y = 0.85 kg/cm2 (close to the in situ stress level) and the intercept of the curves along the ordinate axis in Fig. 13 corresponds to the distortional strain developed, for the associated 7, value, in
a constant p test at y = 0.85 kg/cm2. Reference of the strains to a stress close to the in situ stress has practical significance and also elim- inates errors that might arise in using a zero stress reference, i.e. excess free water from preparation, bedding errors, and compression of peripheral clay smeared in the trimming process.
Strains corresponding to the yield point are shown on Fig. 13 and it may be observed that the ratio of the total strains appears to be constant following yield. Prior to yield the strain ratios vary. It may be noted that the
strain ratio for 7 = 0.41 plots as a straight line
throughout; for values of above and below 0.41 the curves show opposing curvature. This value of 7 corresponds closely to the line of
symmetry through the horizontal-vertical yield curves in Fig. 6 and could possibly be indicative of the stress ratio under which the clay became bonded.
Constant 7 tests on horizontal specimens gave strain relations similar to those plotted in Fig. 13, except that the preyield strain ratio, av/dc,
was reducing for all 7 paths (i.e. the curvature prior to yielding was similar to that observed for 7
<
0.41 in Fig. 13).Strain corresponding to the yield point for the various stress paths are plotted in Fig. 14. They are all calculated from the reference stress point y = 0.85 kg/cm2. Although some ap- proximation is involved, it is apparent that the strains corresponding to the yield point are not significantly stress-path dependent. Direct com- parison of strain contours obtained from the various stress paths indicates that the strain contours in Fig. 12 may be unique in the region
308 CANADIAN GEOTECHNICP LL JOURNAL. VOL. 7, 1970 I 1 I I I * C o n s t a n t TI- T e s t s
-
C o n s t a n t p T e s t s-
A C o n v e n t i o n a l T e s t s-
*-
' - A-
*?\.a - a - * - I I I . .II --
-
-.
-
-
a-
-
I 1 I I I 2. 0PIG. 14. Strains corresponding to the yield point. . 4 . 8 1 . 2 1 . 6 2.0 2 . 4
of stress space enclosed by the yield curve. Any attempt to apply conventional elastic deforma- tion theories to stress fields within this stress region should, however, consider the cross- anisotropic behavior.
Microscopic observations have shown that undisturbed Leda Clay has a generally random particle orientation or isotropic fabric. (Quigley and Thompson 1966; Smart 1967). In view of these observations it would appear that the macroscopic manifestation of anisotropic strains is not related to particle orientation. The differences between the strains that develop in vertical and horizontal specimens could arise from cementation bonding that has a directional preference. Directional properties in the cemen- tation bonds may result from the unidirectional movement of ground water through the clay. A second possibility is that the apparent anisot- ropy may result because these clays are cemented in nature under an anisotropic ( K O )
V O L U M E T R I C S T R A I N v %
stress system. When a sample is removed from the ground, residual stresses may exist in the bonds and clay particles, owing to relief of the anisotropic stress system. These residual stresses could give rise to an apparent variance in the yield point with rotation of the principal stresses. This variance would be similar to the Bauschinger effect observed in metals (Hill 1950). This hypothesis suggests that the degree of apparent anisotropy depends on the in situ
K O
value (i.e. the overconsolidation ratio of the clay at the time of cementation). These, and other possibilities require further investiga- tion.Correlation of Drained and Undrained Triaxial Data
In addition to interpretation of the fully drained tests, the concept of a yield curve is useful in correlating the stress-strain behavior of drained and undrained tests. Data from con- ventional triaxial tests on specimens trimmed vertically from block samples of stiff gray Leda clay from a sewer tunnel shaft are used in these correlations. The sewer tunnel shaft site is 1.5 miles (2.4 km) east of the Rockcliffe site and has approximately the same ground surface elevation. A description of these block samples is given, together with some tabulated informa- tion on the triaxial tests, in Table 11. All tests were strain controlled at an average strain rate of about 0.2%/h. A back pressure of 0.5 kg/cm%as used and filter paper strips were employed to facilitate drainage of the pore fluid.
The data and correlations presented below are essentially similar to those presented and discussed by Conlon (1966) for Leda clay samples taken near the Toulnoustoc River (lower St. Lawrence Valley).
Stress-strain curves from two of the drained tests are plotted in Fig. 15a and the yield point is approximated for each test specimen. Yield points obtained for all the drained tests form a yield curve in the stress space of Fig. 150. The failure mode observed in each specimen is described in Table 11, and the failure points are shown in Fig. 15b. Behavior is similar to that of Leda clay from the Rockcliffe site. The form of the contours of equal distortional strain is shown by the two strain contours drawn on Fig. 150. The yield curve forms a contour at
MITCHELL: YIELDING A N D MECHANICAL STRENGTH 309 TABLE I1
Soil properties and tests on block samples Block
sample no.
U"
Depth Natural W , W,, Vane 111 situ P,, % s c.
meters m.c. % % kg/cm2 kg/cm2 kg/cm2 clay g/L St
. - Initial
effec. cell Description o f failure
Specimen Type o f pressure (Shear angle measured Post failure
number test a,' kg/cm2 from horiz.)
2
stress-strain94-25-14 CID* 0.05 Vert split, 77" plane, dilation 1.2 Large drop o f q
94-25-1 6 CID 0.5 Shear at 52', v pos, 6v negative 1.5 Small drop o f q
CID CID CID CID CID CID CIUt CIU CI
u
CIUShear at SO", vol corn; at failure Bulging
Bulging volume
Bulging compression at
Bulging failure
Bulging
I
Shear 67", pore water suction Shear 67", 611 positive, 6u/6 t neg.
Shear 62". 6u oositive. 6uI6eZ0 Shear 65". 1 ' Nearly constant q
I
Small linear increase o f q with strain Drop to qr/2 20% drop o f q 20 % drop o f q 1 9425-7 CIU 3.0 Shear 62" 9425-1 7 CIU 3.5 Shear 54" Not noted 9 4 1 8-2 CIU 4.0 Not noted 94-18-3 CIU 6.0 Not noted 9 4 1 8-6 CIU 8.0 9421-19 CIU 6.0 Bulging Gradually decreasing value o f q Less drop in q,
with jncrease In uC i . 5 611 positive 1.6 and increasing 1.3 at failure 1.9 1.8 2.0*CID = consol. isotropically, drained shear. tCJU = consol. isotropically, undrained shear.
9421-22 CIU 8.0 Shear 60" J 1.8
approximately 0.8% distortional strain. Fol- lowing yield the large volume compression is accompanied by large distortional strains and the triaxial specimens show considerable bulg- ing. The work hardening process (increase of shearing resistance with strain) was nearly terminated when excessive bulging was inter- preted as a failure condition.
Stress-strain relations for two of the un- drained tests listed in Table I1 are plotted in Fig. 16a. The excess pore water pressure curves show a distinct dependence on the initial cell pressure, but the deviatoric stress - distortional strain curves are quite similar. This behavior is more clearly represented with reference to Fig. 166, where the horizontal distance between the effective stress path of a specimen and the loading path (or total stress path) is a direct measure of the excess pore fluid pressure. The degree of curvature in the effective stress path at any given stress level is a measure of the yielding in the specimen (an elastic structural
response gives rise to a p = constant effective stress path for a saturated specimen). The points of maximum curvature for three of the paths plotted in Fig. 160 coincide closely with the initial yield envelope from Fig. 156. Test 94-25-17, carried out from an initial effective cell pressure of 3.5 kg/cm" closely follows this initial yield envelope for the early part of the test. Tests carried out in the very low stress region failed without significant yielding, and the tendency to dilate at failure is reflected in the pore water pressure measurements noted in Table 11. Effective stress paths for all specimens tested from an effective cell pressure within the yield curve tend toward the nearly horizontal part of the failure envelope. These specimens exhibit a pronounced peak shearing resistance, which is attributed to the destruction of cemen- tation bonds. The drop in shearing resistance after the peak becomes less significant as the failure line diverges further from the yield curve.
CANADIAN GEOTECHNICAL JOURNAL. VOL. 7. 1970 V O L U M E T R I C S T R A I N , V % 0 1 2 3 4 5 6 3 . 0 1 1 1 I I I I I
I
2. 5-
N E u 2 . 0 --
m Y-
a Y i e l d P o i n t s n S h e a r F a i l u r e 0 B u l g i n g F a i l u r e - 2 4 6 8 10 1 2 1 4 16 A X I A L S T R A I N , &I % * - - Y i e l d C u r v e + - F a i l u r e E n v e l o p e - n - D i s t o r t i o n a l S t r a i n C o n t o u r f o r E = n % 1 F a i l u r e o f S l o w U n c o n f i n e d C o m p r e s s i o n T e s t s 0 1 2 3 4 5 6 7 8 p = (6;+26:)13 k g l c r n 2FIG. 15. (a) Stress-strain curves from drained tests. ( 6 ) Yielding and failure in drained tests. Contours of equal distortional strain for the
undrained test specimens are plotted in Fig.
16b. The strain at failure for all specimens is noted in Table 11. Undrained strain contours in the normally consolidated region were found to form a 'fan' of straight lines extending back to the origin of coordinates (see contour for
E = 0.5% in Fig. 1 6 6 ) . This form of strain
contour has been reported previously by San- grey et al. ( 1 9 6 9 ) .
A comparison of the strain contours in Figs.
156 and 16b indicates that the distortion of drained and undrained specimens is closely similar in the region of stress space enclosed by the yield curve. In the drained tests the specimen suffers large volume compressions and
associated distortion as the stress path crosses the yield curve. Because no volume change occurs in the undrained specimen, the effective stress path tends to follow the yield curve, once attained, and the distortional strains are cor- respondingly less than those in a drained specimen.
The failure envelopes of Figs. 15b and 16b are almost identical. Any differences are con- sidered to arise from errors inherent in testing soil specimens, in particular the inability to measure excess pore water pressure in the failure zone of undrained tests.
Conclusions and Discussion
MITCHELL: YIELDING AND MECHANICAL STRENGTH E X C E S S P O R E WA.TER P R E S S U R E , u k g l c m 2 . 4 . 8 1 . 2 1 . 6 2 . 0 2 . 4 2. 5
1
I I I I II
-
S a m p l e N o . 9 5 - 2 5 - 7 0;=3.0 k g l c m 2 2.0C
--
S a m p l e N o . 9 5 - 2 5 - 1 1 O;=l.O k g l c m 2 U 1 2 3 4 5 6 7 D l S T O R T I O N A L S T R A I N , & % - - * - - F a i l u r e E n v e l o p e -n- D i s t o r t i o n a l S t r a i n C o n t o u r f o r 6 = n % - - - A p p r o x . Y i e l d C u r v e f r o m F i g 1 5 b I Q u i c k U n c o n f i n e d C o m p r e s s i o n T e s t sFIG. 16. ( a ) Stress-strain curves from undrained tests. ( b ) Yielding and failure in undrained tests. that a yield curve can be established for a Leda
clay and, as a consequence the behavior of this clay may be considered elasto-plastic. Unfor- tunately, the yield curve and strains are not the same for specimens oriented in different direc- tions during testing. This apparent anisotropy seriously limits the theoretical application of the test data. For most consolidation problems involving extensive vertical loading the yield point may be approximated by a constant value of mean normal stress independent of deviatoric stress. In problems where the boundary trac- tions give rise to relatively large deviatoric
stresses (general bearing capacity problems) consideration should be given to the apparent anisotropy of the yielding.
The mode of failure in compression tests is dependent on the mean-normal stress at failure. Three approximate stress regions are defined that divide the failure envelope according to these observations. Apparent anisotropy is ob- served, with respect to failure, only in the intermediate stress region where the peak shearing resistance is attributed to cementation bonds. It should be noted that previous reports of differences in strength between vertical and
312 CANADIAN GEOTECHNIC :AL JOURNAL. VOL. 7, 1970
horizontal specimens have resulted from un- drained tests and have been directly or in- directly related to preferred particle orientation in the clay soil (Lo 19658; Duncan and Seed 19660). The strength anisotropy reported in this paper results from drained tests carried out in a region of stress where cementation bonding is considered to govern the behavior of the clay (Townsend et al. 1969). Although some suggestions have been advanced the exact cause of this anisotropy has yet to be determined.
Acknowledgments
The author acknowledges with gratitude the capable and conscientious efforts of Mr. D. MacMillan and Mr. K. Timmins, Technical Officers, Division of Building Research, Na- tional Research Council of Canada, in the sampling, testing, and data analysis carried out in the preparation of this paper. Thanks are extended also to Mr. C. B. Crawford and Mr. L. W. Gold for helpful discussions during its preparation.
The paper is a contribution from the Division of Building Research, National Research Coun- cil of Canada, and is published with the ap- proval of the Director of the Division.
CONLON, R. J. 1966. Landslide on the Toulnustouc River, Quebec. Can. Geotech. J. 3, pp. 113-144. CRAWFORD, C. B. 1964. Interpretztion of the con-
solidation test. J. A n ~ e r . Soc. Civil Eng., Soil Mech. and Found. Div. 90, SM 5, pp. 87-102. DRUCKER, D. C. 1964. On the postulate of stability of
material in the mechanics of continua. J. Mtca- nique, 3, pp. 235-249.
DUNCAN, I. M. and SEED, H. B. 19660. Strength variations along failure surfaces in clay. J. Amer. Soc. Civil Eng. 92, SM6, pp. 21-50.
EDEN, W. J. and MITCHELL, R. J. 1969. The mechanics of landslides in Leda clay. Presented at 22nd Can. Soil Mech. Conf., Kingston, Ontario. HILL, R. 1950. The mathematical theory of plasticity.
Clarendon Press, Clarendon, England.
JARRETT, P. M. 1967. Time-dependent consolidation of a sensitive clay. Materials Research and Stan- dards, 7, pp. 300-304.
Lo, K. Y. 19656. Discussion to Int. Conf. Soil Mech. Found. Eng. Montreal, Quebec. 6th. 3, pp. 323- 325.
QUIGLEY, R. M. and THOMPSON, C. D. 1966. The fabric of anisotropically consolidated marine clay. Can. Geotech. J. 3, pp. 61-73.
I c o s c o ~ , K. H. and BURLAND, J. B. 1968. The generalized stress-strain behavior of 'wet' clay. Engineering Plasticity, Cambridge University I'ress, Cambridge, England.
ROSCOE, K. H., SCHOFIELD, A. N., and WROTH, C. P. 1958. On the yielding of soils. GCotechnique,
8, pp. 22-52.
SANGREY, D . A., HENKEL, D. J., and ESRIG, M. J. 1969. The effective stress response of a saturated clay soil to repeated loading. Can. Geotech. J.
6, pp. 241-252.
SMART, P. 1967. Soil structure, mechanical properties and electronmicroscopy. Ph.D. Thesis, Cambridge University, Cambridge, England.
TOWNSEND, D. L., SANGREY, D. A., and WALKER, L. K. 1969. The brittle behaviour of naturally cemented soils. Procs. Int. Conf. Soil Mech. Found. Eng., 7th, Mexico City. 1, pp. 411-417. WALKER, L. K. 1969. Secondary settlements in sensi- tive clays. Discussion, Can. Geotech. J. 6, p. 219. WALKER, L. K. and RAYMOND, G. P. 1968. The prediction of consolidation rates in a cemented clay. Can. Geotech. J. 5, pp. 192-216.