HAL Id: hal-00317949
https://hal.archives-ouvertes.fr/hal-00317949
Submitted on 23 Mar 2006
HAL is a multi-disciplinary open access
archive for the deposit and dissemination of
sci-entific research documents, whether they are
pub-lished or not. The documents may come from
teaching and research institutions in France or
abroad, or from public or private research centers.
L’archive ouverte pluridisciplinaire HAL, est
destinée au dépôt et à la diffusion de documents
scientifiques de niveau recherche, publiés ou non,
émanant des établissements d’enseignement et de
recherche français ou étrangers, des laboratoires
publics ou privés.
radiation in Southwestern Spain
A. Serrano, M. Antón, M. L. Cancillo, V. L. Mateos
To cite this version:
A. Serrano, M. Antón, M. L. Cancillo, V. L. Mateos. Daily and annual variations of erythemal
ultraviolet radiation in Southwestern Spain. Annales Geophysicae, European Geosciences Union,
2006, 24 (2), pp.427-441. �hal-00317949�
Daily and annual variations of erythemal ultraviolet radiation in
Southwestern Spain
A. Serrano, M. Ant´on, M. L. Cancillo, and V. L. Mateos
Departamento de F´ısica, Universidad de Extremadura, 06071 Badajoz, Spain
Received: 30 August 2005 – Revised: 27 December 2005 – Accepted: 10 January 2006 – Published: 23 March 2006
Abstract. The potential danger of ultraviolet (UV) radiation and its increasing levels at the Earth’s surface due to ozone depletion have demanded worldwide representative measurements of UV radiation. This study presents four and one-half years of original records of high temporal resolution ultraviolet erythemal radiation (UVER) measured
in Badajoz, Spain. Its principal aim is to statistically
characterize the UVER magnitude and temporal variations, but also to address the interesting special cases of cloud-free and cloudy skies. In particular, the study reports reliable values of fundamental statistical indices, which can serve as relevant values for comparison with other studies and model results. Moreover, the daily and annual evolution of the main central moments of the distribution function are analyzed and interpreted in terms of the forcing and attenuation sources.
The analysis focuses on two different temporal scales: hourly and daily values. Integrated hourly and daily data allow for the study of daily and annual variations of the
fundamental statistical indices. All of them exhibit high
symmetry with respect to solar noon and to certain dates near summer and winter solstices. The analysis shows the great influence of cloudiness in the distribution of UVER values. Thus, both daily and hourly UVER data present a slightly asymmetrical, left tailed, mesokurtic distribution for all months, except for summer, when the lack of clouds produces a leptokurtic distribution which is skewed to the left.
Keywords. Meteorology and atmospheric dynamics
(Radiative processes; Instruments and techniques)
Correspondence to: A. Serrano
(asp@unex.es)
1 Introduction
The study of solar ultraviolet (UV) radiation has received considerable attention during recent years, mainly because of its substantial increase at the Earth’s surface due to
ozone depletion. Although UV radiation represents a
small part of the solar spectrum, it notably affects many biological and photochemical processes, being quite harmful
to individual organisms. Thus, it has been reported that
long-term exposure of humans to UV radiation may be very detrimental, inducing skin cancer, cataracts and a dangerous weakening of immune functions (Diffey, 1991). In particular, the erythema is the most common effect of an intense overexposure to UV radiation.
Ultraviolet radiation, which composes 8.03% of the incoming solar radiation at the top of the atmosphere (Iqbal, 1983), is usually divided into three bands according to its biological effects: UV-C (100–280 nm), which is completely absorbed by the ozone and oxygen before reaching the Earth’s surface, UV-B (280–315 nm), which is partly absorbed by the ozone, and UV-A (315–400 nm), which is weakly absorbed by the ozone and therefore mostly arrives at the Earth’s surface. At ground level, although UVB contributes less than 10% to total UV irradiance, it is the most detrimental band. UVA radiation is also harmful, but the amount of energy required to produce the same effect as UVB radiation is one thousand times greater (Diffey, 1991). This effect is due to the high sensitivity of living organisms to radiation with a wavelength lower than 315 nm. In order to account for this selective skin responsiveness, an erythemal action spectrum has been defined, having its maximum weight at 297 nm. Thus, the erythemal effect of UVB radiation to the human skin is commonly calculated by weighing the solar UV radiation with the erythemal action spectrum, resulting in the so-called ultraviolet erythemal radiation (UVER). The curve, adopted in 1987 by the Commission Internationale de l’Eclairage (CIE) (McKinlay
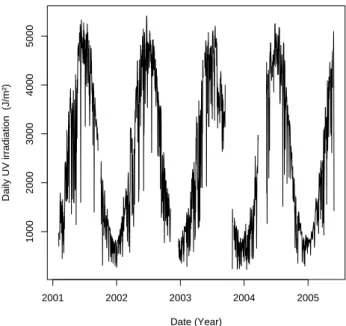
1000 2000 3000 4000 5000 Date (Year) Daily UV irradiation (J/m²) 2001 2002 2003 2004 2005
Fig. 1. Evolution of daily ultraviolet erythemal irradiation throughout the period of study.
and Diffey, 1987), is currently recommended as the standard erythemal action spectrum.
In Spain, analyses of solar UVA+UVB radiation at ground level have been performed in recent years (Mart´ınez-Lozano et al., 1996; Foyo-Moreno et al., 1998; Ca˜nada et al., 2000). Moreover, in 1999 the Spanish National Institute of Meteorology (INM) installed a network of 16 stations,
in order to measure UVER at surface level. In spite
of the widely accepted, high interest in monitoring this radiation, very few results have been published to date
(Mart´ınez-Lozano et al., 2002a,b). There is, therefore,
considerable interest in showing UVER experimental data for prolonged periods, and in obtaining significant values of maximum levels of UVER which could serve as reference data for comparison with values measured in other regions. These studies are of considerable interest in Southern Europe, and particularly in the Iberian Peninsula, due to the high sunshine duration recorded at these latitudes throughout the year. Furthermore, Spain, with its 45 million visitors per year, is one of the most important tourist centers of the world. Many visitors come for recreational purposes, especially during summer, when radiation reaches its highest values while many outdoor activities are carried out. All these facts support the importance of monitoring the UVER levels in this area.
Additionally, there is a need to validate the ultraviolet erythemal radiation predicted by radiative transfer models, using high quality experimental measurements.
The present article contributes to improving the
knowledge about actual UVER levels in Southwestern
Europe. It provides original measurements of UVER
−400 −200 0 200 400 Date (Year)
Anomaly of cloud−free monthly mean daily UV irradiation (J/m²) 2001 2002 2003 2004 2005
Fig. 2. Evolution of anomaly of cloud-free monthly mean daily
ultraviolet erythemal irradiation.
irradiation and, to our knowledge, is the first study which reports historical UV data for the Atlantic Iberian continental area. Moreover, our data encompasses one of the longest
periods for the Iberian Peninsula. The primary purpose
is to statistically characterize the UVER magnitude and fluctuations at Badajoz, Spain, and also to study the special cases of cloud-free and cloudy skies, which correspond to conditions commonly simulated by radiation transfer
models. These aims are addressed by obtaining reliable
fundamental statistical indices, such as the first four moments of the distribution function of UVER values, and by studying their daily and annual evolution. These statistics can serve as valuable references for comparison with values measured at other regions and also with model results.
2 Methods
2.1 Data
One-minute measurements of global solar and erythemal ultraviolet irradiance on a horizontal plane surface were collected at the campus of the University of Extremadura,
located in Badajoz, Spain, (38.99◦N, 7.01◦W, 199 m above
sea level). Badajoz, located in the west of the Iberian
Peninsula, is the biggest city in the region of Extremadura,
with 150 000 inhabitants. It is characterized by a high
number of cloudless days per year, which emphasizes the interest in monitoring solar radiation in this region.
The period of measurement extends from 1 February 2001 to 30 May 2005, which comprises nearly four and a one-half years. The data series have four gaps due to the participation of the UV radiometer in intercalibration campaigns.
1000 2000 3000 4000 5000 Month Daily UV irradiation (J/m²) J F M A M J J A S O N D
Fig. 3. Percentiles 0 (i.e. the minimum), 5, 25, 50 (i.e. the median),
75, 95, 100 (i.e. the maximum) of the distribution of daily UVER values for each calendar month.
Measurements were sampled every ten seconds and averaged every minute, in order to prevent outliers and thus obtain representative data. This means that more than two
million (2 220 267) original records were collected. The
high temporal resolution of the measurements allows for a suitable description of the fluctuations in the UVER caused by different sources. On the other hand, the relatively long period of measurements guarantees that a wide range of sky conditions and solar zenith angles have been included. As a result, highly reliable statistical indices of the distribution function of UVER values were obtained.
The measurement station at Badajoz consists of
a pyranometer CM-6B from Kipp & Zonen, for
measuring global solar irradiation, and a broadband
UV-erythemal radiometer (UV-S-E-T model) manufactured by Scintec-Kipp & Zonen, with a spectral response adapted to the erytema action spectrum of human skin. The measurements were recorded as one-minute mean
voltages on a Campbell CR10X data logger. The optic
filters, detector and electronic preamplifier of the UV-S-E-T
instrument are thermoelectrically stabilized at 25◦C. The
internal temperature is recorded every minute, to allow for
monitoring its stability. The constant internal conditions
avoid possible variations in the spectral sensitivity due
to changes in ambient temperatures. According to the
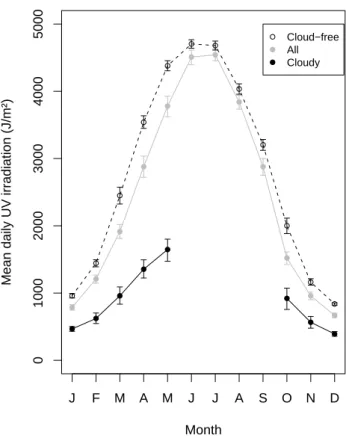
0 1000 2000 3000 4000 5000 Month
Mean daily UV irradiation (J/m²)
J F M A M J J A S O N D
Cloud−free All Cloudy
Fig. 4. Annual evolution of the mean of daily ultraviolet erythemal
irradiation.
manufacturer, the expected accuracy for daily sums is 5%.
The cosine response is ±4% from 0◦to 70◦zenith angle.
The UV broadband radiometer was calibrated at “El
Arenosillo” (Huelva, Spain) in 2001 and in 2003. An
improved second-order one-step method based on the one-step methods suggested by the WMO was used for its calibration. The reference instrument was a Brewer MK-III double monochromator spectrophotometer which belongs to the National Institute of Aerospace Technology (INTA). The reliability of the calibration of this instrument is highly
guaranteed. Besides the everyday tests performed with
the internal lamps, the spectrophotometer is periodically calibrated by comparison with a standard lamp, with calibration traceable to the National Institute of Standards and Technology (NIST). Moreover, it is also calibrated against a Brewer traveling standard every two years (Vilaplana, 2004). Additionally, the calibration campaigns of our UV-erythemal radiometer were carried out just after the II and III Iberian Intercomparison of Brewer Spectrophotometers (September 2001 and September 2003), where the INTA’s instrument was compared with the traveling standard (Brewer #017) from the International
Ozone Services (IOS, Canada). This traveling standard
instrument had been previously calibrated against the triad of Brewer spectrophotometers located at the Meteorological Service of Canada (international world reference of Brewer
0.0 0.2 0.4 0.6 0.8 1.0 Month
Ratio mean daily UVER to mean cloud−free daily UVER
J F M A M J J A S O N D
All Cloudy
Fig. 5. Ratio mean daily ultraviolet erythemal irradiation to mean
cloud-free daily ultraviolet erythemal irradiation.
instruments). A detailed description of the method and
procedure of calibration can be found in Cancillo et al. (2005). The calibration was found to be fairly stable, since using the different calibration coefficients obtained in the 2001 and 2003 campaigns resulted in differences lower than 5% in the UV values. In order to account for this small drift in the calibration coefficients, a linear correction based on the calibration change in the time period was applied to the data.
2.2 Analysis
By aggregating 1-min measurements, hourly mean irradiance
(in Wm−2) and daily accumulated irradiation (in Jm−2) were
calculated. These integrated hourly and daily values were computed only when more than 75% of the involved 1-min measurements were available. In order to avoid the effects of the radiometers cosine response, only measurements for a
solar zenith angle lower than 85◦were considered.
Since cloud-free and cloudy conditions are especially interesting cases for the comparison with model results, hourly and daily cases were classified into cloud-free, partially cloudy and totally cloudy. This classification was performed by means of widely accepted thresholds for the
clearness index (Kt). This index is defined as the ratio
between the global solar irradiance at the Earth’s surface and the global solar irradiance at the top of the atmosphere. The global solar irradiance at ground level was computed, similarly to the ultraviolet series, by aggregating 1-min
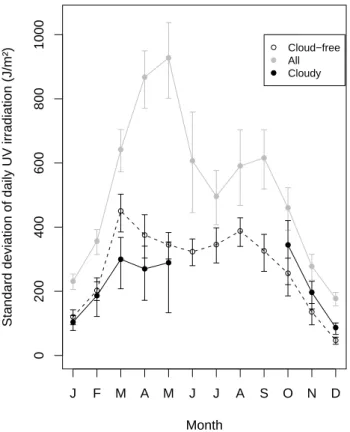
0 200 400 600 800 1000 Month
Standard deviation of daily UV irradiation (J/m²)
J F M A M J J A S O N D
Cloud−free All Cloudy
Fig. 6. Annual evolution of the standard deviation of daily ultraviolet erythemal irradiation.
global solar irradiance measurements. On the other hand, the extraterrestrial global solar irradiance was theoretically derived according to Iqbal (1983) and using Spencer’s expressions for the periodic variations in solar declination, solar orbit eccentricity and equation of time (Spencer, 1971).
Thus, cases with Kt>0.65 were classified as cloud-free,
and cases with Kt<0.34 as cloudy. These thresholds
are generally accepted to reflect cloudless and overcast conditions (Kudish et al., 1983; Elhadidy et al., 1990; Udo,
2000). Actually, cases with Kt>0.34 include overcast and
heavy partly cloudy conditions; these cases will be referred to as cloudy hereafter.
For both hourly and daily time scales, and for the three subsets of UVER measurements corresponding to the whole data set, and the special cases of cloud-free and cloudy conditions, the first four moments of the distribution were
calculated and analyzed. These four statistical indices
are the mean, standard deviation, skewness and kurtosis. They give substantial information about the central tendency, dispersion, asymmetry and degree of peakedness relative to the normal distribution, respectively. These statistics give a detailed characterization of the distribution. Moreover, these four statistical indices are of particular interest, since they are the parameters required to select a suitable probability distribution from the Pearson system, which contains the
−3 −2 −1 0 1 Month
Skewness of daily UV irradiation
J F M A M J J A S O N D
Cloud−free All Cloudy
Fig. 7. Annual evolution of the skewness of daily ultraviolet erythemal irradiation.
most commonly used distributions (Johnson et al., 1995). The selected distribution function could be used to generate realistic synthetic data or to assess the reliability of model results.
The fact that the distribution could be non-Gaussian induced us to also calculate some robust statistical
parameters based on ranks, such as some standard
percentiles, including the maximum and the minimum. The percentile p-th of a distribution of values is the number such that a percentage p of the population values is less than or equal to it. Thus, for example, the 25th percentile corresponds to the value of a variable such that 25% of the values of the variable fall below that value. The 50th percentile is the median.
The statistics were computed only when there were at least 10 data points. In addition, in order to assess the reliability of the statistical indices, the 95% confidence interval was calculated for each of the above-mentioned statistic applied to each series of data. The confidence interval was computed by means of a non-parametric bootstrap method. Bootstrap is a technique especially designed for the calculation of confidence intervals (Efron and Tibshirani, 1993). It has the great advantage of avoiding assumptions about the form of the underlying distribution and being particularly suitable when working with complex statistics. According to this
− 2 02468 1 0 Month
Kurtosis of daily UV irradiation
J F M A M J J A S O N D
Cloud−free All Cloudy
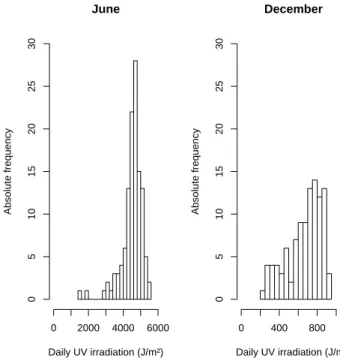
Fig. 8. Annual evolution of the kurtosis of daily ultraviolet erythemal irradiation. June Daily UV irradiation (J/m²) Absolute frequency 0 2000 4000 6000 0 5 10 15 20 25 30 December Daily UV irradiation (J/m²) Absolute frequency 0 400 800 0 5 10 15 20 25 30
Fig. 9. Histogram of daily UVER values for June and December.
technique, 10 000 replicates were built for the calculations. All of these fundamental statistical indices were calculated
p05 (Cloud−free) Month Hour UTC 8 1 01 21 41 6 M J S D p25 (Cloud−free) Month M J S D p50 (Cloud−free) Month M J S D p75 (Cloud−free) Month M J S D p95 (Cloud−free) Month M J S D p05 (All) Month Hour UTC 8 1 01 21 41 6 M J S D p25 (All) Month M J S D p50 (All) Month M J S D p75 (All) Month M J S D p95 (All) Month M J S D p05 (Cloudy) Month Hour UTC 8 1 01 21 41 6 M J S D p25 (Cloudy) Month M J S D p50 (Cloudy) Month M J S D p75 (Cloudy) Month M J S D p95 (Cloudy) Month M J S D
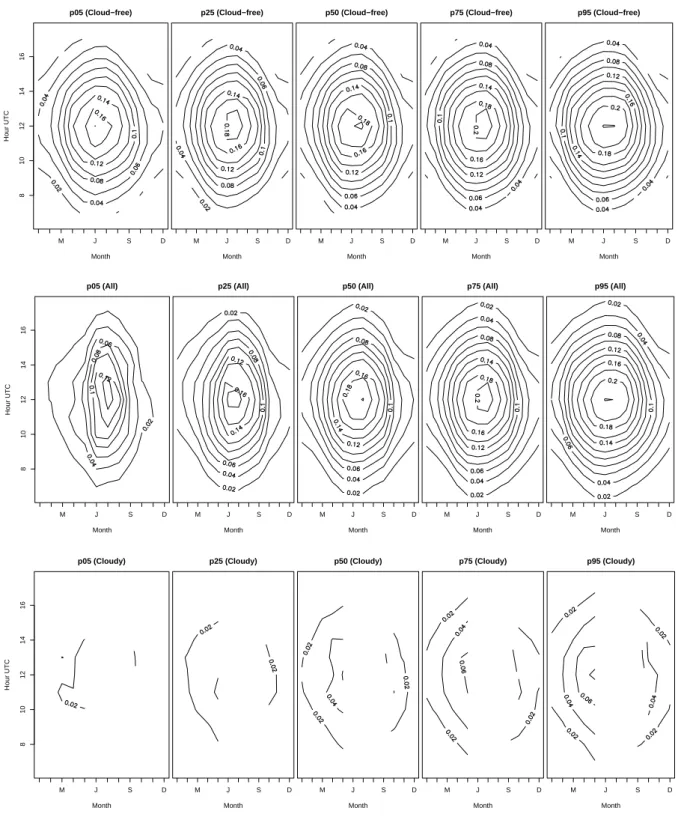
Fig. 10. Iso-irradiance lines of percentiles 5, 25, 50 (i.e. the median), 75 and 95 of hourly ultraviolet erythemal irradiance (in Wm−2) under cloud-free, all weather, and cloudy conditions.
for each month separately in the case of daily values, and for each hour of the day and each month separately in the
case of hourly values. Thus, the temporal evolution of
the distribution of values can be addressed. In order to
study the annual evolution of daily UVER, the distribution
of the values was analyzed for each month of the year separately. Similarly, the distribution of hourly data was analyzed separately, but this time for each hour of the day and for each month of the year. Thus, daily and annual variations can be analyzed in a combined way.
Mean (cloud−free) Month Hour UTC 8 1 01 21 41 6 J F M A M J J A S O N D Mean (all) Month Hour UTC 8 1 01 21 41 6 J F M A M J J A S O N D Mean (cloudy) Month Hour UTC 8 1 01 21 41 6 J F M A M J J A S O N D
95% confidence interval width (cloud−free)
Month Hour UTC 8 1 01 21 41 6 J F M A M J J A S O N D
95% confidence interval width (all)
Month Hour UTC 8 1 01 21 41 6 J F M A M J J A S O N D
95% confidence interval width (cloudy)
Month Hour UTC 8 1 01 21 41 6 J F M A M J J A S O N D
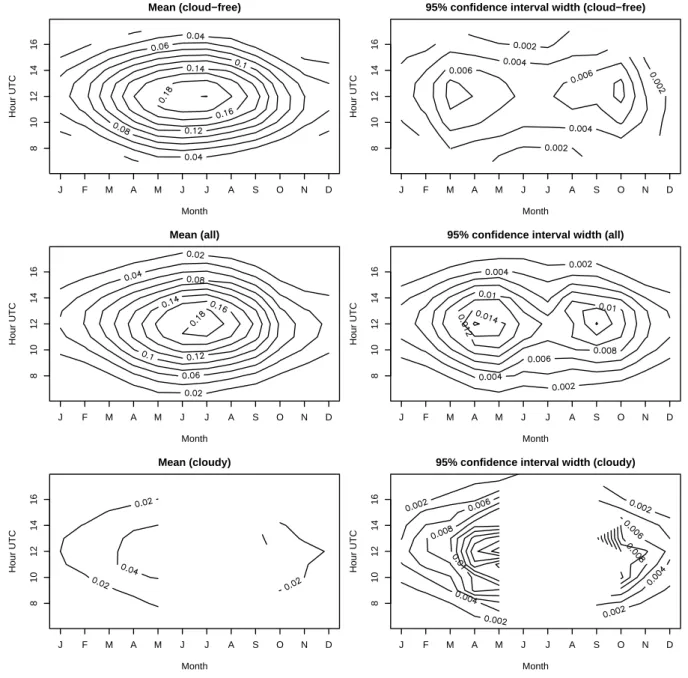
Fig. 11. Iso-irradiance lines of the mean of hourly ultraviolet erythemal irradiance (in Wm−2).
3 Results and discussion
3.1 Daily data
Firstly, daily data were analyzed. These accumulated values eliminate the dependence of the daily cycle on the solar zenith angle, allowing the study to focus on the annual variation of the UVER. The evolution of daily UVER throughout the period of study is shown in Fig. 1. The upper envelope curve followed a sinusoidal shape with minimum and maximum near the solstices and was controlled by variations in the solar declination and by the annual cycle of ozone content. Superimposed to this curve, sharp and short
intense attenuation events, due to cloudiness, can be clearly observed.
Maximum values for each year are 5329 Jm−2, which
occurred on 13 June 2001, 5412 Jm−2 on 21 June 2002,
5206 Jm−2 on 19 July 2003, and 5256 Jm−2 on 26 June
2004. Although the ultraviolet radiation presents large
fluctuations, mainly due to cloudiness, ozone and aerosols, the astronomical conditions are the main factors responsible for the annual variations of the UVER.
According to the thresholds previously mentioned, cloud-free and cloudy days were identified. Thus, 777 of the total 1523 days (the 51%) were classified as cloud-free and 190 (the 12%) as cloudy. The higher number of cloudless
Table 1. Statistical parameters of daily ultraviolet erythemal irradiation for each calendar month.
Month Number of data Mean (Jm−2) Maximum (Jm−2) Standard deviation (Jm−2) Skewness Kurtosis
Jan 124 787 1308 231 −0.39 −0.68 Feb 135 1209 1878 356 −0.48 −0.42 March 144 1915 3450 642 0.02 −0.51 April 118 2879 4496 868 −0.49 −0.76 May 137 3779 5095 928 −1.02 0.23 June 120 4510 5412 607 −2 6.17 July 122 4543 5250 496 −1.26 1.59 Aug 124 3840 4865 591 −1.25 3.24 Sep 90 2879 3997 616 −0.86 0.05 Oct 91 1520 2433 460 −0.37 −0.12 Nov 92 959 1467 278 −0.6 −0.11 Dec 104 668 932 177 −0.71 −0.56
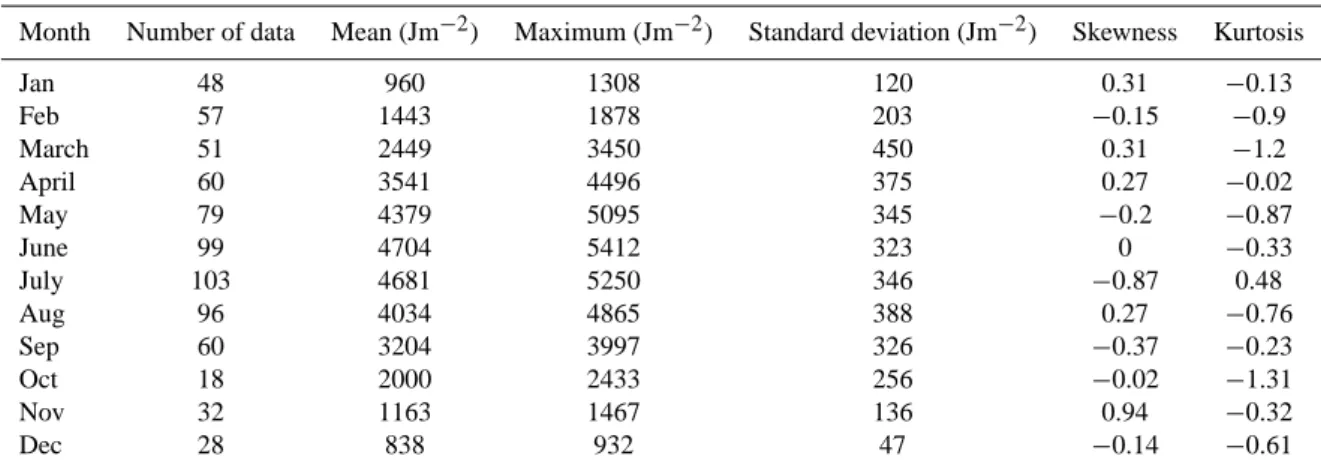
Table 2. Statistical parameters of daily ultraviolet erythemal irradiation for each calendar month for cloud-free conditions.
Month Number of data Mean (Jm−2) Maximum (Jm−2) Standard deviation (Jm−2) Skewness Kurtosis
Jan 48 960 1308 120 0.31 −0.13 Feb 57 1443 1878 203 −0.15 −0.9 March 51 2449 3450 450 0.31 −1.2 April 60 3541 4496 375 0.27 −0.02 May 79 4379 5095 345 −0.2 −0.87 June 99 4704 5412 323 0 −0.33 July 103 4681 5250 346 −0.87 0.48 Aug 96 4034 4865 388 0.27 −0.76 Sep 60 3204 3997 326 −0.37 −0.23 Oct 18 2000 2433 256 −0.02 −1.31 Nov 32 1163 1467 136 0.94 −0.32 Dec 28 838 932 47 −0.14 −0.61
days indicates the prevalence of fair weather conditions in this region.
The identification of cloud-free days allows to study the possible trends in the clear sky erythemal irradiance. The time series presented in Fig. 1 is mainly dominated by the annual variability in solar declination and cloud cover at the daily scale, making the detection of a possible meaningful
trend difficult. Therefore, cloud-free anomalies for each
month of the period of study were calculated as differences between cloud-free monthly mean daily irradiation and the values for the mean cloud-free year. The mean cloud-free year values were computed by averaging the cloud-free daily irradiation for each calendar month. The time series anomaly is shown in Fig. 2. Blank spaces correspond to months with a low number of data, which prevents meaningful calculation. No meaningful trend was found for the period of study by analyzing anomalies nor by comparing the cloud-free averages for any particular calendar month.
Figure 3 shows the percentiles 0 (i.e. the minimum), 5, 25, 50 (i.e. the median), 75, 95, and 100 (i.e. the maximum) of the distribution of daily UVER for each calendar month.
Maximum values followed a sinusoidal behavior driven mainly by astronomical factors and by the ozone annual cycle, and correspond to cloud-free days with also low attenuation by aerosols and ozone. On the contrary, low percentiles correspond to days with an intense attenuation by clouds. Beside the variation in solar declination, cloudiness is the attenuation factor responsible for most of the variability presented by UVER (McKenzie et al., 1991).
It can also be observed that the smoothness of the distribution increases as summer approaches, which is evident in the closeness of the upper percentile curves compared to the lower percentiles. This effect is mainly due to the lack of cloudy days during summer.
In order to achieve a detailed description of the UVER, the first four moments of the distribution for each calendar month were calculated. Table 1 shows the results for each month along with the number of cases and the maximum value. In addition, Tables 2 and 3 report the same statistical indices for the special interesting cases of cloud-free and cloudy conditions, respectively.
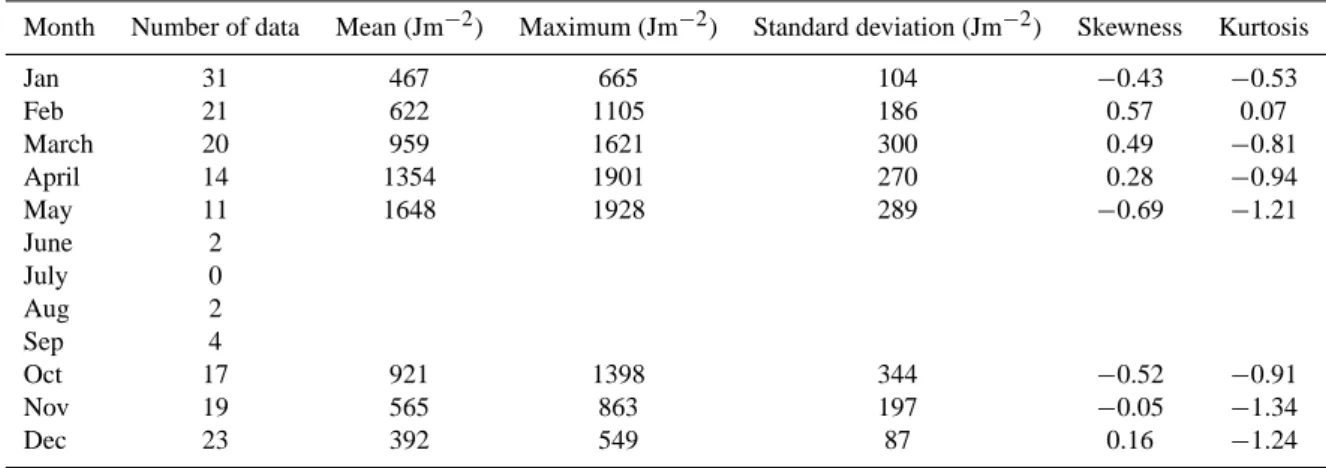
Table 3. Statistical parameters of daily ultraviolet erythemal irradiation for each calendar month for cloudy conditions.
Month Number of data Mean (Jm−2) Maximum (Jm−2) Standard deviation (Jm−2) Skewness Kurtosis
Jan 31 467 665 104 −0.43 −0.53 Feb 21 622 1105 186 0.57 0.07 March 20 959 1621 300 0.49 −0.81 April 14 1354 1901 270 0.28 −0.94 May 11 1648 1928 289 −0.69 −1.21 June 2 July 0 Aug 2 Sep 4 Oct 17 921 1398 344 −0.52 −0.91 Nov 19 565 863 197 −0.05 −1.34 Dec 23 392 549 87 0.16 −1.24
The mean is the most widely used measure of central tendency. Figure 4 shows the mean daily irradiation for the data set of all weather conditions and also for the subsets of cloud-free and cloudy days. The error bars correspond to the 95% confidence interval. The absence of computed statistics for certain months is due to an unreasonably low number of data which do not allow for meaningful calculations.
The sinusoidal shape followed by all curves is due to the lower solar zenith angles reached during the summer but also to the variation in day length throughout the year. The mean irradiance for the whole data set can be seen as an intermediate case between the two interesting extreme situations of cloud-free and cloudy. As Fig. 4 illustrates, the mean values for the whole data set is more similar to the cloud-free than to the cloudy mean, which reflects the high number of days with fair weather conditions along the year. This similarity is particularly evident during summer, when the number of cloudy days is even too low to obtain significant statistical indices.
In general, the confidence interval width is notably small, meaning that the estimated mean is highly significant. This fact is particularly true in the case of cloud-free days, indicating that the variability in attenuation due to ozone and aerosols is significantly lower than the fluctuation due to cloudiness.
In order to evaluate the irradiation depletion caused by cloudiness, the mean daily irradiation measured for
two different data sets: all days, and only those days
classified as cloudy, were compared with the cloud-free mean daily irradiation for the same month. The calculation was performed separately for each calendar month, in order to compare the measurements with the cloud-free measurements corresponding to the same zenith angle variation. Since the ozone content could not be the same for days within the same month, a careful scrutiny of the ozone load for the days covering the two data sets to be compared was performed. The ozone amount estimated by
Earth Probe TOMS was taken from the TOMS web site (http://toms.gsfc.nasa.gov). As expected, since clouds and stratospheric ozone are not dynamically related, the ozone loads for the data sets to be compared (all, cloudy and cloud-free days) showed similar distributions. Therefore, it can be said that the ratio between mean daily irradiation and mean cloud-free daily irradiation quantify the contribution of cloudiness to the UVER attenuation.
The results for both data sets: all days and only cloudy
days, are shown in Fig. 5. The absence of a computed
ratio for summer months indicates not enough cloudy
days for a meaningful calculation. The ratio cloudy to
cloud-free values indicates that, on average, daily irradiation in cloudy days is about 40–50% lower than in cloud-free days. The comparison between the all-days data set and the cloud-free-days data set gives a different information. These ratio values are influenced by the intensity of cloud attenuation and also by the frequency of cloudy conditions. Thus, it can be said that, in average, clouds cause about a 20% attenuation in daily irradiation, except during summer months, when the absence of clouds results in a cloud transmission close to one.
The dispersion of data is measured by the standard deviation. It is shown in Fig. 6 along with its error bars
for each calendar month. Higher values of this statistic
computed for all weather conditions occur during March, April, May and September. This fact is mainly due to the existence of a significant number of both types of days, cloudy and cloud-free in these months, and also to the faster day-to-day variation in the maximum solar zenith angle near the equinoxes. On the contrary, lower values can be found from November to February. There is also a relative minimum during June, July and August. This fact points out a high uniformity in the type of day during the summer months. The subsets of cloud-free and cloudy cases consist of days with similar sky conditions and, therefore, show lower dispersion than the complete data set (Fig. 6).
Table 4. Statistical parameters of hourly mean ultraviolet erythemal irradiation for June.
Hour Number of data Mean Maximum Standard deviation Skewness Kurtosis (10−3Wm−2) (10−3Wm−2) (10−3Wm−2) 5–6 120 2.4 2.9 0.3 −1.71 3.21 6–7 120 10.6 12.8 1.5 −1.45 1.9 7–8 120 29.7 36.2 4.6 −1.48 2.6 8–9 120 61.8 75.4 9.2 −1.58 3.34 9–10 120 104.6 128.6 14.9 −1.78 3.91 10–11 120 147.3 178.4 21.6 −1.91 4.59 11–12 120 177.2 214.1 29.9 −2.02 4.54 12–13 120 188.6 227.6 32.2 −2.03 4.57 13–14 120 178.5 214 27.8 −2.95 11.34 14–15 120 145.2 174.5 22.7 −2.6 8.75 15–16 120 100.6 123.2 15.7 −1.88 5.23 16–17 120 59.2 73.7 10.1 −2.16 6.71 17–18 120 28.2 36.1 5.6 −2.08 5.27 18–19 120 10.1 13.5 1.8 −1.4 3.43 19–20 120 2.3 2.9 0.3 −0.51 0.11
The third and fourth moments of the distribution, i.e.
skewness and kurtosis, were also analyzed. Skewness
gives information about the symmetry of the distribution of values, and kurtosis about its peakedness. The special cases of cloud-free and cloudy subsets showed values
not significantly different from zero. However, for the
all-weather conditions set, both statistical indices showed a different behavior during the summer months with respect to the rest of the year.
Figure 7 shows the annual evolution of skewness with its error bars. Taking into account the confidence interval, significant non-zero values are only found for the complete data set during summer. These negative values about −2 indicate an asymmetrical, left-tailed distribution.
On the other hand, the kurtosis for the whole data set is nearly zero, except for the summer months, when it reaches values higher than 5 (Fig. 8). This fact indicates the existence of a tall and narrow peak corresponding to cloudless conditions and a left tail with few cases of cloudy days. This narrow shape is smooth for non-summer months, when cloudy conditions become more frequent. Thus, the distribution changes from a mesokurtic shape during autumn, winter and spring, to a leptokurtic shape during summer. This behavior can be clearly observed in Fig. 9 when the distribution of daily UVER values for the months of June and December are compared.
3.2 Hourly data
Hourly irradiance highly depends on the solar zenith angle, which, for a given latitude, is a function of the time of day
and of the solar declination. The former varies during the day according to the Earth’s rotation and the latter remains almost constant during the day and varies along the year. In order to account for both geometric variations, the fundamental statistical indices of UVER hourly values were computed for each hour of the day and each month of the year. This procedure ensures that diurnal variations are unique to a particular month and are not affected by annual changes.
For the calculations, hourly irradiance values were classified into subsets corresponding to each hour and
each month. Then, the mentioned statistical indices
were calculated for each and every one of these subsets. Thus, for instance, the standard deviation for the hour 12:00–13:00 UTC and for the month of June was calculated over the sample consisting of the 12:00–13:00 UTC hourly irradiance values measured along all the days of June, along 4.5 years of data.
According to the mentioned thresholds for the clearness index, hourly cases corresponding to cloud-free and cloudy conditions were selected. Thus, 8095 of the total 17 108 hourly cases (the 47%) were classified as cloud-free, and 2987 (the 17%) as cloudy. The statistical indices were also calculated for these two particularly interesting subsets of hourly cases.
Analyzing the values for each hour and month, it was found that the minimum follows no daily nor annual cycles. This strange behavior is likely due to the high influence of cloudiness random fluctuations in the absolute minimum. Its high variability indicates that the calculated hourly minimum, even with more than four years of measurements, could be non representative. Therefore, in order to study
Standard deviation (cloud−free) Month Hour UTC 8 1 01 21 41 6 J F M A M J J A S O N D
Standard deviation (all)
Month Hour UTC 8 1 01 21 41 6 J F M A M J J A S O N D
Standard deviation (cloudy)
Month Hour UTC 8 1 01 21 41 6 J F M A M J J A S O N D
95% confidence interval width (cloud−free)
Month Hour UTC 8 1 01 21 41 6 J F M A M J J A S O N D
95% confidence interval width (all)
Month Hour UTC 8 1 01 21 41 6 J F M A M J J A S O N D
95% confidence interval width (cloudy)
Month Hour UTC 8 1 01 21 41 6 J F M A M J J A S O N D
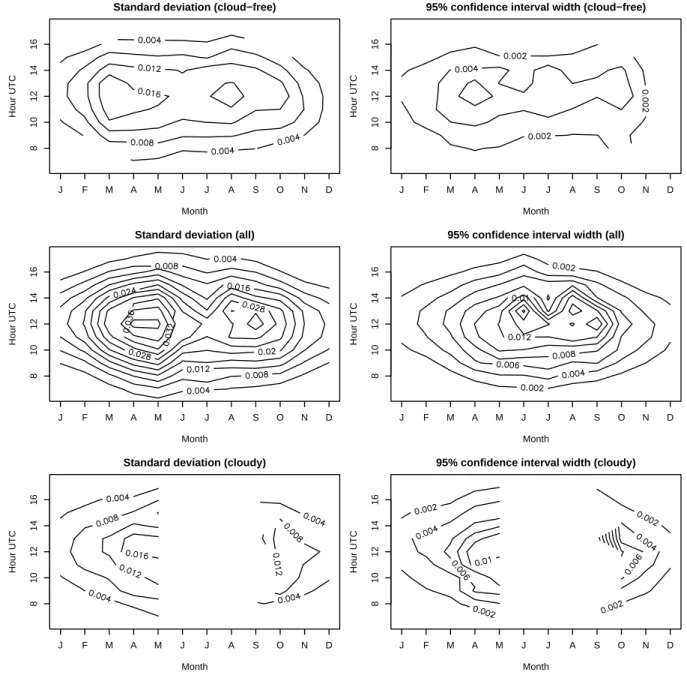
Fig. 12. Isolines of the standard deviation of hourly ultraviolet erythemal irradiance (in Wm−2).
the high variability of the low values of the distribution, the percentile 5 was preferred. It behaved much more regularly and showed a noticeably clear diurnal cycle.
By contrast, maximum values and percentile 95 show similar behavior. This low variability of maxima supports the significance of the estimation. In addition, maximum UVER values obtained in this work compare favorably with results reported for other locations in Spain (Mart´ınez-Lozano et al.,
1996; Foyo-Moreno et al., 1998). These facts confirm
that maximum values are suitably characterized. Obtaining reliable estimations of maximum irradiance is extremely interesting since they are directly related to harmful effects on human health.
Figure 10 allows the combined analysis of daily and annual variations of the distribution of hourly mean UVER irradiance. It represents, by means of iso-irradiance lines, several standard percentiles of the distribution of hourly mean irradiance under cloud-free, all weather, and cloudy conditions for each hour-month pair. As mentioned before, blank regions in the figures correspond to unavailable statistics due to a lack of data for calculation.
Two symmetries can be observed: with respect to
solar noon and to certain dates near the solstices. Both
symmetries result from the periodical behavior of incoming
extraterrestrial radiation and the ozone annual cycle. In
Skewness (cloud−free) Month Hour UTC 8 1 01 21 41 6 J F M A M J J A S O N D Skewness (all) Month Hour UTC 8 1 01 21 41 6 J F M A M J J A S O N D Skewness (cloudy) Month Hour UTC 8 1 01 21 41 6 J F M A M J J A S O N D
95% confidence interval width (cloud−free)
Month Hour UTC 8 1 01 21 41 6 J F M A M J J A S O N D
95% confidence interval width (all)
Month Hour UTC 8 1 01 21 41 6 J F M A M J J A S O N D
95% confidence interval width (cloudy)
Month Hour UTC 8 1 01 21 41 6 J F M A M J J A S O N D
Fig. 13. Isolines of the skewness of hourly ultraviolet erythemal irradiance.
of isolines elongates as lower percentiles are considered. Thus, the decreasing rate from the maximum along different months, when the hour remains unchanged, is remarkably higher for low percentiles than for higher ones. This behavior could be attributed to the irregular distribution of cloudiness throughout the year and, particularly to the almost absolute lack of clouds during summer. The higher gradient may be explained by the contribution of clouds in spring and autumn. Moreover, the absence of this pattern in cloud-free conditions (Fig. 10) confirms its relationship with cloudiness.
Regarding the results for cloudy conditions, it should be noted that, in spite of the strong attenuation by clouds, the effect of the solar zenith angle continues to be the dominant factor.
June is a month of particular interest since it is when maximum mean hourly values were registered and therefore, when overexposure to UV radiation can be more dangerous
for human health. Accordingly, Table 4 presents the
hourly evolution of fundamental statistical indices during this month. Most statistical indices followed a very regular diurnal evolution related to the daily cycle of the solar zenith angle. Similar behavior was found for the other calendar months.
Figure 11 presents the mean hourly UVER irradiance for cloud-free, all weather and cloudy conditions, and also the corresponding 95% confidence interval width. Taking into account this error, the values of the mean hourly UVER irradiance presented can be considered to be highly statistically significant.
Kurtosis (cloud−free) Month Hour UTC 8 1 01 21 41 6 J F M A M J J A S O N D Kurtosis (all) Month Hour UTC 8 1 01 21 41 6 J F M A M J J A S O N D Kurtosis (cloudy) Month Hour UTC 8 1 01 21 41 6 J F M A M J J A S O N D
95% confidence interval width (cloud−free)
Month Hour UTC 8 1 01 21 41 6 J F M A M J J A S O N D
95% confidence interval width (all)
Month Hour UTC 8 1 01 21 41 6 J F M A M J J A S O N D
95% confidence interval width (cloudy)
Month Hour UTC 8 1 01 21 41 6 J F M A M J J A S O N D
Fig. 14. Isolines of the kurtosis of hourly ultraviolet erythemal irradiance.
The behavior of the mean seems to be mainly controlled by the solar zenith angle for the three types of weather
conditions studied. However, the isoline map of the
confidence interval shows an interesting structure repeated in the standard deviation maps (Fig. 12). Then, it is interesting to note that, while for cloud-free days, the maxima in standard deviation occur in March and October, for the all-weather conditions data set a similar pattern is found but with a maxima in April and September. This disparity in the maxima location might be interpreted to some extent in terms of the different attenuation sources. Thus, for cloud-free days, the maximum standard deviation occurs in March and October, which coincides with the months characterized by
a high variation in ozone content, just one month before reaching the April maximum and the November minimum
(van Heuklon, 1979). These great fluctuations in ozone
content might be related to the maximum standard deviation in cloudless conditions.
On the other hand, for all weather conditions, maximum dispersion occurred in April and September, probably dominated by cloudiness evolution and related to a similar frequency of both extreme types of days: cloud-free and overcast.
Another statistical index of high interest is the skewness. It evaluates the asymmetry of a distribution. It was found to be neither significantly different from zero for cloud-free nor
for cloudy conditions (Fig. 13). However, for the all-weather conditions cases, in spite of the associated large error, statistically significant negative values can be found during June, July and August. This reveals a highly asymmetrical distribution with a heavy left tail during summer. This tail is likely to be due to some scarce low values attenuated mainly by clouds.
The fourth moment of the distribution, i.e. the kurtosis, reports information about the shape of the distribution of values as compared to the normal distribution shape. Figure 14 shows barely significant values during summer and nearly zero elsewhere. This leptokurtic behavior in summer is due to the combination of prevailing very clear conditions responsible for a narrow peak in the distribution, and some cloudy cases, responsible for the left heavy tail. During the rest of the months and for cloud-free and cloudy conditions, the values followed a mesokurtic distribution.
4 Conclusions
The study conducted here contributes to the understanding of the ultraviolet radiation and its attenuation sources by the detailed statistical characterization of the distribution of UVER values at Badajoz, Spain, using four and one
half years of original measurements. Specifically, this
study provides reliable experimental statistical indices of the distribution of ultraviolet UVER for all-weather skies, but also for the special interesting cases of cloud-free and cloudy conditions. These values allow for a meaningful comparison with measurements from other locations and with model results.
Concerning the temporal scale, the study showed the convenience of considering separately daily and hourly experimental data, in order to address different aspects and, thus, to better understand the temporal variations of ultraviolet erythemal radiation. Thus, in order to analyze the daily variation combined with the annual fluctuation, hourly UVER data were calculated and analyzed separately for each hour and each month. The use of isolines of UVER with respect to the hour of the day and to the calendar month was revealed as a suitable representation for the joint analysis of both temporal variations.
Beside astronomical factors, cloudiness appeared as a very
important attenuation factor at both temporal scales. It
affects not only the complex behavior of low percentiles, but also the symmetry and shape of the distribution. Both daily and hourly UVER distributions were found to be skewed to the left and leptokurtic during the summer months and slightly skewed to the left and mesokurtic during the rest of the year. This change in behavior could be attributed to the irregular distribution of cloudiness throughout the year, in particular, to the practical absence of clouds during summer. Thus, the spring and autumn months presented the highest dispersion, since these transition seasons show
great variability in sky conditions. Furthermore, changes in skewness and kurtosis can also be explained by the lack of clouds during summer, characterized by very uniform cloud-free conditions.
It is worth noting that, in spite of working with one of the longest records of UV radiation reported for Spain, there is still some uncertainty in the highest moments of the distribution, and further studies with longer periods of measurements could be of great interest.
In conclusion, the research findings have provided reliable experimental values that characterize the statistical distribution of ultraviolet radiation at Badajoz, Spain, and have offered some evidence about the influence of the attenuation factors, mainly cloudiness, in daily and annual variations.
Acknowledgements. The authors thank the National Institute of Aerospace Technology (INTA) for providing support in the calibration procedure. Thanks are also due to NASA for providing the ozone amount estimated by Earth Probe TOMS. This work has been partially granted by the Spanish “Ministerio de Educaci´on, Ciencia y Deporte” (AP2001-0845) and by the “Ministerio de Ciencia y Tecnolog´ıa” (REN2002-04558-C04-03/CLI CICYT).
Topical Editor F. D’Andr´ea thanks two referees for their help in evaluating this paper.
References
Cancillo, M. L., Serrano, A., Ant´on, M., Garc´ıa, J. A., Vilaplana, J. M., and de la Morena, B.: An improved outdoor calibration procedure for broadband ultraviolet radiometers, Photochem. Photobiol., 81, 860–865, 2005.
Ca˜nada, J., Pedr´os, G., L´opez, A., and Bosc´a, J.: Influences of the clearness index for the whole spectrum and of the relative optical air mass on UV solar irradiance for two locations in the Mediterranean area, Valencia and Cordoba, J. Geophys. Res., 105, D4, 4759–4766, 2000.
Diffey, B. L.: Solar ultraviolet radiation effects on biological systems, Phys. Med. Biol., 36, 3, 299–328, 1991.
Efron, B. and Tibshirani, R. J.: An Introduction to the Bootstrap, Chapman and Hall, 1993.
Elhadidy, M. A., Abdel-Nabi, D. Y., and Kruss, P. D.: Ultraviolet solar radiation at Dhahran, Saudi Arabia, Solar Energy, 44, 315–319, 1990.
Foyo-Moreno, I., Vida, J., and Alados-Arboledas, L.: Ground based ultraviolet (290–385 nm) and broadband solar radiation measurements in south-eastern Spain, Int. J. Climatol., 18, 12, 1389–1400, 1998.
Iqbal, M.: An Introduction to Solar Radiation, Academic Press, New York, 1983.
Johnson, N. L., Kotz, S., and Balakrishnan, N.: Continuous Univariate Distributions, Wiley Series in Probability and Statistics, 1995.
Kudish, A. I., Wolf, D., and Machalv, Y.: Solar radiation data for Beer Sheva, Israel, Solar Energy, 30, 1, 33–37, 1983.
Mart´ınez-Lozano, J. A., Tena, F., and Utrillas, M. P.: Measurement and analysis of ultraviolet solar radiation in Valencia, Spain, Int. J. Climatol., 16, 947–955, 1996.
Lorente, J., de Cabo, X., and Gonz´alez-Fr´ıas, C.: Experimental values of the UV index during 2000 at two locations in Mediterranean Spain., Int. J. Climatol., 22, 501–508, 2002a. Mart´ınez-Lozano, J. A., Mar´ın, M., Tena, F., Utrillas, M. P.,
S´anchez-Muniosguren, L., Gonz´alez, L., Cuevas, E., Redondas, A., Lorente, J., de Cabo, X., Cachorro, V., Vergaz, R., de Frutos, A., D´ıaz, J., Exp´osito, F., de la Morena, B., and Vilaplana, J. M.: UV index experimental values during the years 2000 and 2001 from the Spanish Broadband UVB Radiometric Network, Photochem. Photobiol., 76, 181–187, 2002b.
McKenzie, R. L., Matthews, W. A., and Johnston, P. V.: The relationship between erythemal UV and ozone derived from spectral irradiance measurements, Geophys. Res. Lett., 18, 2269–2272, 1991.
McKinlay, A. F. and Diffey, B. L.: A reference spectrum for ultraviolet induced erythema in human skin, CIE Journal, 6, 1,17–22, 1987.
Sun, Search, 2, 172, 1971.
Udo, S. O.: Sky conditions at Ilorin as characterized by clearness index and relative sunshine, Solar Energy, 69, 1, 45–53, 2000. van Heuklon, T. K.: Estimating atmospheric ozone for solar
radiation models, Solar Energy, 22, 63–68, 1979.
van Weele, M. T., Martin, J., Blumthaler, M., Brogniez, C., den Outer, P. N., Engelsen, O., Lenoble, J., Mayer, B., Pfister, G., Ruggaber, A., Walravens, B., Weihs, P., Gardiner, B. G., Gillotay, D., Haferl, D., Kylling, A., Seckmeyer, G., and Wauben, W. M. F.: From model intercomparison toward benchmark UV spectra for six real atmospheric cases, J. Geophys. Res., 105, D4, 4915–4925, 2000.
Vilaplana, J. M.: Medida y an´alisis de ozono y de la radiaci´on solar ultravioleta en El Arenosillo-INTA, (Huelva), PhD Thesis, Universidad de Valladolid, 2004.