HAL Id: hal-03047303
https://hal.archives-ouvertes.fr/hal-03047303
Submitted on 8 Dec 2020
HAL is a multi-disciplinary open access archive for the deposit and dissemination of sci-entific research documents, whether they are pub-lished or not. The documents may come from teaching and research institutions in France or abroad, or from public or private research centers.
L’archive ouverte pluridisciplinaire HAL, est destinée au dépôt et à la diffusion de documents scientifiques de niveau recherche, publiés ou non, émanant des établissements d’enseignement et de recherche français ou étrangers, des laboratoires publics ou privés.
Pathways for Precipitation in East China in Different
Stages of the East Asian Summer Monsoon
Yi Shi, Zhihong Jiang, Zhengyu Liu, Laurent Li
To cite this version:
Yi Shi, Zhihong Jiang, Zhengyu Liu, Laurent Li. A Lagrangian Analysis of Water Vapor Sources and Pathways for Precipitation in East China in Different Stages of the East Asian Summer Monsoon. Journal of Climate, American Meteorological Society, 2020, 33 (3), pp.977-992. �10.1175/JCLI-D-19-0089.1�. �hal-03047303�
A Lagrangian analysis of water vapor sources and pathways for
1precipitations in East China in different stages of the East Asian
2summer monsoon
34
YI SHI AND ZHIHONG JIANG
*5
Key Laboratory of Meteorological Disaster of Ministry of Education, Collaborative 6
Innovation Center on Forecast and Evaluation of Meteorological Disasters, Nanjing 7
University of Information Science & Technology, Nanjing, 210044, China 8
ZHENGYU LIU
9
Atmospheric Science Program, Department of Geography, The Ohio State University, 10
Columbus, Ohio, USA 11
LAURENT LI
12
Laboratoire de Météorologie Dynamique, CNRS, Sorbonne Université, Ecole Normale 13
Supérieure, Ecole Polytechnique, Paris, France 14
15
*Corresponding author address: Zhi-Hong Jiang, Key Laboratory of Meteorological Disaster 16
of Ministry of Education, Collaborative Innovation Center on Forecast and Evaluation of
17
Meteorological Disasters, Nanjing University of Information Science and Technology, 219
18
Ningliu Rd., Nanjing 210044, China.
19
Email: zhjiang@nuist.edu.cn
20 21
Abstract
22
The Hybrid Single-Particle Lagrangian Integrated Trajectory (HYSPLIT) platform is used to
23
simulate Lagrangian trajectories of air parcels in East China during the summer monsoon. The
24
investigation includes four distinct stages of the East Asian Summer Monsoon (EASM)
25
during its seasonal migration from south to north. Correspondingly, the main water vapor
26
channel migrates from the West Pacific Ocean (PO) for the pre-monsoon in South China (SC)
27
to the Indian Ocean (IO) for the monsoon in SC and in the Yangtze-Huaihe River Basin, and
28
finally back to PO for the terminal stage of monsoon in North China. Further calculations
29
permit to determine water vapor source regions and water vapor contribution to precipitations
30
in East China. To a large extent, moisture leading to precipitation doesn’t come from the
31
strongest water vapor pathways. For example, the proportions of trajectories from IO are
32
larger than 25% all the time, but moisture contributions to actual precipitations are smaller
33
than 10%. This can be explained by the large amount of water vapor lost in the pathways
34
across moisture-losing areas such as the Indian Peninsula and Indochina Peninsula. Local
35
water vapor recycling inside East China (EC) contributes significantly to regional
36
precipitations, with contributions mostly over 30%, although the trajectory proportions from
37
sub-regions in EC are all under 10%. This contribution rate can even exceed 55% for the
38
terminal stage of monsoon in North China. Such a result provides an important guidance to
39
understand the role of land surface conditions in modulating rainfall in North China.
40
Key words: Lagrangian trajectory, East Asian Summer Monsoon, Moisture transport pathways, 41
Moisture source
42 43
1. Introduction
44
Unlike tropical summer monsoons, such as the Indian monsoon or the West African
45
monsoon, the East Asian summer monsoon (EASM) is characterized by the presence of a
46
front between warm air masses from the south and cold air masses from the north (Wang,
47
2006; Chang, 2004). A rain belt is formed along the front. During the seasonal course in
48
summer, the rain belt marks a clear migration from south to north, making different rainy
49
periods in different regions in East China. It is well recognized that three major periods of
50
rainfall take place in South China, the Yangtze River basin and North China (Zhou and Yu,
51
2005; Ding et al., 2008; Shi et al., 2009; Sun et al., 2011; Zhu et al., 2011; Sun and Wang,
52
2015). The rain belt, whatever its geographic position during its migration course from south
53
to north, is always strongly related to moisture transport which is a necessary condition
54
leading to precipitation (Huang et al. 1998; Jiang et al., 2006; Sun et al., 2011). It is of great
55
significance to quantitatively determine the moisture source of the monsoon rainfall for its
56
different phases.
57
Early researches mainly used the Eulerian approach to analyze moisture transport
58
pathways. For the rainy period in South China, Lin et al. (2014) showed that southwesterly
59
water vapor transports carrying moisture from the Bay of Bengal, West Pacific and from the
60
southwest side of the Tibetan Plateau are major pathways. For the Meiyu rainy season in the
61
Yangtze River Valley, Jiang et al. (2009) showed thatwater vapor is mainly from the southern
62
Indian Ocean, the East African coast and the Arabian Sea. For rainfalls in North China, Xie
63
and Ren (2008) indicated that water vapor mainly comes from the Bay of Bengal, South
64
China Sea/west Pacific Ocean and the mid latitude westerlies. These researches mainly focus
on the moisture transport channels during EASM, and indicated the significant changes for
66
different stages of the summer monsoon.
67
However, the simple analysis of moisture transport with an Eulerian vision is unable to
68
assess moisture origins from remote regions. It generally ignores any moisture changes during
69
the transport, although some Eulerian variants with an online implementation of moisture
70
tagging technique in global or regional climate models were proved to be very useful to
71
understand water vapor sources (see Insua-Costa et al. 2018 and the relevant references there).
72
When such a water vapor tracer scheme was incorporated into the regional model WRF,
73
Dominguez et al. (2016) and Eiras-Barca et al. (2017) were able to investigate the origin of
74
moisture for the North American monsoon and for two events of atmospheric river landfall
75
causing catastrophic precipitations.
76
The most advanced methods that are widely used in recent years to determine moisture
77
origin are based on Lagrangian models (Stohl and James, 2004, 2005; Dominguez et al. 2006;
78
Dirmeyer et al. 2009), capable of calculating backward or forward trajectories of air parcels
79
residing over the target region. They can trace pathways of the moisture transport and changes
80
of physical quantities along the pathways. The Lagrangian methodology has been highly
81
valued in investigating global moisture transport and regional moisture recycling. We can cite
82
a few works to show the diversity of research topics that used the Lagrangian approach.
83
Firstly, at global scale, Gimeno et al. (2010) presented results on the moisture contribution for
84
each continent from the global ocean in different seasons. At regional scale, Brubaker et al.
85
(2001) and Diem and Brown (2006) calculated the moisture sources for precipitations in the
86
Mississippi River Basin and in South West America. Bertò et al. (2004), Perry et al. (2007),
Sodemann and Stohl (2009), Bottyán et al. (2014) demonstrated that water vapor for rainfalls
88
in South Europe come, for a large proportion, from the Mediterranean Sea.
89
In East China, there are also numerous studies using Lagrangian models. Drumond et al
90
(2011a) revealed the main moisture source in different regions in China. Sun and Wang (2014,
91
2015) detected the origins of moisture over East China and semiarid grassland. However,
92
different researches are still quite divergent. Chen et al. (2013) showed that moisture of
93
summer rainfall in the Yangtze-Huaihe River Basin is mainly from the South China Sea and
94
the Bay of Bengal. Drumond et al. (2011a) indicated that the moisture of East China is mainly
95
from the East China Sea, the moisture of South China is mainly from the Bay of Bengal and
96
the Arabian Sea. In recent works, Sun and Wang (2015) affirmed that the water vapor for
97
precipitations in the Yangtze-Huaihe River Basin and in North China is mainly from local
98
evaporation and from the West Pacific Ocean.
99
The divergence of results in the scientific literature has two major sources. First, the
100
target area in East China is different among different publications. There has been a lack of
101
systematic investigation for different regions and for the whole seasonal course when the East
102
Asian summer monsoon migrates from south to north. Second, since the calculations of
103
Lagrangian trajectories require heavy computation, many existing studies have been limited to
104
short periods, which may impact the stability and robustness of their results. It is thus
105
desirable to study different phases during the seasonal migration course of the rainfalls in East
106
China for a long time period.
107
In this article, based on the HYSPLIT platform of Lagrangian trajectories, we
108
systematically analyze the variation of water vapor transport in East China during different
phases of EASM. Our analysis covers the period from 1961 to 2010. Advanced diagnostics
110
are performed to assess moisture transport pathways, moisture sources and contributions to
111
precipitation in each phase of EASM.
112
The article is organized as follows: the data and analyzing methods are described in
113
Section 2. Section 3 presents main results on the water vapor sources and contributions from
114
different regions during the northward propagation of EASM. It furthermore quantifies the
115
proportion of trajectories and the contribution of water vapor to precipitations during the
116
seasonal course of EASM. Conclusions are drawn in the last Section.
117
2. Data and methods
118
2.1 Data 119
We used the reanalysis data taken from NOAA-National Centers for Environmental
120
Prediction (NCEP)/National Center for Atmospheric Research (NCAR). Global pressure-level
121
data were reprocessed into the HYSPLIT compatible format in the Air Resources Laboratory
122
(ARL), NOAA, U.S. They are available since 1948 at 6 hourly temporal resolution and 2.5°
123
(latitude/longitude grid) spatial resolution with 17 levels in the vertical. Data have been
124
downloaded from the ARL’s archives (http://ready.arl.noaa.gov/gbl_reanalysis.php).
125
2.2 Determination of the rainy season course in East China 126
The rainy season course in East China is directly taken from the National Climate
127
Bulletin published annually by the National Climate Center and the Central meteorological 128
observatory (http://cmdp.ncc-cma.net/cn/monitoring.htm#). As commonly practiced (Jiang et
129
al., 2006, Sun and Wang, 2014, 2015, Zhou and Yu, 2005 and Ding et al., 2008), the rainy
130
season course in East China is divided into three periods, and characterized by abundant
rainfalls in three geographical regions which are, from south to north, South China (SC), the
132
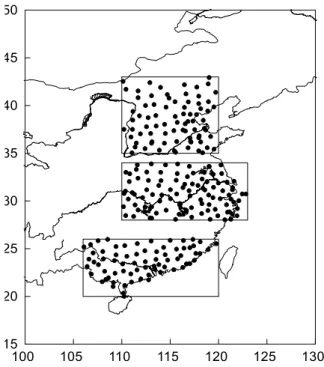
Yangtze-Huaihe River (YHR) basin and North China (NC). Data period covers from 1961 to
133
2010. The three areas are shown in Figure 1 with the following coordinates: 20°N–26°N,
134
106°E–120°E; 28°N–34°N, 110°E–123°E; 35°N–43°N, 110°E–120°E.
135
The situation in SC can be divided into two distinct sub-periods separated by the onset of
136
the South China Sea (SCS) summer monsoon which induces different characteristics of
137
atmospheric circulation in South China and associated water vapor transport (Shen et al.,
138
1982; Chen and Zhu et al., 1991; Lin et al., 2014). Before the onset of SCS summer monsoon,
139
the water vapor transport in South China is associated with westerly wind belt and South
140
China Sea sea-level pressure high. With the onset and strengthening of the SCS monsoon, the
141
cross-equatorial flow from the Southern Hemisphere intensifies and connects with the water
142
vapor channel from the Bay of Bengal. Regarding the onset date of SCS monsoon, we use that
143
defined by Wang et al. (2004), that is, the day when the 850 hPa zonal winds averaged over
144
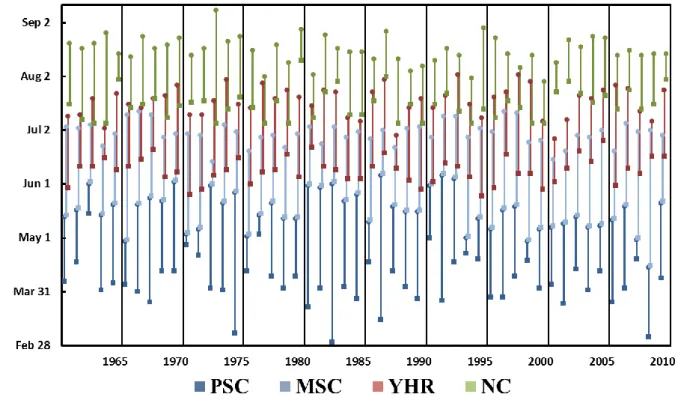
the central SCS (5°–15°N, 110°–120°E) shift from westerlies to easterlies. Figure 2 shows the
145
beginning and ending dates of the four periods characterizing the rainy season course of East
146
China from 1961 to 2010. The average start days of the four periods are Apr 6, May 17, Jun 8
147
and July 16. The average end days are May 16, Jun 1, July 17 and Aug 18. As shown in Fig. 2,
148
there is a large interannual variability for the timing and duration of these four sub-periods,
149
which obligates us to use precise beginning and end dates in our statistics of trajectories.
150
2.3 Methods 151
2.3.1 HYSPLIT water vapor tracking simulation
152
The National Oceanic and Atmospheric Administration (NOAA) Hybrid Single-Particle
Lagrangian Integrated Trajectory (HYSPLIT) model (Draxler and Hess, 1998; Draxler and
154
Rolph, 2011) is used in this paper for trajectories and tracks of air parcels. The back-trajectory
155
algorithm is applied to all stations inside the three target areas. From their initial position,
156
back-trajectories are calculated to cover all times between the beginning and the end of each
157
of the four sub-periods of the monsoon propagation course. We use six levels at 100, 500,
158
1500, 3000, 5000 and 9000 m as our initial height of particles release. They roughly
159
correspond to the near surface layer, levels at 925, 850, 700, 500 and 300 hPa respectively.
160
All parcels were integrated backward in time, until 10 days. Outputs were recorded every 6
161
hours with variables indicating the position (latitude, longitude, and altitude) and
162
meteorological conditions (temperature, specific humidity, and geopotential height) for
163
further analysis and diagnostics (Jiang et al. 2017). In particular, we averaged all trajectories
164
in each of the five main moisture source areas, which helps us to get actual moisture transport
165
pathways.
166
2.3.2 Evaporation-minus-Precipitation diagnosis method (E-P) to deduce source/sink regions
167
of water vapor
168
Water vapor in an air parcel changes when evaporation or precipitation takes place,
169
increasing with the former and decreasing with the latter. It is thus clear that a correct
170
determination of the source and sink characteristics of the water vapor transport has to take
171
into account processes of evaporation and precipitation following the trajectory. Stohl and
172
James (2004, 2005) proposed such a diagnostic method, commonly called
173
Evaporation-minus-Precipitation method to consider the change of moisture content with time
174
as the air parcel travels. The budget equation can be written as follows:
𝑒 − 𝑝 = 𝑚𝑑𝑞
𝑑𝑡 (1)
176
where e and p are the rates of evaporation and precipitation, respectively, q is the specific
177
humidity and m is the mass of the air parcel. For a given air parcel, when q decreases,
178
precipitation is larger than evaporation, and the parcel loses water vapor. When q increases,
179
evaporation is larger than precipitation, and the parcel gains water vapor. Summing the e−p of
180
all air parcels residing in the atmospheric column over an area A, the surface net water flux in
181
the area can be given by the following equation:
182
E − P ≈∑𝐾𝑘=1(e−p)
𝐴 (2)
183
where E and P are the total evaporation and precipitation in the column and K is the number
184
of particles over the area. Equation (2) can be regarded as a Lagrangian transformation of the
185
Eulerian atmospheric moisture budget equation:
186 E − P =𝜕𝑊𝜕𝑡 + ∇ ∙1𝑔∫ 𝑞𝑣⃗𝑑p0𝑃𝑠 (3) 187 where W =1 𝑔∫ 𝑞𝑑p 𝑃𝑠
0 is the vertically-integrated water vapor or precipitable water in the
188
column, g is the gravitational acceleration, 𝑣⃗ is wind. p is atmospheric pressure and Ps is
189
pressure at surface. The last term in Eq. 3 represents the divergence of vertically-integrated
190
water vapor flux. Stohl and James (2004, 2005) showed that when using a large enough
191
number of particles, the Lagrangian and Eularian methods give almost identical results. So,
192
the E-P results can be obtained, and the overall water vapor budget in a certain region can be
193
further determined. The case E-P>0 indicates that the area is source of water vapor to the
194
precipitation in target region, whereas when E-P < 0 the area is sink to the precipitation to the
195
target region. More details of this Evaporation-minus-Precipitation method can be found in
196
Stohl and James (2004, 2005) and Sodemann and Zubler (2010).
2.3.3 The improved areal source–receptor attribution method
198
The Evaporation-minus-Precipitation diagnosis can be used to determine the regional
199
source and sink characteristics of the water vapor, but it cannot quantify the composition of
200
actual contribution of various water vapor sources to the precipitation in the considered area.
201
For example, a region of high positive Evaporation-minus-Precipitation value can almost
202
certainly be considered as a moisture source region. However, the air parcels passing over this
203
region to a target region may not carry a large amount of moisture from this source region into
204
the target region. This issue of water vapor contribution from a source point to a target point
205
can be assessed if one performs a further simple (forward) operation on the identified
206
trajectories with a consideration of water vapor evolution (evaporation and precipitation)
207
along the trajectories. Sodemann et al. (2008) and Martius et al. (2013) reported interesting
208
results about moisture source attribution within this simple framework.
209
However, this attribution calculation is only valid from a source point to a target point. It
210
fails when one wants to evaluate an area for either the source or the target (or both). As a
211
remedy of this drawback, Sun and Wang (2014) introduced a method called the areal
212
source-receptor attribution to evaluate the contribution of a specific water vapor source region
213
to the precipitation in a target region. When the air parcel is between the source and target
214
regions, a normal operation is applied to calculate water vapor changes in function of
215
evaporation (precipitation) that increases (decreases) water vapor. The specificity of the areal
216
source-receptor attribution method is in its special treatments when the air parcel is in the
217
source and target regions. Details can be found in Step 5 of the algorithm which is
218
decomposed into seven steps and presented in Sun and Wang (2014).
In our study, we further improve the methodology with two new aspects. First, we take
220
into account the water vapor in the initial air parcels (when the back trajectories reach a level
221
below 50 m and cannot go further), while Sun and Wang (2014) put this initial water vapor
222
content at zero. This enhances the overall contribution rate of water vapor. Second, as also
223
suggested in Huang et al. (2018), we consider a gaining of water vapor when parcels flow
224
below the boundary layer top, where vertical mixing is dominant. Air parcels in this case are
225
considered gaining water vapor as from the ground, while an increase of specific humidity
226
above the boundary layer is mainly affected by a phase change of water vapor. In the latter
227
case, we cannot directly assign the region as a source region.
228
A third improvement that we implemented in the initial algorithm of Sun and Wang
229
(2014) is on the consideration of source region. The initial algorithm took into account only a
230
well-determined source/target duality. In our work here, we extend the source region to an
231
ensemble of unit surface areas of 1 by 1 latitude/longitude. This permits us to introduce the
232
concept of Contribution Density Function (CDF), while Sun and Wang (2014) could calculate
233
only the contribution proportion from source to target.
234
To summarize, we can now calculate, for each trajectory j departing from the grid i, the
235
quantity Rj(i) representing the moisture gained from the unit surface area i and then released
236
in the target region. Let Rtotal be the precipitation falling down in the target. It should be the
237
general sum of Rj(i), i.e. the total moisture release from all trajectories (Sodemann et al., 2008;
238
Sun and Wang, 2014, 2015; Chu et al., 2017). But it is actually a little larger than the general
239
sum, due to the lack of trajectory calculations at very high layers. The contribution of water
240
vapor from each unit area can be assessed with the Contribution Density Function (CDF),
defined and calculated as: 242 CDF(i) =∑ 𝑅𝑗(𝑖) n j=1 𝑅𝑡𝑜𝑡𝑎𝑙 (4) 243
where n is the number of trajectories departing from the area i. CDF behaving as a 2-D
244
probability density function can serve as a measure to evaluate the moisture contribution rate
245
of a unit area i to the precipitations falling into the target area.
246
With the improvement that we implemented, the global integration of CDF is
247
significantly increased, which indicates that we can more accurately identify water vapor
248
sources for the precipitation. For example, the global sum of CDF for North China monsoon
249
rainfall is about 0.8 with the original method (Sun and Wang, 2015), and about 0.9 with our
250
modifications.
251
3. Results
252
Based on the methodology described in Section 2.3, we simulated the backward
253
trajectory of parcels for EASM. From their initial positions shown in Figure 1,
254
back-trajectories are calculated to cover all times during the four sub-periods of monsoon
255
propagation in Figure 2 for 10 days.
256
3.1 Pre-monsoon in South China 257
For the pre-monsoon, rainfall mainly occurs in South China. Although it is before the
258
onset of the South China Sea (SCS) summer monsoon, rainfall is still considered as part of
259
EASM. We first analyze the moisture transport pathways (or channels) obtained as the mean
260
trajectory which is the average of all back-trajectories departing from our pre-defined
261
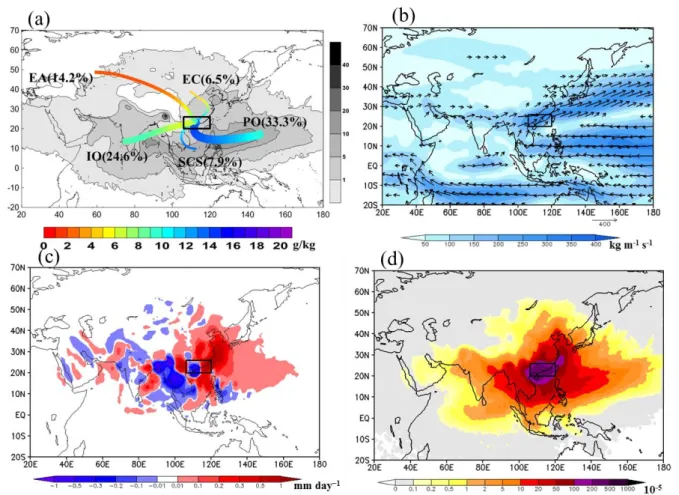
geographic sectors. Figure 3a shows the main water vapor transport pathways (or channels)
262
during the pre-monsoon in South China. The trajectories proportions are also shown in
relation to the channels. For the pre-monsoon in South China, the most important water vapor
264
transport channel is from the West Pacific Ocean accounting for 33.3% of all trajectories. Air
265
parcels come from the West Pacific Ocean, move northwestwardacross the Philippines, and
266
finally enter the target area at the south boundaries. The average specific humidity of air
267
parcels increases from 10 to 14 g/kg, which indicates that a significant portion of moisture is
268
absorbed along the trajectories. The secondary moisture transport channel is from the Indian
269
Ocean, which accounts for 24.6% of all trajectories. The average trajectories move across the
270
Bay of Bengal, Indochina Peninsula and then move into South China. Contrary to the West
271
Pacific channel, the average specific humidity of air parcels from the Indian Ocean decreases
272
from 12 to 8 g/kg, which indicates a great deal of water vapor loss. 14.2% of the trajectories
273
are from the Westerlies in the north, and their average specific humidity is small, increasing
274
from 2 to 7 g/kg. Besides, the proportion of local trajectories is 6.5% and the South China Sea
275
channel accounts for about 7.9% and the average specific humidity is 14 g/kg, the largest
276
among all the channels. These results are consistent with our general expectation, and in
277
agreement with Chen and Luo (2018) who also concluded that the main water vapor transport
278
channel duringpre-monsoon period in South China is from the Pacific Ocean. Nevertheless,
279
the trajectory proportion obtained from our research is a bit higher for the Pacific Ocean and
280
lower for the South China Sea.
281
The vertically-integrated water vapor transports within the Eulerian framework are
282
shown in Figure 3b. The pre-monsoon in South China is mainly influenced by the West
283
Pacific moisture transport channel. The circulation from southeast over the West Pacific
284
carries abundant water vapor into the Indochina Peninsula and then affects South China.
Compared to the water vapor channel from the West Pacific Ocean, the one from the Indian
286
Ocean is relatively weak, but it also plays an important role for the pre-monsoon in South
287
China. These results are consistent with the existing literature for this regard. For example,
288
Chi et al. (2005) and Lin et al. (2014) showed already that before the onset of SCS summer
289
monsoon, the subtropical high dominates the South China Sea and moisture reaching South
290
China mainly comes from west winds over the Arabian Sea, east winds at the southwest flank
291
of the Western Pacific Subtropical High and southwest winds over the Bay of Bengal.
292
However, the transport pathways cannot give precise moisture source/sink characteristics.
293
Based on the evaporation-minus-precipitation diagnosis, Figure 3c shows the spatial
294
distribution of average E-P from 1 to 10 days before air parcels reaching South China. It
295
clearly reveals that the West Pacific is the most important moisture source region for the
296
pre-monsoon in South China, and the maximum value is located in offshore areas of East
297
China. East China and the South China Sea are also important moisture source regions.
298
Moisture sink region for the precipitation in South China is mainly in the Indochina Peninsula,
299
which indicates great moisture loss from the Indian Ocean.
300
The spatial distribution of moisture contribution leading to precipitations of
301
pre-monsoon in South China (water vapor CDF) is shown in Figure 3d, obtained from the
302
improved areal source–receptor attribution calculation. Large contribution density values are
303
mainly located near the coasts of Southeast China, and the adjacent seas, with an average
304
contribution density about 2x10⁻³. In the West Pacific Ocean, the CDF of 1.0x10⁻⁵ extends to
305
170°E, and that of 1.0x10⁻⁴ extends to 150°E. However, CDF in the Indian Ocean monsoon
306
region is relatively small, only the Bay of Bangel, the Indian subcontinent and the Indochina
Peninsula show CDF values larger than 1.0x10⁻⁵.
308
In summary, for the pre-monsoon in South China, the main moisture transport channel
309
originates from the West Pacific which is consistent with a previous work of Chen and Luo
310
(2018). The most important moisture source is also from the West Pacific providing abundant
311
water vapor that is actually converted to precipitation in South China.
312
3.2 Monsoon in South China 313
After the onset of SCS summer monsoon, the entire regional atmospheric circulation
314
jumps to a new state, EASM actually starts and enters into a stronger period. But main
315
monsoonal precipitations remain in South China. Main moisture transport channels are shown
316
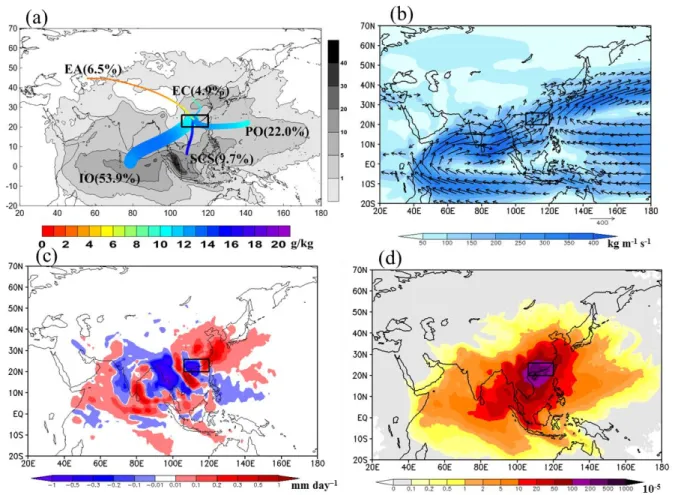
in Figure 4. EASM is remarkably different from what it is in the precedent period. We can see,
317
in Figure 4a, that the Indian Ocean moisture channel becomes the strongest one. The
318
trajectories proportion increases from 24.6% (before the onset of SCS summer monsoon) to
319
53.9%. More than half of the trajectories come from the Indian Ocean. The average specific
320
humidity increases from 10 to 14 g/kg, which also indicates that water vapor for this period is
321
mainly from the Indian Ocean. At the same time, the West Pacific Ocean shows an obviously
322
weaker contribution. Only 22.0% of the trajectories come from the West Pacific Ocean and
323
the corresponding pathway is a bit northward shifted, compared to the former period. Besides,
324
trajectories from the westerlies and from local areas are also weakened, their trajectories
325
proportions are only 6.5% and 4.9% respectively. These results are also consistent with
326
previous works of Chen and Luo (2018) and Chu et al (2017). They divided the Indian Ocean
327
channel into two channels and the sum of these two channels makes the total trajectories
328
proportion at a level of about 50% which is very close to our result. The vertically-integrated
water vapor transport, calculated within the Eulerian framework, confirms the conclusion
330
(Figure 4b). During this period, the southwest monsoonal flow from the Indian Ocean
331
strengthens rapidly and the whole South Asian monsoon system goes quickly into its mature
332
stage, with a strong Somalian cross-equatorial flow, and monsoonal flows over the Arabian
333
Sea, the Indian Peninsula, the Bay of Bengal, and the Indochina Peninsula, and finally over
334
the South China Sea. This monsoonal flow inducing rainfalls in South China is now the main
335
moisture channel. The West Pacific Ocean channel is rapidly weakened and its influence
336
reduced. Such behaviors are in total agreement with what described in the current literature
337
(e.g. Chi et al. 2005, and Li et al. 2014, among many others) which also show that after the
338
onset of SCS summer monsoon, the subtropical high withdraws out of the South China Sea,
339
and the powerful cross-equatorial flow crosses the Bay of Bengal and transports moisture
340
towards South China. So, the Indian Ocean channel is the most important moisture transport
341
pathway in this stage.
342
The spatial distribution of E-P is also calculated and shown in Figure 4c. We can see that
343
after the onset of SCS summer monsoon, the maximum value of E-P is in north part of the
344
South China Sea, moisture source from the Indian Ocean is stronger and that from the Pacific
345
Ocean is weaker. As for moisture CDF (Figure 4d), the biggest value is in South China and
346
north part of the South China Sea where the CDF value is larger than 2.0x10⁻³. CDF in the
347
South China Sea is about 5.0x10⁻⁴. Compared to the rainy season before the onset of SCS
348
summer monsoon, intensity of CDF is decreased in the West Pacific Ocean. Contours CDF of
349
1.0x10⁻⁵ and 1.0x10⁻⁴ extend to 165°E and 135°E, respectively. This shows a clear westward
350
shift. On the contrary, CDF in the Indian Ocean is obviously increased. CDF values for most
part of the Indian Ocean are larger than 1.0x10⁻⁵. CDF in the Bay of Bangel is larger than
352
1.0x10⁻⁴.
353
During the monsoon in South China, the Indian Ocean channel is the most important
354
moisture transport channel, which includes more than half of the trajectories, and the
355
contribution rate also increases a lot. Meanwhile the West Pacific Ocean impact is reduced.
356
Besides, the biggest value of the moisture contribution is in South China and north part of the
357
South China Sea.
358
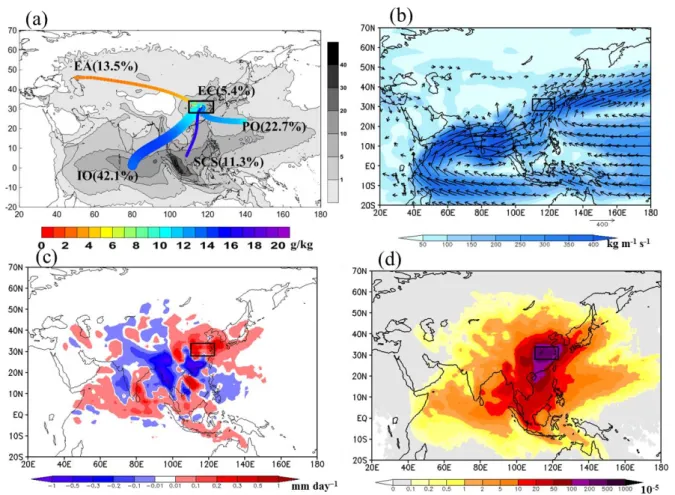
3.3 Monsoon (Meiyu) in the Yangtze-Huaihe River basin 359
For the Meiyu period, the EASM propagates to the Yangtze-Huaihe River Basin, and
360
leads to persistent rainfalls in this region. The moisture transport characters for this period
361
have both similarities and differences with the former monsoon stage. During Meiyu, the IO
362
channel is still the most important one and the portion of trajectories reaches to 42.1%. The
363
PO channel (22.7%) and Westerly channel (13.5%) are a bit strengthening. The spatial
364
distribution of the vertically-integrated water vapor transport (Figure 5b) shows that the IO
365
channel, the SCS channel and the PO channel converge in South China and move northward
366
to converge in the Yangtze-Huaihe River Basin region, resulting in plum rain in this period.
367
Xu et al. (2004, 2008), Zuo et al. (2009), Wei et al. (2012) and Jiang et al. (2013) also indicate
368
that IO channel is the most important water vapor channel in Yangtze-Huaihe River basin.
369
The spatial distribution of E-P (Figure 5c) also shows some similarities with the former
370
monsoon stage, main moisture source is found in the West Pacific Ocean, East China, the
371
South China Sea and the Indian Ocean. It is interesting to note that the Indian Ocean channel
372
is the main moisture pathway, but the Indian Ocean does not constitute the main moisture
source. In fact, as shown in Figure 5c, the pathway from the Indian Ocean goes through the
374
India Peninsula and the Indochina Peninsula, a significant part of moisture from the Indian
375
Ocean is lost along the trajectories. By consequence, in the spatial distribution of CDF (Figure
376
5d), the Indian Ocean is not the most important moisture source with a contribution density to
377
precipitation only about 1.0x10⁻⁵ to 1.0x10⁻⁴. The maximum of the contribution density, larger
378
than 1.0x10⁻³, is in the Yangtze-Huaihe River Basin itself and in South China. Compared to
379
the monsoon in South China, the Meiyu period shows CDF decreasing in south and increasing
380
in north. CDF in the Indian Ocean and South China Sea is in decrease, but the region of CDF
381
exceeding 1.0x10⁻⁵ extends to 50°N.
382
For the Meiyu stage of EASM in the Yangtze-Huaihe River Basin, the most important
383
moisture channel is still that from the Indian Ocean, which comprises 43.4% of the
384
trajectories. But it has great moisture loss along the trajectories, so the moisture contribution
385
for the precipitation is relatively small. The most important moisture contribution region is the
386
Yangtze-Huaihe River Basin and South China.
387
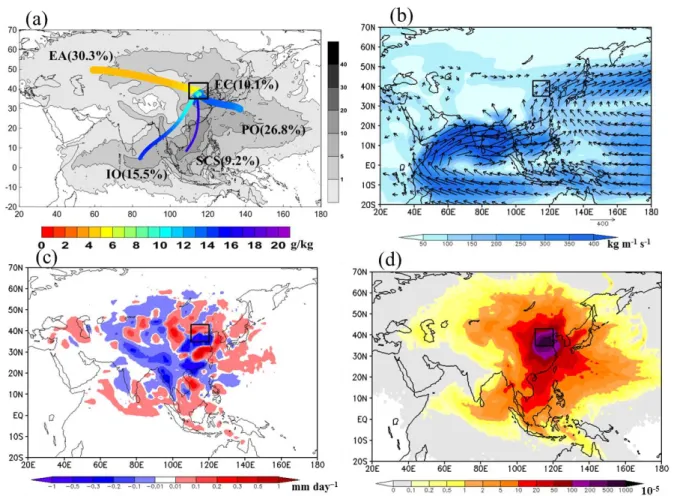
3.4 Terminal stage of monsoon in North China 388
North China rainy season is the terminal stage of EASM. As the monsoon moves to
389
North China, the rainy belt also shifts to North China and can stay for a few weeks. During
390
the monsoon terminal stage in North China, the most important moisture transport paths
391
change from IO to mid-latitude westerlies and to PO (figure 6a), the proportions for these two
392
channels being 30.3% and 26.8% respectively. As shown in Figure 6b, the IO channel, the
393
SCS channel and the PO channel move northward to North China, affecting the local rainfall.
394
Mid-latitude westerlies also influence the rain belt. It should be noticed that, although the
number of trajectories in mid-latitude westerlies is the biggest, specific humidity of this
396
channel is small, so the vertically-integrated water vapor transport in this channel is relatively
397
small. Our results confirm Jiang et al. (2017) who showed that Eurasia has the maximum
398
parcels and the Pacific Ocean has the second largest number of parcels during the rainy
399
season in North China.
400
Figure 6c is the spatial distribution of E-P for the terminal stage of EASM in North
401
China. The main moisture source regions for the rainfall in North China are the eastern
402
coastal areas of China, the northern part of the South China Sea and the Yangtze-Huaihe River
403
Basin. Main moisture sink regions are North China, South China and the Indochina Peninsula.
404
The spatial distribution of CDF to precipitation in North China indicates that the maximum
405
value is still near the target area, and the average contribution density exceeds 5.0x10⁻³. CDF
406
in the south is further reduced, only the South China Sea and small areas east of Taiwan show
407
CDF values higher than 1.0x10⁻⁴. Meanwhile, CDF in the north is significantly increased. The
408
region contour 1.0x10⁻⁵ reaches to Balkhash Lake in the west and 60°N in the north. On the
409
whole, the main moisture transport channels during the terminal stage of monsoon in North
410
China are those from the mid-latitude westerlies and the West Pacific Ocean, with trajectories
411
rates at 30.3% and 26.8% respectively. But there is low specific humidity from the westerlies
412
channel, so the westerlies channel has little influence for the monsoon in North China. The
413
most important moisture sources are from East China.
414
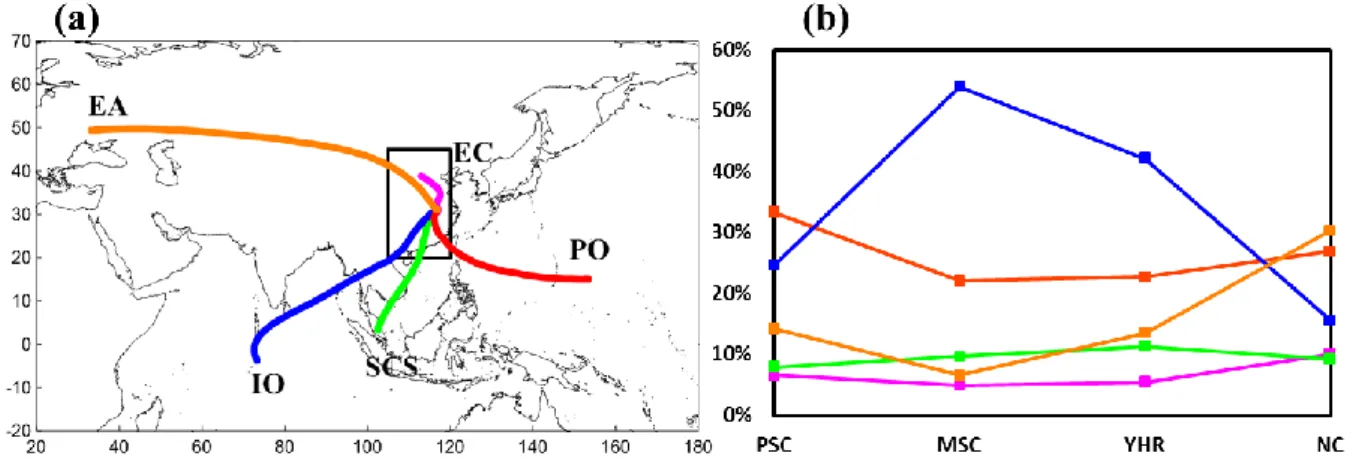
3.5 Moisture transport evolution during the northward propagation of EASM 415
From what shown above, it is clear that, accompanying the northward propagation of
416
EASM, the main water vapor channel experiences profound changes. It is sourced in the West
Pacific Ocean (PO) for the pre-monsoon in South China (SC). It changes then to the Indian
418
Ocean (IO) when the monsoon sets up in SC and in the Yangtze-Huaihe River Basin. Finally
419
the main water vapor channel is back to PO for the terminal stage of monsoon in North China.
420
As shown in Fig. 7, the proportion of trajectories shows quite distinct behaviors for their
421
seasonal evolution. The two channels from south and southwest (SCS channel and IO channel)
422
increase firstly, and then decrease with northward shift of the rain-belt. In the contrary, the
423
water vapor channels from the mid-latitude westerly, the West Pacific Ocean and the local
424
moisture recycling show opposite characteristics, with an initial decrease followed by an
425
increase.
426
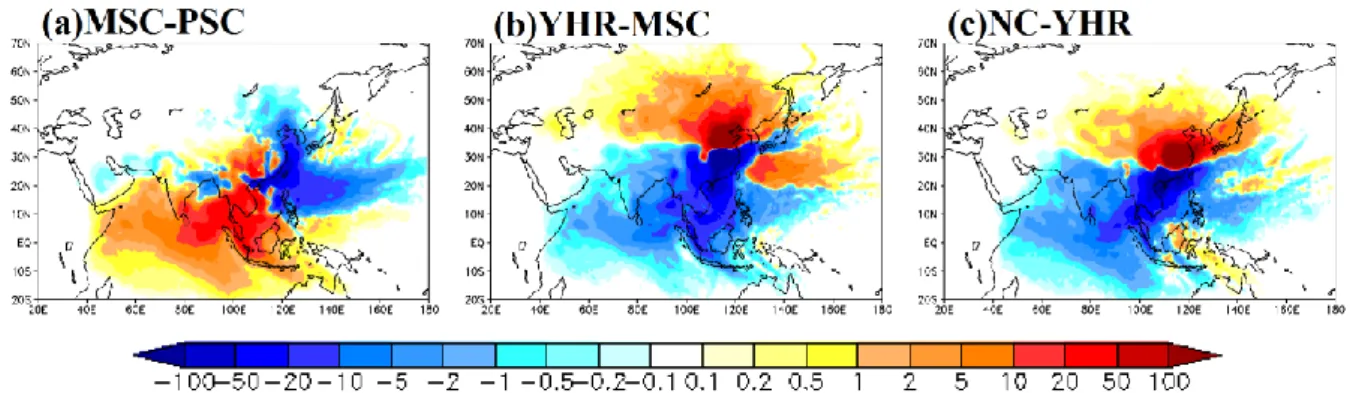
Not only water vapor channels change profoundly following the seasonal course of the
427
summer monsoon, the spatial distribution of water vapor contribution leading to rainfall also
428
shows strong changes from one period to another. Figure 8 shows difference maps of CDF
429
between two sequential stages. From the pre-monsoon to the onset of monsoon in South
430
China, the moisture contribution from the Indian Ocean and the south part of the South China
431
Sea has an obvious increase. Meanwhile, there are decreases of CDF in the north part of the
432
South China Sea and in the West Pacific Ocean. This situation is largely expected since the
433
onset of the monsoon in India and in South China implies much more water vapor coming
434
from southwest. A large decreasing zone covering the Bay of Bengal, South China and the
435
adjacent South China Sea reflects strong monsoon rainfalls in these areas. It is to be noted that
436
there is a zone of increasing CDF in the northwest area of our target region, certainly related
437
to the special topography in the lee side of the Tibetan Plateau.
438
When the monsoon rain belt reaches the Yangtze-Huaihe River Basin, we observe an
opposite situation as shown in Figure 8b. There is a clear dipole with decreasing contribution
440
from the south and increasing contribution from the north. The demarcation line is located
441
around 25° - 30°N. As we mentioned earlier, the northward shift of the research region
442
reflects the seasonal migration of the summer monsoon which induces a systematic northward
443
shift of the water vapor contribution. This phenomenon is also visible in Figure 8c displaying
444
the changes of CDF when the monsoon shifts from the Yangtze-Huaihe River Basin to its
445
terminal stage in North China. The water vapor from north is more important and that from
446
south is less important. It should be noticed that the moisture contribution from the Pacific
447
Ocean is larger, showing a more important role played by the West Pacific Ocean.
448
3.6 Contribution from different source regions 449
From what described previously, we can see that our Lagrangian trajectories can be
450
quantitatively used to assess the intensity of moisture transport channels and determine the
451
main pathway in each stage of the monsoonal northward propagation. The
452
Evaporation-minus-Precipitation diagnosis considering the absorption and release of moisture
453
along the trajectories can further determine the source characteristics of water vapor. Finally,
454
the improved areal source–receptor attribution method allows us to quantify the moisture
455
contribution of each source for the precipitation in the target region. With the northward
456
propagation of EASM, significant changes take place in water vapor channels, including
457
moisture sources and water vapor contributions to rainfall. In this section, we study
458
furthermore the properties of CDF which is a new measure with powerful diagnostic abilities.
459
We want to focus on its dynamic evolution in function of the monsoon northward
460
propagation.
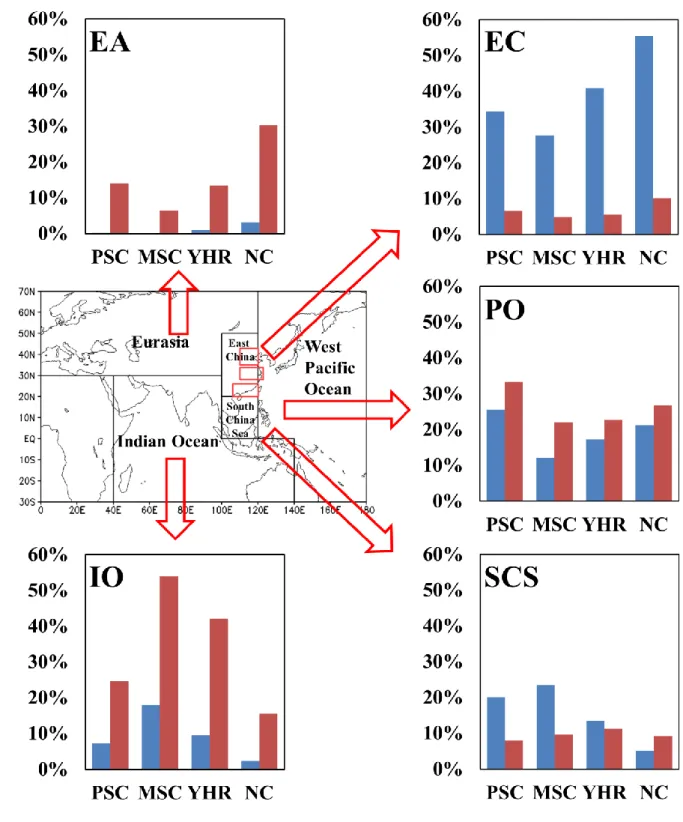
To be consistent with the above-shown moisture transport channel, we use the same five
462
moisture source regions: (1) East China (EC), (2) West Pacific Ocean (PO), (3) South China
463
Sea (SCS), (4) Indian Ocean (IO) and (5) Eurasia (EA) (Figure 9, background map). We can
464
now calculate the moisture contribution to precipitation for each of these source regions by
465
just integrating the Contribution Density Function (CDF) for each region. It is also relevant to
466
compare such regional contributions to the intensity of each moisture transport channel.
467
As shown in Figure 9, the moisture contribution from East China (EC) to regional
468
precipitations is very high for all the four stages of the summer monsoon. This regional
469
moisture contribution is well above the proportion of trajectories. In fact, all proportions of
470
trajectories are under 10%, but the moisture contributions are mostly over 30%. This result
471
clearly indicates that more than 30% of the moisture for precipitations in East China is
472
originated from local evaporations. The local water recycling plays an important role for
473
precipitation in each stage of the rainy season. Obviously, this kind of local evaporation is
474
closely related to the hydrological conditions and vegetation behaviors of the underlying
475
surface. In fact, it is closely related to early precipitations.Previous studies have also shown
476
that soil moisture is an important factor for monthly and seasonal forecasting (Walker and
477
Rowntree, 1977; Tuttle and Salvucci, 2016). Zuo and Zhang (2007) already pointed out that
478
spring precipitation and soil moisture in East China exert an important effect on summer
479
precipitation. It is remarkable that, after the onset of SCS summer monsoon, soil moisture
480
accumulation in East China due to earlier precipitation enhances local evaporation and then
481
precipitation. This is especially true for the terminal stage of monsoon in North China with a
482
regional moisture contribution up to 55%, reflecting that local water vapor recycling and
precipitation in early rainy season play a very important role in the regional monsoon strength.
484
In general, evaporation in East China plays an important role for the rainfall in EASM.
485
PO is also an important moisture source region contributing to precipitations in East
486
China. The regional contributions from PO are all larger than 10%. It is the highest (25%) for
487
the pre-monsoon in South China. The second largest contribution (> 20%) is found for the
488
terminal stage of monsoon in North China.
489
The moisture contribution from SCS shows a big difference between the rainfall stage in
490
South China and other two stages in the Yangtze River valley and in North China during the
491
monsoon seasonal course. In South China, no matter before or after the onset of the SCS
492
summer monsoon, the moisture contributions from SCS are both larger than 20%, which
493
constitutes an important moisture source. But when the monsoon goes to the Yangtze River
494
basin and further to North China, this moisture contribution diminishes rapidly, until 5.1% in
495
the terminal stage of monsoon in North China.
496
For the Indian Ocean, if we examine the proportion of trajectories, we can see that the IO
497
water vapor transport channel is an important one for the whole monsoon course. This is in
498
agreement with our general believing. In particular, for rainfall period in South China and the
499
Meiyu in the Yangtze-Huaihe River valley, we can account about half of the trajectories.
500
However, if we examine the moisture contribution to the actual precipitations, a different
501
image appears. The contribution from IO is actually quite small. For the four sub-periods of
502
the monsoon seasonal course, it is only 7.2%, 18.0%, 9.5% and 2.4% respectively. The main
503
reason is that the pathway of the IO channel goes through the Indian Peninsula and the
504
Indochina Peninsula which are important moisture sink regions to the rainfall in target region.
Moisture is thus lost along the trajectories, which induces a low contribution from the Indian
506
Ocean for precipitations in East China.
507
Eurasian land is another region for which the “true” moisture contribution rates are all
508
lower than the proportions of accounted trajectories. As is shown in Figure 8, the trajectories
509
rates are all larger than 10% except when the monsoon is in South China, but enhanced when
510
the monsoon reached North China. For the latter case, the proportion of trajectories from
511
mid-latitude westerlies reaches its peak value of 30.2%. In terms of moisture contribution to
512
precipitations, all contributions from EA are smaller than 3.5%. The main reason is that the
513
specific humidity of air parcels from EA is small (Figure 3a). Therefore, the impact on
514
precipitation of EASM is also small.
515
In summary, with the northward migration of EASM during its seasonal course, the
516
moisture transport channels and moisture source regions show continuous and significant
517
changes.The main water vapor channel is firstly from PO for the pre-monsoon in South China.
518
It is then from IO for the starting monsoon in South China and Meiyu in the Yangtze-Huaihe
519
River Basin. Finally, it returns to PO in the terminal stage of monsoon in North China. And
520
based on the evaporation-minus-precipitation diagnosis and the areal source–receptor
521
attribution method, the main moisture source during pre-monsoon in South China is PO and
522
EC and the contribution rates are 34.3% and 27.7%, respectively. After the onset of South
523
China Sea summer monsoon, EC and SCS are the most important moisture sources in this
524
period, their contribution rates being both larger than 23%. During Meiyu in the
525
Yangtze-Huaihe River Basin and terminal stage of monsoon in North China, the moisture of
526
this period mainly comes from EC, the contribution rate reaching to 40.9% and 55.3%. And
our results on water vapor channels are consistent with published literature, such as, Lin et al.
528
(2014), Chen and Luo (2018), Zuo et al. (2009) and Jiang et al. (2017). But it is clear that
529
main moisture actually contributing to EASM precipitations doesn’t necessarily come from
530
the strongest water vapor pathways. For example, trajectory proportions for IO are larger than
531
25% especially in the stage of monsoon in South China (53%), but the moisture contributions
532
are generally smaller than 10%. This is mainly due to the fact that a large amount of water
533
vapor is actually lost in the transport pathways through important moisture sink areas such as
534
the Indian Peninsula and Indochina Peninsula. On the contrary, local water vapor recycling
535
inside EC plays an important role for the regional precipitations, with contributions mostly
536
over 30%, although the trajectory proportions for EC are all under 10%. The contribution rate
537
can even exceed 55% for the terminal stage of monsoon in North China.
538
Our results seem qualitatively in agreement with Sun and Wang (2015) who emphasized
539
the role of land evaporation in precipitations falling in the Yangtze-Huaihe river basin and in
540
North China. Similar conclusions are also reported in Drumond et al. (2011a) for
541
precipitations in different regions of China. One can also mention the work of Drumond et al.
542
(2011b) investigating precipitations in the Mediterranean area. It was convincingly shown that
543
local sources provide moisture for the Eastern Mediterranean and Western North Africa.
544
However, if we quantitatively compare our results to those reported in Sun and Wang (2015),
545
our results seem to give larger weights on evaporation along the trajectories. This is certainly
546
due to the fact that we incorporated a rule of boundary layer water vapor source in our
547
calculations.
548
4. Conclusion and Discussion
In this paper, we used the HYSPLIT platform to calculate Lagrangian trajectories of air
550
parcels that reach East China during the northward propagation of the East Asian Summer
551
Monsoon. Our study, with NCEP/NCAR reanalysis data as driving conditions, covers a long
552
period from 1961 to 2010 to ensure the significance of results. In Supplementary materials S1
553
and S2, we explored the sensitivity of our results to two other datasets and to the use of a
554
second Lagrangian trajectory model, FLEXPART. The difference is estimated below 5 %
555
among different datasets and below 10% between the two Lagrangian models. To fully
556
explore the Lagrangian trajectories, we calculate the mean moisture trajectories to get the
557
main moisture channel. Since water vapor is not a conservative tracer following the
558
trajectories, we also elaborated the Evaporation-minus-Precipitation diagnosis and the areal
559
source–receptor attribution of water vapor contribution. We can thus obtain a robust picture
560
for the water vapor transport, including paths, moisture sources and moisture contribution
561
from different regions to precipitations in EASM. Main findings are summarized as follows:
562
Four main water vapor channels and their contribution have significant changes while
563
the rain-belt in East China propagates from south to north. These water vapor channels are
564
from PO (West Pacific Ocean), IO (Indian Ocean), SCS (South China Sea) and the
565
mid-latitude westerlies, respectively. And local transportation also plays an important role in
566
each rainy season. In the pre-monsoon stage with rainfall in South China, the most important
567
moisture transport channels are from PO and IO, the proportion of the trajectories being 33.3%
568
and 24.6% respectively, consistent with our general expectation. But main moisture sources
569
are from East China and PO, with moisture contribution rates at 34.3% and 25.7%
570
respectively, highlighting the role of local evaporation for precipitations. After the onset of the
SCS summer monsoon,but when the monsoon rain-belt is still in South China, the IO channel
572
strengthens, with the trajectories proportion increasing to 53.9%. This reflects the onset of the
573
Indian monsoon which enters into the South China Sea. Despite the Indian monsoon
574
strengthening, EC and SCS are, however, the most important moisture sources in this period,
575
their contribution rates to precipitations being both larger than 23%. For Meiyu in the
576
Yangtze-Huaihe River basin, the IO channel is still the most important water vapor channel,
577
which includes 42.1% of all the trajectories. But the contribution rate from East China to
578
precipitations is the highest (40.9%). East China becomes the most important moisture source
579
region. When the monsoon is in its terminal stage in North China, the most important
580
moisture channels are the mid-latitude westerlies channel and PO channel, their trajectories
581
proportions being 30.3% and 26.8%, and the local water vapor recycling in East China has the
582
greatest contribution to rainfall in North China during this stage, its contribution rate
583
exceeding 55%.
584
It is worthy to emphasize that main moisture for the EASM precipitation doesn’t
585
necessarily come from the strongest water vapor pathways. For example, trajectory
586
proportions for IO are all larger than 25% (exceeding 53% in the stage of monsoon in South
587
China), but moisture contributions to rainfall are always smaller than 10%. This
588
counter-intuitive result is in fact quite logic, since a large amount of water vapor is lost in the
589
transport pathways crossing important moisture sink areas such as the Indian Peninsula and
590
Indochina Peninsula. On the contrary, local water vapor recycling inside East China plays an
591
important role for the regional precipitations, with contributions mostly over 30%, especially
592
in the terminal stage of monsoon in North China the contribution rate can even exceed 55%,
although the trajectory proportions for East China are all under 10%.
594
Finally, we can see that our analysis based on Lagrangian trajectories provides very
595
useful information on water vapor transport, its source-sink regions and its contributions to
596
rainfall. Results are generally in agreement with Eulerian diagnosis of water vapor transport.
597
The focus of this study was put on precipitations in East China during the northward
598
migration course of the regional summer monsoon. We examined only climatological fields. It
599
is necessary to extend the current study to investigating interannual and interdecadal
600
variations of moisture transport.
601
Acknowledgments. Constructive comments from three anonymous reviewers were very helpful to improve
602
an earlier version of this paper. We thank Dr. Sun Bo for his great help on technology guidance. We 603
acknowledge the National Climate Center (NCC) of China (http://ncc.cma.gov.cn) for the observations and 604
NOAA, the Air Resources Laboratory (ARL), from ARLˈs archives 605
(http://ready.arl.noaa.gov/gbl_reanalysis.php) for NCEP/NCAR reanalysis data. This work is supported by 606
the National Natural Science Foundation of China (41675081), and the National Key Research and 607
Development Program of China (grant 2016YFA0600402). Zhengyu Liu is partly supported by the U.S. 608
NSF and DOE. Laurent Li is partly supported by the French ANR project China-Trend-Stream. 609
References
610
Bertò, A., A. Buzzi, and D. Zardi, 2004: Back-tracking water vapour contributing to a
611
precipitation event over Trentino: a case study. Meteorologische Zeitschrift, 13, 189-200,
612
https://doi.org/10.1127/0941-2948/2004/0013-0189.
613
Brubaker, K. L., P. A. Dirmeyer, A. Sudradjat, and B. S. Levy, 2001: A 36-yr climatological
614
description of the evaporative of warm-season precipitation in the Mississippi river basin.
J. Hydrometeor., 2, 537-557,
616
https://doi.org/10.1175/1525-7541(2001)002<0537:AYCDOT>2.0.CO;2.
617
Bottyán, E., G. Czuppon, K. Kármán, T. Weidinger, and L. Haszpra, 2014: Moisture source
618
diagnostic for Hungary based on trajectory analysis and stable isotopic composition of
619
precipitation. EGU General Assembly Conference Abstracts, Vol. 16.
620
Chang, C. P., 2004: East Asian Monsoon. World Scientific. 564pp.
621
Chen, B., X. Xu, and T. Zhao, 2013: Main moisture sources affecting lower Yangtze River
622
Basin in boreal summers during 2004-2009. Int. J. Climatol., 33,1035-1046,
623
https://doi.org/10.1002/joc.3495.
624
Chen, L., and Coauthors, 1991: East Asia Monsoon. China Meteorological Press, 362. (in
625
Chinese)
626
Chen, Y., and Y. Luo, 2018: Analysis of Paths and Sources of Moisture for the South China
627
Rainfall during the Pre-summer Rainy Season of 1979–2014. Journal of Meteorological
628
Research, 32, 744-757, https://doi.org/10.1007/s13351-018-8069-7. 629
Chi, Y., J. He, and W. Wu, 2005: Features analysis of the different precipitation periods in the
630
pre-flood season in South China. Journal of Nanjing Institute of Meteorology, 28,
631
163-171, https://doi.org/10.3969/j.issn.1674-7097.2005.02.003.
632
Chu, Q., Q. Wang, and G. Feng, 2017: Determination of the major moisture sources of
633
cumulative effect of torrential rain events during the preflood season over South China
634
using a Lagrangian particle model, J. Geophys. Res. Atmos., 122, 8369–8382,
635
https://doi.org/10.1002/2016JD026426.
636
Connolley, W. M., J. C. King, 1993: Atmospheric water‐vapour transport to Antarctica
inferred from radiosonde data. Quarterly Journal of the Royal Meteorological Society,
638
119(510): 325-342,https://doi.org/10.1002/qj.49711951006.
639
Diem, J. E., and D. P. Brown, 2006: Tropospheric moisture and monsoonal rainfall over the
640
southwestern United States. J. Geophys. Res. Atmos., 111(D16),
641
https://doi.org/10.1029/2005JD006836.
642
Dirmeyer, P. A., K. L. Brubaker, and T. DelSole, 2009: Import and export of atmospheric
643
water vapor between nations, J. Hydrol., 365, 11–22,
644
https://doi.org/10.1016/j.jhydrol.2008.11.016.
645
Ding, Y., Z. Wang, and Y. Sun, 2008: Inter-decadal variation of the summer precipitation in
646
East China and its association with decreasing Asian summer monsoon. Part I: Observed
647
evidences. Int. J. Climatol., 28: 1139–1161, https://doi.org/10.1002/joc.1615.
648
Dominguez, F., P. Kumar, X. Liang, and M. Ting, 2006: Impact of atmospheric moisture
649
storage on precipitation recycling. J. Climate, 19, 1513–1530,
650
https://doi.org/10.1175/JCLI3691.1.
651
Dominguez, F., G. Miguez-Macho, and H. Hu, 2016: WRF with water vapor tracers: A study
652
of moisture sources for the North American monsoon. Journal of Hydrometeorology,
653
17(7), 1915-1927. https://doi.org/10.1175/jhm-d-15-0221.1
654
Draxler, R. R., and G. Hess, 1998: An overview of the HYSPLIT_4 modelling system for
655
trajectories, Aust. Meteorol. Mag., 47, 295–308.
656
Draxler, R. R., and G. D. Rolph, 2011: HYSPLIT (HYbrid Single-Particle Lagrangian
657
Integrated Trajectory) Model; National Oceanic and Atmospheric Administration, Air
658
Resources Laboratory READY Web site. https://ready.arl.noaa.gov/HYSPLIT.php.
Drumond, A., R. Nieto, and L. Gimeno, 2011a: Sources of moisture for China and their
660
variations during drier and wetter conditions in 2000−2004: a Lagrangian approach.
661
Climate Research, 50: 215-225. https://doi.org/10.3354/cr01043.
662
Drumond, A., R. Nieto, E. Hernandez, and L. Gimeno, 2011b: A Lagrangian analysis of the
663
variation in moisture sources related to drier and wetter conditions in regions around the
664
Mediterranean Basin, Nat. Hazards Earth Syst. Sci., 11: 2307-2320,
665
https://doi.org/10.5194/nhess-11-2307-2011,.
666
Eiras-Barca, J., F. Dominguez, H. Hu, D. Garaboa-Paz, and G. Miguez-Macho, 2017:
667
Evaluation of the moisture sources in two extreme landfalling atmospheric river events
668
using an Eulerian WRF tracers tool. Earth System Dynamics, 8(4), 1247,
669
https://doi.org/10.5194/esd-8-1247-2017.
670
Gimeno, L., A. Drumond, R. Nieto, R. M. Trigo, and A. Stohl, 2010: On the origin of
671
continental precipitation. Geophysical Research Letters, 37(13),
672
https://doi.org/10.1029/2010GL043712.
673
Huang, R., Z. Zhang, G. Huang, and B. Ren, 1998: Characteristics of the water vapor
674
transport in East Asian monsoon region and its difference from that in South Asian
675
monsoon region in summer. Chinese J. Atmos. Sci, 22, 469-479,
676
https://doi.org/10.3878/j.issn.1006-9895.1998.04.08.
677
Huang, W., X. He, Z. Yang, T. Qiu, J. S. Wright, B. Wang, and D. Lin, 2018: Moisture sources
678
for wintertime extreme precipitation events over South China during 1979–2013. J.
679
Geophys. Res. Atmos., 123, 6690-6712, https://doi.org/10.1029/2018JD028485. 680
Insua-Costa, D., and G. Miguez-Macho, 2018: A new moisture tagging capability in the