HAL Id: hal-00301237
https://hal.archives-ouvertes.fr/hal-00301237
Submitted on 2 Sep 2003HAL is a multi-disciplinary open access
archive for the deposit and dissemination of sci-entific research documents, whether they are pub-lished or not. The documents may come from teaching and research institutions in France or abroad, or from public or private research centers.
L’archive ouverte pluridisciplinaire HAL, est destinée au dépôt et à la diffusion de documents scientifiques de niveau recherche, publiés ou non, émanant des établissements d’enseignement et de recherche français ou étrangers, des laboratoires publics ou privés.
Study of the effect of different type of aerosols on UV-B
radiation from measurements during EARLINET
D. S. Balis, V. Amiridis, C. Zerefos, A. Kazantzidis, S. Kazadzis, A. F. Bais,
C. Meleti, A. Papayannis, V. Matthias, H. Dier
To cite this version:
D. S. Balis, V. Amiridis, C. Zerefos, A. Kazantzidis, S. Kazadzis, et al.. Study of the effect of different type of aerosols on UV-B radiation from measurements during EARLINET. Atmospheric Chemistry and Physics Discussions, European Geosciences Union, 2003, 3 (5), pp.4671-4700. �hal-00301237�
ACPD
3, 4671–4700, 2003
Different type of aerosols and UV-B
radiation D. S. Balis et al. Title Page Abstract Introduction Conclusions References Tables Figures J I J I Back Close
Full Screen / Esc
Print Version Interactive Discussion
© EGU 2003
Atmos. Chem. Phys. Discuss., 3, 4671–4700, 2003 www.atmos-chem-phys.org/acpd/3/4671/
© European Geosciences Union 2003
Atmospheric Chemistry and Physics Discussions
Study of the e
ffect of different type of
aerosols on UV-B radiation from
measurements during EARLINET
D. S. Balis1, V. Amiridis1, C. Zerefos1, 2, A. Kazantzidis1, S. Kazadzis1, A. F. Bais1, C. Meleti1, A. Papayannis3, V. Matthias4, and H. Dier5
1
Laboratory of Atmospheric Physics, Aristotle University of Thessaloniki, 54006 Greece
2
Laboratory of Climatology, University of Athens, Greece
3
National Technical University of Athens, Greece
4
Max Planck Institute for Meteorology, Hamburg, Germany
5
German Weather Service, Meteorological Observatory Lindenberg, Germany Received: 8 July 2003 – Accepted: 7 August 2003 – Published: 2 September 2003 Correspondence to: D. S. Balis (balis@auth.gr)
ACPD
3, 4671–4700, 2003
Different type of aerosols and UV-B
radiation D. S. Balis et al. Title Page Abstract Introduction Conclusions References Tables Figures J I J I Back Close
Full Screen / Esc
Print Version Interactive Discussion
© EGU 2003 Abstract
Routine lidar measurements of the vertical distribution of the aerosol extinction co-efficient and the extinction-to-backscatter ratio have been performed at Thessaloniki, Greece using a Raman lidar system in the frame of the EARLINET project since 2000. Spectral and broadband UV-B irradiance measurements, as well as total ozone
ob-5
servations, were available whenever lidar measurements were obtained. From the available measurements several cases could be identified that allowed the study of the effect of different types of aerosol on the levels of the UV-B solar irradiance at the Earth’s surface. The TUV radiative transfer model has been used to simulate the ir-radiance measurements, using total ozone and the lidar aerosol data as input. From
10
the comparison of the model results with the measured spectra the effective single scattering albedo was determined using an iterative procedure, which has been veri-fied against results from the 1998 Lindenberg Aerosol Characterization Experiment. It is shown that the same aerosol optical depth and same total ozone values can show differences up to 10% in the UV-B irradiance at the Earth’s surface, which can be
at-15
tributed to differences in the aerosol type. It is shown that the combined use of the estimated single scattering albedo and the measured extinction-to-backscatter ratio leads to a better characterization of the aerosol type probed.
1. Introduction
Over the last decades there has been evidence for an increase of the biological active
20
solar ultraviolet (UV-B) radiation reaching the earth’s surface (e.g. Kerr and McElroy, 1993; Zerefos et al., 1997; Zerefos et al., 1998), as a consequence of the continuing negative trends in the stratospheric ozone concentration (WMO, 1998). However, there are still uncertainties in the UV trends since they are strongly affected by changes in the aerosol optical properties and changes in cloud cover (Zerefos et al., 2001; WMO
25
ACPD
3, 4671–4700, 2003
Different type of aerosols and UV-B
radiation D. S. Balis et al. Title Page Abstract Introduction Conclusions References Tables Figures J I J I Back Close
Full Screen / Esc
Print Version Interactive Discussion
© EGU 2003
levels it is difficult to determine accurately the role of each parameter, especially for urban sites, where UV-B reaching the boundary layer has a large diffuse component. Therefore it is more effectively absorbed by tropospheric ozone than the direct beam under high sun conditions (Br ¨uhl and Crutzen, 1989; Papayannis et al., 1998). In-creases of the solar UV radiation may have a major effect on the environment (i.e. affect
5
the ecosystem processes and biochemical cycles) and on humans (i.e. DNA damage, skin cancer, ocular effects) (Madronich, 1993). Additionally, a change in the UV radia-tion has direct effects on the chemical composition of the troposphere by affecting the photodissociation rates of various important atmospheric trace gases involved in the photochemical reactions in the lower atmosphere (e.g. Balis et al., 2002; Lantz et al.,
10
1996; Shetter et al., 1996).
During the last years various radiative transfer models have been developed such as the TUV, (Madronich, 1993) and the LibRadTran, (e.g. Mayer et al., 1997), which offer various methods for the solution of the radiative transfer equation and allow the interpretation of the solar UV measurements. There are various studies that compare
15
calculated UV spectra with measured ones (e.g. Kylling et al., 1997; Mayer, 1997; Kazantzidis et al., 2001). A common result of these studies is that good agreement can be achieved only if the input parameters are accurate and well defined. If this is the case, the simulated spectra can agree within 5% with the measurements. How-ever at most stations where spectral UV measurements are available usually the only
20
information concerning the optical properties of aerosols is the aerosol optical depth and its spectral dependence (Angstr ¨om exponent). There are also a few cases, where the type of aerosols (refractive index, size distribution) is also available from measure-ments, mainly from CIMEL sunphotometers.
The extinction to backscatter ratio usually referred as the lidar ratio is a quantity
25
that is directly measured by Raman lidar (e.g. Ansmann et al., 1992) and the single scattering albedo (SSA) is one of the most dominant input factors that determine the aerosol type in a radiative transfer model (e.g. Kylling et al., 1998). Both depend on the microphysical properties of the aerosols and therefore their value can be used
ACPD
3, 4671–4700, 2003
Different type of aerosols and UV-B
radiation D. S. Balis et al. Title Page Abstract Introduction Conclusions References Tables Figures J I J I Back Close
Full Screen / Esc
Print Version Interactive Discussion
© EGU 2003
for the characterization of the aerosol type. Ferrare et al. (1998) used Raman lidar and aircraft size distribution measurements to derive estimates of the single scattering albedo. Their estimates showed that for similar humidity conditions an increase in li-dar ratio is accompanied by a decrease in SSA. As a consequence same lili-dar ratios can correspond to different SSA values, under different humidity conditions. This fact
5
indicates that the combined use of SSA and lidar ratio measurements will minimize the uncertainty in determining the aerosol type necessary for the model calculations. Wenny et al. (1998) utilized a Mie-scattering code and a radiative transfer model in con-junction with measured parameters (transmission and size distribution measurements) to retrieve reasonable values of the single scattering albedo. Recently Kazantzidis et
10
al. (2001) showed that there are indications for a high variability of the SSA even during the same day, which are correlated with changes in the wind direction and relative hu-midity. In this paper we study the effect of the different types of aerosols, on the levels of the solar UV radiation reaching the ground, by comparing measured and modeled spectral UV-B irradiances. As input we aerosol extinction and lidar ratio vertical
pro-15
files, measured by a Raman lidar system, together with an indirect determination of the single scattering albedo, in the case where no measured information of the size dis-tribution and chemical composition is available. First we present the instrumentation used in this study at Thessaloniki and Lindenberg, respectively. Next we briefly discuss the models used in the study, a radiative transfer model and an aerosol model for
cal-20
culating optical properties. In the results and discussion section we show comparisons between UV measurements and calculations, where the need to determine the SSA is emphasized. The method used for the estimation of the SSA is applied on a day se-lected from the LACE-98 campaign. Then from the available UV measurements three cases are selected where by using the measured lidar ratio and the estimated SSA,
25
as well as backward trajectories, we attempt to quantify the effect of different types of aerosols. Finally, we investigate the combined use of the directly measured lidar ratio, and the indirectly estimated SSA, that allow a better characterization of the aerosols, using remote sensing techniques.
ACPD
3, 4671–4700, 2003
Different type of aerosols and UV-B
radiation D. S. Balis et al. Title Page Abstract Introduction Conclusions References Tables Figures J I J I Back Close
Full Screen / Esc
Print Version Interactive Discussion
© EGU 2003 2. Data and methodology
2.1. Experimental data
At the Thessaloniki station (40.5◦N, 22.9◦E) two Brewer UV spectrophotometers, one single and one double monochromator, operate continuously and monitor the whole UV solar spectrum from 290–325 nm and 290–366 nm respectively with a 0.5 nm
spec-5
tral resolution. The calibration of the instruments is performed using a 1000 W lamp, a source with output irradiance traceable to the National Institute of Standards and Tech-nology standards every month. The stability of the instruments is monitored in the field by a set of 50 W lamps, once a week. In addition, measurements of global (direct and diffuse) erythemal irradiance are being performed (Zerefos et al., 1998). O3 and SO2
10
total columns, also determined from the Brewer spectrophotometer, have been used to provide input to the model calculations. A similar single Brewer monochromator for monitoring total ozone and spectral UV measurements of global irradiance operates continuously at Lindenberg, Germany.
The lidar system of the Laboratory of Atmospheric Physics (LAP) was designed to
15
perform continuous measurements of suspended aerosols particles in the Planetary Boundary Layer (PBL) and the lower free troposphere (Papayannis and Balis, 1998; Balis et al., 2000). It is based on the second and third harmonic frequency of a com-pact, pulsed Nd:YAG laser, which emits pulses of 300 and 120 mJ output energy at 532 nm and 355 nm, respectively, with a 10 Hz repetition rate. The optical receiver is
20
a 500 mm diameter telescope (with a 1–3 mrad adjustable field-of-view). Since mid-2000 in the frame of the European Aerosol Research Lidar Network (EARLINET) (B ¨osenberg et al., 2001) the system was upgraded to a Raman lidar and now three photomultipliers (Hamamatsu 5600P-06) are used to detect the lidar signals at 532, 355 and 387 nm, respectively. The acquisition system is based on a three-channel
25
LICEL Transient Digitizer working on both the analogue (12-bits, 40 MHz) and the pho-ton counting (250 MHz, 8192 bins) modes. Using the methodology proposed by Ans-mann et al. (1992) the measurement of the elastic-backscatter signal at 355 nm and
ACPD
3, 4671–4700, 2003
Different type of aerosols and UV-B
radiation D. S. Balis et al. Title Page Abstract Introduction Conclusions References Tables Figures J I J I Back Close
Full Screen / Esc
Print Version Interactive Discussion
© EGU 2003
of the nitrogen inelastic-backscatter signal at 387 nm permits the determination of the extinction and backscatter coefficients independently of each other and, thus, of the extinction-to-backscatter ratio also called lidar ratio (LR). For each extinction profile a large number of laser shots is averaged (usually over 30 000 laser shots) and the re-sulting signal profile is smoothed. The Raman technique also requires measurements
5
of the atmospheric density, which is computed from pressure and temperature profiles measured by radiosondes, launched at the Thessaloniki airport. The height profile of the particle backscatter coefficient at 355 nm is determined from the ratio of the elastic to the inelastic nitrogen Raman signal and the extinction-to-backscatter ratio is then calculated. An overlap correction according to the iterative technique proposed
10
by Wandinger and Ansmann (2001) is applied to the results. The lidar system of LAP and the algorithms implemented were successfully intercompared within EARLINET (Matthias et al., 2002).
For the determination of the aerosol optical depth at Lindenberg we used measure-ments performed with a multiwavelength sunphotometer that is routinely operated by
15
the DWD. In our analysis we used measurements at 399 and 451 nm and the corre-sponding Angstrm exponent. A detailed description of the instrument and its quality assurance issues is discussed in detail by Leiterer et al. (1994). The sunphotometer is regularly calibrated at mountain sites using the Langley plot technique. The abso-lute accuracy of the measured optical thickness is estimated to be ±0.02. To observe
20
the daily evolution of the aerosol loading for the day considered in this study we used backscatter profiles at 320 nm from the MPI UV lidar in KrF operation, using a grating spectrometer for the wavelength separation. The MPI UV lidar is described in detail by Matthias (2000).
Backward trajectories at certain pressure levels in the troposphere were provided
25
in the frame of EARLINET by the German Weather Service (DWD) and were used to determine the origin of the aerosols observed.
ACPD
3, 4671–4700, 2003
Different type of aerosols and UV-B
radiation D. S. Balis et al. Title Page Abstract Introduction Conclusions References Tables Figures J I J I Back Close
Full Screen / Esc
Print Version Interactive Discussion
© EGU 2003
2.2. Modeling tools
In this study, the tropospheric Ultraviolet and Visible model (TUV) (Madronich, 1993) version 4.0 using the radiation transfer solver pseudospherical DISORT (Stamnes et al., 1988) was run using 16 streams. Irradiance spectra were calculated in 0.015 nm steps and then they were convoluted with the slit function of the Brewer and sampled
5
at intervals of 0.5 nm to match the measurements. By comparing the modelled spectra with the measured ones the effective single scattering albedo was determined using an iterative methodology proposed recently by Bais et al. (2002, 2003).
For the theoretical determination of the aerosol optical properties that are relevant to the transmission of the UV-B radiation through the atmosphere we used the software
10
OPAC (Optical Properties of Aerosols and Clouds) (Hess et al., 1998), which provides optical properties in the solar and terrestrial spectral range of atmospheric particulate matter. Microphysical and optical properties of 6 water clouds, three ice clouds and 10 aerosol types are considered as typical cases. The optical properties of the aerosol particles considered in this study were the extinction, scattering and absorption coe
ffi-15
cients, the single scattering albedo and the lidar ratio at 355 nm. These are calculated on the basis of the microphysical data (size distribution and spectral refractive index) under the assumption of spherical particles in case of aerosols.
2.3. Methodology for the estimation of the SSA
To derive estimates of the effective SSA at cloud-free days with different aerosol
condi-20
tions we used measured spectral irradiances and aerosol optical depth at the stations of Thessaloniki and Lindenberg. Measurements of global and diffuse (the latter avail-able only at Thessaloniki) irradiance and of direct-to-diffuse irradiances ratio were com-pared with model calculations, which were based on the actually measured total ozone column and aerosol optical depth. From these comparisons we determined the values
25
of SSA for which the model and the measurements were in agreement of better than 1%. Depending on the sensitivity of each quantity to changes in SSA, more than one
ACPD
3, 4671–4700, 2003
Different type of aerosols and UV-B
radiation D. S. Balis et al. Title Page Abstract Introduction Conclusions References Tables Figures J I J I Back Close
Full Screen / Esc
Print Version Interactive Discussion
© EGU 2003
value of the SSA may satisfy the above condition. It was considered meaningless to assume a higher precision than 0.01 for the SSA. It appears that all three methods give less uncertain results in cases with high aerosol contents. The individual uncertainties of the measurements, modeling and aerosol optical depth determination contribute to the overall uncertainty in determining the single scattering albedo. An estimate of the
5
achievable accuracy is about 0.1 of SSA for high aerosol optical depths (AOD>0.5 at 355 nm) and about 0.2 for low aerosol conditions (AOD<0.2) (Bais et al., 2003). This fact imposes some limitations to the use of such methods of indirect determination of SSA under low aerosol conditions.
3. Results and discussion
10
3.1. Comparison between model calculations and UV irradiance measurements. The importance of the single scattering albedo
All spectral measurements performed at Thessaloniki during the days when lidar mea-surements were available, were compared with model calculations using as input the total ozone measured by the Brewer spectrophotometer and the aerosol optical depth
15
at 355 nm measured with the Brewer (Marenco et al., 1997) while the shape of the aerosol extinction profile was adopted by the nearest in time lidar profile, assuming that there are background aerosol conditions in the stratosphere. For the selection of the single scattering albedo (SSA) a pre-calculated value of 0.8 was used initially, corresponding to a realistic assumption concerning the microphysical properties of the
20
aerosols of an urban site (Shettle and Fenn, 1979). In total we calculated the erythemal irradiance for various zenith angles for 35 clear sky days during the years 2000–2001. The resulting ratios of the measurements of the erythemal irradiance over the calcula-tions were binned over 5◦ solar zenith angle intervals. These average ratios and their respective standard deviations are shown in Fig. 1. As it is clear from this figure the
25
depen-ACPD
3, 4671–4700, 2003
Different type of aerosols and UV-B
radiation D. S. Balis et al. Title Page Abstract Introduction Conclusions References Tables Figures J I J I Back Close
Full Screen / Esc
Print Version Interactive Discussion
© EGU 2003
dence, since the pseudospherical DISORT was used for the model calculations. This mean ratio indicates that in general the model simulates well the measured UV irradi-ance, when total ozone and aerosol optical depth are accurately known. However, as it is indicated from the standard deviation of the ratios, the uncertainty in the choice of the appropriate SSA value introduces maximum differences of about 20% for
indi-5
vidual simulations performed for all the clear sky days during EARLINET when both UV and lidar measurements were available. This uncertainty is significant and limits our ability to use a radiative transfer model for the interpretation of the UV measure-ments for an area that can be influenced from various aerosol sources and aerosol types. Thessaloniki is a crossroad where aerosol can be transported form Central and
10
Eastern Europe (e.g. Eisinger and Burrows, 1998; Zerefos et al., 2000), from the At-lantic Ocean, from the Western Mediterranean and from the Sahara desert (e.g. Balis et al., 2003; Lelieveld et al., 2002). For this reason we applied in this paper an indirect method for estimating the single scattering albedo, which has already been described in the previous section.
15
3.2. Verification of the methodology for the estimation of the SSA using LACE98 data We applied the iterative procedure for the indirect determination of the single scattering albedo on a case extracted from the LACE98 experiment (Ansmann et al., 2002). We used global irradiance measurements performed with a single Brewer at Lindenberg and aerosol optical depth measurements at 399 nm performed with a sunphotometer
20
during 10 August 1998, a cloud free day. Additional measurements performed on that day allow the justification of the estimated SSA values. In Fig. 2a we show the appli-cation of the method on the measurements of that day. As it is evident from that figure there is variability during the day in the values of SSA that give ratios close to 1. In the morning hours the method indicates values larger than 0.9 while in the afternoon
25
the SSA values decrease even down to 0.6. This change indicates the presence of different type of aerosols above the measuring site between the morning and the after-noon hours, when more absorbing aerosols are expected to be present. As described
ACPD
3, 4671–4700, 2003
Different type of aerosols and UV-B
radiation D. S. Balis et al. Title Page Abstract Introduction Conclusions References Tables Figures J I J I Back Close
Full Screen / Esc
Print Version Interactive Discussion
© EGU 2003
in Ansmann et al. (2002) the flow was from the north during most of that day with low aerosol optical depth values, while in the late afternoon the winds changed to east and southeast advecting air from the polluted western and southwestern parts of Europe. The existence of different aerosol layers in the afternoon hours relative to the morning hours observed with the MPI-UV lidar is shown in Fig. 2b is associated with the wind
5
change and provides further indication that the aerosol type has changed over the measuring site. Aerosols from polluted (urban) regions are more absorbing in the UV (e.g. Shettle and Fenn, 1979) and therefore smaller values of the SSA are expected. The estimated SSA values are consistent with this change in the meteorological situ-ation and the source regions. The estimated change of the SSA during the day, using
10
the Brewer measurements along with model calculations, is confirmed by independent observations and estimates. Bundke et al. (2002) show time series of SSA for the whole LACE98 period, based on two approaches, the one is based on PSAP absorp-tion measurements and nephelometer measurements and the second one is based on photometer measurements using the inversion algorithm by Haenel et al. (1994). The
15
second set agrees well with our estimates, i.e. SSA values 0.85 in the morning and 0.7 in the afternoon. The other technique reports small SSA values throughout the day, possibly because it is affected mostly by the aerosols close to the Earth’s surface. Hoyningen-Huene et al. (2001) report for the same day an SSA value of 0.92 to 0.85 depending on the methodology used.
20
3.3. Cases studies with different aerosol types
Beneath the available UV and lidar measurements at Thessaloniki we identified some clear sky cases that allow to quantify the effect of the different aerosol properties on the solar UV at the Earth’s surface. For this purpose we used the total ozone mea-surements and aerosol optical depth meamea-surements performed with the double Brewer
25
spectroradiometer, the estimated SSA, profiles of the aerosol extinction coefficient and the lidar ratio, and backward trajectories. Since the Raman lidar measurements are performed only after sunset we examined here only spectral measurements
per-ACPD
3, 4671–4700, 2003
Different type of aerosols and UV-B
radiation D. S. Balis et al. Title Page Abstract Introduction Conclusions References Tables Figures J I J I Back Close
Full Screen / Esc
Print Version Interactive Discussion
© EGU 2003
formed during late afternoon hours in order to minimize the time difference between the two measurements. Comparisons were performed between measurements that corresponded to the same solar zenith angle.
From all the available spectral UV measurements we selected three cases to study in more detail, which, according to the aerosol lidar measurements and to the
trajec-5
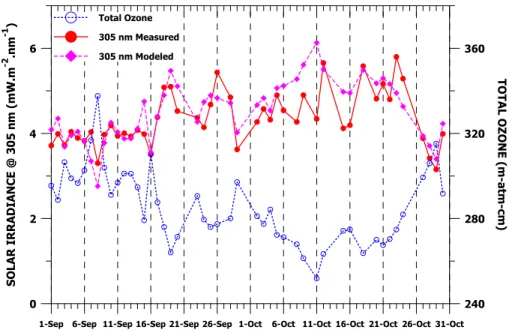
tory analysis, corresponded to distinct aerosol conditions. These three cases were selected from the period September–October 2001. Figure 3 presents the total ozone measurements and the measurements of the global irradiance at 305 nm for the period of these two months. At this wavelength the absorption by ozone is very strong with a Radiation Amplification Factor (RAF) of about 3 (Bais et al., 1993) while the accuracy
10
of the measurements is better than 5%. The solid circles show the measured values of the UV irradiance, while the diamonds show the modeled values considering only the effect of ozone absorption in the calculations. The differences between the two curves show the effect of the aerosols on the attenuation of the UV irradiance at the surface. It is evident from this figure that day-to-day changes in the aerosol optical
15
properties can cause changes in the UV of similar magnitude with those induced from the variability in the total ozone column. As shown in the figure this effect is on the average about 4% but there are days when the aerosol effect can reach almost 30%. Kylling et al. (1998) found similar cases in spectral UV measurements performed on a remote island in the Northern Aegean Sea during the PAUR experiment that took place
20
in 1996. Balis et al. (2002) showed that under certain aerosol conditions (high load of absorbing aerosols and high values of tropospheric ozone) a decrease of 50 DU in total ozone can even lead to a decrease in UV radiation. From this two-month period we will present in more detail the following three cases, because according to the trajectories they allow a distinct characterization of the air masses present over the measuring site:
25
– Case 1: A Saharan dust event versus a clean (low) aerosol case with (25
Septem-ber 2001 versus 17 SeptemSeptem-ber 2001),
ACPD
3, 4671–4700, 2003
Different type of aerosols and UV-B
radiation D. S. Balis et al. Title Page Abstract Introduction Conclusions References Tables Figures J I J I Back Close
Full Screen / Esc
Print Version Interactive Discussion
© EGU 2003
different lidar ratio and UV irradiance (13 September 2001 versus 29 October 2001),
– Case 3: A pollution episode, where the total ozone decline is accompanied by a
decrease in UV irradiance, compared with a clean case (11 October 2001 versus 4 October 2001).
5
3.3.1. Case 1
Coordinated lidar measurements of Saharan dust particles were very frequent during the EARLINET project (Papayannis et al., 2003) and provided detailed information con-cerning the characteristics and evolution of such events. Many of these events reached also Thessaloniki, however during few of them clear sky UV observations were also
10
possible. According to theoretical calculations by Ackermann et al. (1998) desert dust particles are characterized by LR of about 40 sr. Because the particles are not hygro-scopic, the lidar ratio is not very sensitive to changes in relative to humidity. Mattis et al. (2002) presented lidar ratio profiles at both 355 nm and 532 nm corresponding to Saharan dust indicating that also larger lidar ratio values can be expected by a
com-15
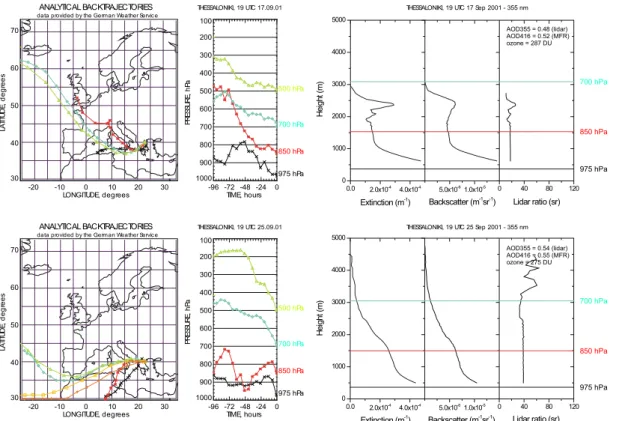
bined effect of long range transport and non-spherical shape of the dust particles. As it is evident from the trajectory analysis in Fig. 4 on 25 September the air masses be-tween 850 hPa and 500 hPa originated from the Sahara desert. As a consequence the profile of the lidar ratio is uniform in this layer with values slightly exceeding 30 sr, which are rather consistent with the theoretical estimations. The Saharan dust particles show
20
larger absorption in the UV (e.g. Balis et al., 2002; di Sarra et al., 2002) and therefore can attenuate the UV radiation reaching the Earth’s surface. We compared the UV irradiance at 305 nm with the measurements performed on 17 September 2001 when ozone levels were similar but according to the trajectory analysis, also shown in Fig. 5, the particles present above the measuring site must have resulted from a mixture of
25
maritime and continental aerosols, which lead to small lidar ratio values of about 20 sr, that indicate low absorbing particles. The UV irradiance during the Sahara dust event
ACPD
3, 4671–4700, 2003
Different type of aerosols and UV-B
radiation D. S. Balis et al. Title Page Abstract Introduction Conclusions References Tables Figures J I J I Back Close
Full Screen / Esc
Print Version Interactive Discussion
© EGU 2003
is almost 5% lower than the one during the other day, after removing the contribution to the difference that are attributed to the small total ozone difference between these two days. The estimated SSA values are 0.83 and 0.89, respectively, which is consistent with the lidar ratio profiles and the trajectory analysis.
3.3.2. Case 2
5
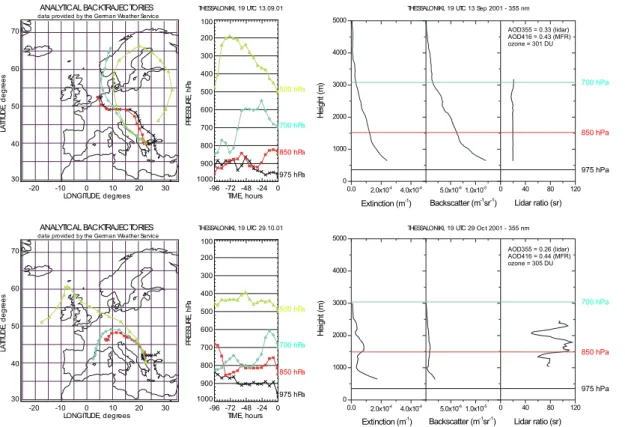
The interesting feature of case 12 is that both total ozone and aerosol optical depth were almost the same during these measurement periods, however, under clear sky conditions the UV levels differed by 10%. In Fig. 5 the extinction and lidar ratio profiles for both days are presented. As it is shown in this figure the profile of the aerosol extinction coefficient as measured with the Raman lidar, the aerosol optical depth and
10
the total ozone amount is similar. However there are large differences in the profile of the lidar ratio, indicating that the microphysical parameters of the aerosol present above the measuring site are different between these two days. On 13 September the profile of the lidar ratio above 800 m showed values of about 20 sr which correspond to maritime particles (e.g. Ackerman et al., 1998), as it is confirmed by the trajectories
15
analysis for that day. On the 29th of October the lidar ratio values were larger than 70 indicating the presence of more absorbing aerosols, originating from central and NE Europe. This difference is demonstrated also in the levels of the UV-B irradiance, since the day with small lidar ratio the UV-B levels were higher. The estimated SSA values for these two days are shown in Table 1 and are, respectively, 0.77 and 0.87 indicating
20
more absorbing aerosols during the day with maritime particles, which is not consistent with the lidar ratio measurements. We have to emphasize here that the mean lidar ratio, due to the system’s overlap function, does not take into account the first 800 m, while the effective SSA is heavily influenced from this layer, which contains most of the aerosol that originates from urban activities, and thus under polluted conditions
25
at the surface, these two parameters might not represent similar aerosol conditions. In addition according to Ferrare et al. (1998) differences in relative humidity of 20% can introduce an increase of about 0.1 in SSA, so this inconsistency could also be
ACPD
3, 4671–4700, 2003
Different type of aerosols and UV-B
radiation D. S. Balis et al. Title Page Abstract Introduction Conclusions References Tables Figures J I J I Back Close
Full Screen / Esc
Print Version Interactive Discussion
© EGU 2003
attributed to different humidity conditions. 3.3.3. Case 3
The 11 October was characterized by low total ozone values (252 DU) and high aerosol optical depth, as can be seen in Fig. 6. According to the trajectories the air masses within the 0–3 km layer were of rather local origin and thus affected from local pollution
5
sources. On the 4th of October total ozone was higher, while close to the surface the meteorological situation was similar, but the aerosol optical depth was much smaller. The lidar ratio values measured were relatively high (> 60 sr) and can be attributed to aerosols originating from polluted regions in both cases. Also the estimated values of the SSA for both days (0.85) are similar. Although total ozone was lower on 11
10
October compared to 4 October the UV irradiance at 305 nm was almost identical, which means that the high aerosol optical depth observed during this day causes a reduction of about 30% in UV irradiance, which masks the increase in the UV irradiance expected due to the decrease of about 30 DU in total ozone (about 10% decrease). The existence of such cases in polluted urban regions can be very frequent and therefore
15
their knowledge is very important for correct interpretation of UV trends in such regions (e.g. Zerefos et al., 1998). The main results of these three cases are summarized in Table 1.
3.4. Relation between lidar ratio and effective single scattering albedo
The three cases discussed above made it possible to quantify the effect of a certain
20
type of aerosols on the UV irradiance but it also left many uncertainties about the consistency between the measured lidar ratio profiles and the estimated SSA values. Therefore selected clear sky spectral measurements of global and diffuse irradiance and of direct-to-diffuse irradiance ratio from the days considered in Fig. 1 were com-pared with model calculations, which were based on the actually measured total ozone
25
ACPD
3, 4671–4700, 2003
Different type of aerosols and UV-B
radiation D. S. Balis et al. Title Page Abstract Introduction Conclusions References Tables Figures J I J I Back Close
Full Screen / Esc
Print Version Interactive Discussion
© EGU 2003
of SSA for which the model and the measurements were in agreement of better than 1%. As discussed before the mean of the values that satisfied the above limit, was considered as the effective single-scattering albedo of the layer above the measuring site. For the same cases we calculated the mean lidar ratio as determined by the nearest in time measurement with the Raman lidar of LAP, for the 0.8–5 km layer. The
5
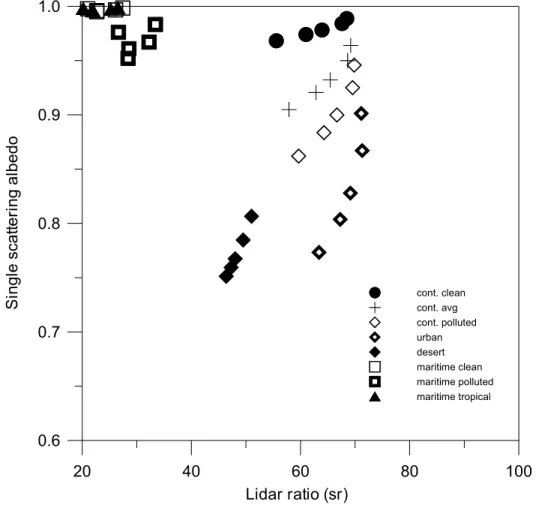
results refer to 18 cases and are shown in Fig. 7. For this purpose we also calculated with OPAC theoretical estimates for the SSA and the lidar ratio at 355 nm representa-tive for various aerosol models and relarepresenta-tive humidity classes. These calculations are demonstrated in Fig. 8. From both figures it is evident that similar SSA or LR values can correspond to different aerosol types. However the simultaneous knowledge of
10
both parameters improves our ability to characterize the aerosol type. For instance SSA values of 0.9 can correspond to both maritime and continental aerosols, which however have different LR values. Similarly urban and continental aerosols might have similar LR values but different SSA values. The comparison of the two figures indicates that the experimental determination of the SSA and the lidar ratio are consistent with
15
the OPAC estimations for the case of maritime and continental aerosols highlighted in the figure. This has been verified by checking the backward trajectories also shown in Fig. 7, and allows a better characterization of this aerosol. For these cases the esti-mated SSA values are slightly lower from the theoretical ones indicating a small impact of the aerosol near the surface. According to the trajectories these cases include also
20
events with desert particles, which however are mixed with maritime aerosols from the Mediterranean. There is a group of points in Fig. 7 that according to the estimated SSA should be representative of urban aerosols, but they correspond to relatively low lidar ratio values, which can be found for maritime particles. The latter is consistent with the trajectories that correspond to these points. When examining the profiles of
25
the backscattering coefficient at 532 nm, which can be used from 400 m upward, they indicate that for these cases the aerosol loading closer to the surface is much higher compared to the well defined cases, but unfortunately no lidar ratio values can be cal-culated for this altitude range. The high aerosol load close to the surface is usually
ACPD
3, 4671–4700, 2003
Different type of aerosols and UV-B
radiation D. S. Balis et al. Title Page Abstract Introduction Conclusions References Tables Figures J I J I Back Close
Full Screen / Esc
Print Version Interactive Discussion
© EGU 2003
associated with urban activities and this fact can explain the low SSA values. It indi-cates that in case of vertical inhomogeneity of the aerosol type the effective SSA is not representative for the whole aerosol column. Similar studies performed by Ferrare et al. (1988) (using Raman lidar measurements and SSA estimations based on size distribution measurements concluded that higher SSA values correspond to lower lidar
5
ratios, however highly dependent on relative humidity and the real part of the refractive index. Asseng et al. (2003) estimated from aircraft measurements, during a Sahara dust event, profiles of the SSA at 542 nm, showing a strong vertical variability, low SSA values in the dust layer and higher SSA values above and below. Hensen et al. (2003), highlighted the importance of this variability in estimating the radiative forcing due to
10
aerosols.
4. Conclusions
The effect of different type of aerosols on the levels of UV irradiance at the Earth’s surface was examined using routine lidar measurements performed at Thessaloniki, Greece using a Raman lidar system, in the frame of the EARLINET project. For this
15
purpose we used spectral and broadband UV-B irradiance measurements, as well as total ozone observations, whenever lidar measurements were obtained.
A methodology for the indirect determination of the SSA, using spectral UV mea-surements has been verified with independent measurement during LACE98.
From the available measurements during EARLINET three cases that allowed
sep-20
arating the impact of the various parameters that control UV levels have been studied in detail. According to the analysis presented, the variability in optical depth and/or in aerosol type can introduce changes of the order of 10–25% in the UV irradiance, which can even mask changes expected from total ozone perturbations of the order of 30–50 DU.
25
It has been shown that the experimental determination of lidar ratio and the SSA are crucial for the interpretation of observed UV changes, especially for regions with highly
ACPD
3, 4671–4700, 2003
Different type of aerosols and UV-B
radiation D. S. Balis et al. Title Page Abstract Introduction Conclusions References Tables Figures J I J I Back Close
Full Screen / Esc
Print Version Interactive Discussion
© EGU 2003
variable aerosol conditions as it is the case in Northern Greece.
It has been demonstrated that the combined use of the estimated single scattering albedo and the measured extinction-to-backscatter ratio leads to a better characteri-zation of the aerosol type probed, in the case of homogeneous aerosol layers. This information can be further used as input to radiative transfer models. In case of high
5
aerosol load the estimated optical parameters at the Earth’s surface may not be repre-sentative for the whole aerosol column.
Acknowledgements. This work was conducted in the framework of the EARLINET project
EVR1-CT1999-40003 funded by the European Commission. Back trajectories for Thessaloniki were produced by the German Weather Service (DWD).
10
References
Ackermann, J.: The Extinction-to-Backscatter Ratio of Tropospheric Aerosol: A Numerical Study, J. Atmos. Oceanic Technol., 1043–1050, 1998.
Ansmann, A., Wandinger, U., Wiedensohler, M. A., and Leiterer, U.: Lindenberg Aerosol Char-acterization Experiment 1998: Overview, J. Geophys. Res., 107, 10.1029/2000JD000233,
15
2002.
Ansmann, A., Wandinger, U., Riebesell, M., Weitkamp, C., and Michaelis, W.: Independent measurement of extinction and backscatter profiles in cirrus clouds using a combined Raman elastic-backscatter lidar, Appl. Opt. 31, 7113, 1992.
Asseng, H., Fisher, J., and Ruhtz, Th.: Saharan Dust over Central Europe-Vertical profiles of
20
an event observed by airborne optical measurements, 1st EARLINET Symposium, Hamburg, 2003, (http://lidarb.dkrz.de/earlinet/earlisymp/posterlist.htm).
Bais, A. F., Kazantzidis, A., Kazadzis, S., Balis, D., Zerefos, C. S., and Meleti, C.: Effects of aerosol optical depth and single scattering albedo on surface UV irradiance, in Ultraviolet Ground- and Space-based Measurements, Models, and Effects, proceedings of SPIE, San
25
Diego 30 July–1 August 2001, 4482, 15–22, 2002.
Bais, A. F., Kazantzidis, A., Kazadzis, S., Balis, D., Zerefos, C. S., and Meleti, C.: Deriving an effective aerosol single scattering albedo from spectral surface UV irradiance measurements, submitted to Appl. Optics, 2003.
ACPD
3, 4671–4700, 2003
Different type of aerosols and UV-B
radiation D. S. Balis et al. Title Page Abstract Introduction Conclusions References Tables Figures J I J I Back Close
Full Screen / Esc
Print Version Interactive Discussion
© EGU 2003 Bais, A. F., Zerefos, C. S., Meleti, C., Ziomas, I. C., and Tourpali, K.: Spectral measurements of
solar UVB radiation and its relations to total ozone, SO2, and clouds, J. Geophys. Res., 98, 5199–5204, 1993.
Balis, D., Papayannis, A., Galani, E., Marenco, F., Santacesaria, V., Hamonou, E., Chazette, P., Ziomas, I., and Zerefos, C.: Tropospheric LIDAR Aerosol Measurements and Sun
Photomet-5
ric Observations at Thessaloniki, Greece, Atmospheric Environment, 34, 925–932, 2000. Balis, D. S., Zerefos, C. S., Kourtidis, K., Bais, A. F., Hofzumahaus, A., Kraus, A., Schmitt, R.,
Blumthaler, M., and Gobbi, G. P.: Measurements and modeling of photolysis rates during the PAUR II campaign, J. of Geophys. Res, 10.1029/2000JD000136, 2002.
Balis, D., Amiridis, V., Zerefos, C., Gerasopoulos, E., Andreae, M., Papayannis, A., and
10
Mamouri, R.-E.: Regional and long-range transported aerosols detected with a Raman lidar and filter radiometer measurements, 1st EARLINET Symposium, Hamburg, 2003 (http://lidarb.dkrz.de/earlinet/earlisymp/posterlist.htm).
B ¨osenberg, J., Ansmann, A., Baldasano, J., et al.: EARLINET: A European aerosol research lidar network, Advances in Laser Remote Sensing, 20th ILRC, (eds. A. Dabas, J. Pelon and
15
P. Flamant), 155–158, 2001.
Br ¨uhl, C. and Crutzen, P.: On the disproportionate role of tropospheric ozone as a filter against solar UV-B radiation, Geophys. Res. Lett., 16, 703–706, 1989.
Bundke, U., Haenel, G., Horvath, H., Kaller, W., Seidl, S., Wex, H., Wiedensohler, A., Wiegner, M., and Freudenthaler, V.: Aerosol optical properties during the LACE 98,
20
10.1029/2000JD000202, 2002.
Eisinger, M. and Burrows, J. P.: Tropospheric sulfur dioxide observed by the ERS-2 GOME instrument, Geophys.Res. Lett., 25, 22, 4177–4180, 1998.
Ferrare, R., Melfi, S. H., Whiteman, D. N., Evans, K. D., Poellot, M., and Kaufman, Y. J.: Raman lidar measurements of aerosol extinction and backscattering, 2 Derivation of aerosol real
25
refractive index, single-scattering albedo, and humidification factor using Raman lidar and aircraft size distribution measurements, J. Geophys. Res., 103, D16, 19 673–19 689, 1998. Haenel, G.: Optical properties of atmospheric particles: Complete sets obtained through polar
photometry and an improved inversion technique, Appl. Opt., 33, 7187–7199, 1994.
Hensen, A., Brink, H., Swart, D., Bergwerff, H., and Apituley, A.: Aerosols: Closure of the
30
radiation balance, 1st EARLINET Symposium, Hamburg, 2003 (http://lidarb.dkrz.de/earlinet/ earlisymp/posterlist.htm).
ACPD
3, 4671–4700, 2003
Different type of aerosols and UV-B
radiation D. S. Balis et al. Title Page Abstract Introduction Conclusions References Tables Figures J I J I Back Close
Full Screen / Esc
Print Version Interactive Discussion
© EGU 2003 package OPAC, Bull. Am. Met. Soc., 79, 831–844, 1998.
Hoyningen-Huene, W., Schmidt, T., Freitag, M., Waletrsdorf, M., and Roth, S.: Inidrekte Bestimmung der Single Scattering Albedo und des komplexen Brechungsindex des atmo-sph ¨arischen Aerosols aus kombinierten spektralen Sonnen- und Himmelsstrahlung- sowie spektralen Strahlungsflussmessungen und Ermittlung des Strahlungsantriebs, Final report
5
for FK07AF227/0, Bremen, Germany, 2001.
Kazantzidis, A., Balis, D. S., Bais, A. F., Kazadzis, S., Galani, E., Kosmidis, E., and Blumthaler, M.: Comparison of model calculations with spectral UV measurements during the SUSPEN campaign: the effect of aerosols, Journal of the Atm. Sciences, 58, 1529–1539, 2001. Kerr, J. B. and McElroy, C. T.: Evidence for large upward trends of ultraviolet-B radiation linked
10
to ozone depletion, Science, 262, 1032, 1993.
Lantz, K. O., Shetter, R. E., Cantrell, C. A., Flocke, S. J., Calvert, J. G., and Madronich, S.: Theoretical, actinometric and radiometric determinations of the photolysis rate coefficient of NO2 during the Mauna Loa Observatory Experiment 2, J. Geophys. Res., 101, 14 613– 14 629, 1996.
15
Leiterer, U., Weller, M., Urban, J., and Naebert, T.: Quality assurance of aerosol optical tchick-ness monitoring for the Lindenberg sunphotometer types BAS and ABAS, WMO TECO-1994, Instrum. and Obs. Methods Rep. 57, WMO/TD 588, 201–206, 1994.
Lelieveld, J., Berresheim, H., Borrmann, S. et al.: Global air pollution crossroads over the Mediterranean, Science, 298, 794–799, 2002.
20
Madronich, S.: The atmosphere and UV-B radiation at ground level, In: Environmental UV Photobiology, Plenum Press, New York, 1–39, 1993.
Matthias, V., Boeckmann, C., Freudenthaler, V., et al.: Lidar intercomparison on algorithm and system level in the frame of EARLINET, Max Planck Institut for Meteorology, Hamburg, Report no. 337, 2002.
25
Matthias. V.: Vertikalmessungen der Aerosolextinktion und des Ozons mit einem UV-Raman lidar, Dissertation, Univ. of Hamburg, Germany, 2000.
Marenco, F., Santacesaria, V., Bais, A., Balis, D., Di Sarra, A., Papayannis, A., and Zerefos, C. S.: Optical properties of tropospheric aerosols determined by lidar and spectrophotometric measurements (PAUR campaign), Appl. Opt., 36, 6875–6886, 1997.
30
Mayer, B., Seckmeyer, G., and Kylling, A.: Systematic longterm comparison of spectral UV measurements and UVSPEC modeling results, J. Geophys. Res., 102, D7, 8755–8768, 1997.
ACPD
3, 4671–4700, 2003
Different type of aerosols and UV-B
radiation D. S. Balis et al. Title Page Abstract Introduction Conclusions References Tables Figures J I J I Back Close
Full Screen / Esc
Print Version Interactive Discussion
© EGU 2003 Papayannis, A., Amoiridis, V., Baldasano, J., Balin, J., Balis, D., Boselli, A., Chaikovsky, A.,
Chatenet, B., Chourdakis, G., Freudenthaler, V., Frioux, M., Herman, J., Iarlori, M., Kreipl, S., Larcheveque, G., Matthey, R., Mattis,I., M ¨uller, D., Pandolfi, M., Pappalardo, G., Pelon, J., Perrone, M. R., Rizi, V., Rodriguez, A., Sauvage, L., Sobolewski, P., Spinelli, N., de Tomasi, F., Trickl, T., and Wiegner, M.: Continental-scale vertical profile measurements of free
tropo-5
spheric Saharan dust particles performed by a coordinated ground-based European Aerosol Research Lidar Network (EARLINET project), submitted to J. of Atm. Chem. and Physics, 2003.
Papayannis, A. and Balis, D.: Study of the structure of the lower troposphere over Athens using a backscattering Lidar during the MEDCAPHOT-TRACE experiment: Measurements over a
10
sub-urban area, Atmospheric Environment, 32, 12, 2161–2172, 1998.
Papayannis, A., Balis, D., Bais, A., van der Bergh, H., Calpini, B., Durieux, E., Fiorani, L., Jaquet, L., Ziomas, I., and Zerefos, C. S.: The role of urban and suburban aerosols on solar UV radiation over Athens, Greece, Atmospheric Environment, 32, 12, 2193–2201, 1998. Shetter, R. E., Cantrell, C. A., Lantz, K. O., Flocke, S. J., Orlando, J. J., Tyndall, G. S., Gilpin,
15
T. M., Fisher, C. A., Madronich, S., Calvert, J., and Junkerman, W.: Actinometric and radio-metric measurement and modeling of the photolysis rate coefficient of ozone to O(1
D) during during the Mauna Loa Observatory Experiment 2, J. Geophys. Res., 101, 14 631–14 641, 1996.
Shettle, E. P. and Fenn, R. W.: Models for the aerosols of the lower atmosphere and effects of
20
humidity variations on their optical properties, Air Force Geophys, Laboratory, Environmental Papers No. 676, 1979.
Stamnes, K., Tsay, S.-T., Wiscombe, W., and Jayaweera, K.: Numerically stable algorithm for discrete-ordinate-method radiative transfer in multiple scattering and emitting layered media, Appl. Opt. 27, 2502–2509, 1988.
25
Wandinger, U. and Ansmann, A.: Experimental Determination of the Lidar Overlap Profile with Raman Lidar, Appl. Opt. 41, 511, 2001.
WMO: Scientific Assessment of Stratospheric Ozone, WMO Ozone Research and Monitoring Project, Ozone Report No. 47, Geneva 2003.
WMO: Scientific Assessment of Stratospheric Ozone, WMO Ozone Research and Monitoring
30
Project, Ozone Report No. 44, Geneva 1998.
Zerefos, C. S., Balis, D., Tzortziou, M., Bais, A., Meleti, C., Bernhard, G., and Herman, J.: A Note on the Interannual Variations of UV-B erythemal doses and solar irradiance from
ACPD
3, 4671–4700, 2003
Different type of aerosols and UV-B
radiation D. S. Balis et al. Title Page Abstract Introduction Conclusions References Tables Figures J I J I Back Close
Full Screen / Esc
Print Version Interactive Discussion
© EGU 2003 ground-based and satellite observations, Ann. Geophysicae, 19, 115–120, 2001.
Zerefos, C. S., Ganev, K., Kourtidis, K., Tzortziou, M., Vasaras, A., and Syrakov, E.: On the origin of SO2 above Northern Greece, Geophys. Res. Lett., 27, 3, 365–368, 2000.
Zerefos, C. S., Meleti, C., Balis, D., Tourpali, K., and Bais, A. F.: Quasi-biennial and longer-term changes in clear sky UV-B solar irradiance, Geophys. Res. Lett., 25, 23, 4345–4348, 1998.
5
Zerefos, C. S., Balis, D. S., Bais, A. F., Gillotay, D., Simon, P. C., Mayer, B., and Seckmeyer, G.: Variability of UV-B at four stations in Europe, Geophys. Res. Lett., 24, 1363–1366, 1997.
ACPD
3, 4671–4700, 2003
Different type of aerosols and UV-B
radiation D. S. Balis et al. Title Page Abstract Introduction Conclusions References Tables Figures J I J I Back Close
Full Screen / Esc
Print Version Interactive Discussion
© EGU 2003
Table 1. Effective SSA and mean lidar ratio for cases selected from the EARLINET database
Date Remarks Ozone AOD Effective Mean UV
(DU) SSA LR (sr) attenuation
25 Sept 2001 Sahara Dust 275 0.55 0.83 30 5%
17 Sept 2001 Clean 287 0.52 0.89 10
13 Sept 2001 Same TOZ 301 0.43 0.77 10 10%
29 Sept 2001 Same AOD 305 0.44 0.87 80
11 Oct 2001 Local pollution 252 0.66 0.85 60 25%
ACPD
3, 4671–4700, 2003
Different type of aerosols and UV-B
radiation D. S. Balis et al. Title Page Abstract Introduction Conclusions References Tables Figures J I J I Back Close
Full Screen / Esc
Print Version Interactive Discussion
© EGU 2003 27
20 30 40 50 60 70 80 90
SOLAR ZENITH ANGLE (deg)
0.5 0.6 0.7 0.8 0.9 1.0 1.1 1.2 1.3 1.4 1.5 R A TI O MEASUREMENT/MODEL Thessaloniki
Average ratio from all EARLINET days
Figure 1.
ACPD
3, 4671–4700, 2003
Different type of aerosols and UV-B
radiation D. S. Balis et al. Title Page Abstract Introduction Conclusions References Tables Figures J I J I Back Close
Full Screen / Esc
Print Version Interactive Discussion © EGU 2003 28 4 5 6 7 8 9 10 11 12 13 14 15 16 17 TIME (U.T.) 0.7 0.8 0.9 1.0 1.1 1.2 1.3 MODEL/ BR EWER #07 8 (323nm) ssa=0.99 ssa=0.90 ssa=0.80 ssa=0.70 ssa=0.60 (a)
-1E-006 0 1E-006 2E-006 3E-006
Aerosol backscatter coefficient (m-1sr-1) at 320 nm 0 2000 4000 6000 8000 10000 A lti tu de (m) UT 07:57 08:46 10:45 12:40 15:25 20:30 Lindenberg 10-8-1998 (b)
Fig. 2. (a) Ratio of modeled to measured irradiance at 323 nm for 10 August 1998 at
Linden-berg Germany, for the SSA values indicated. (b) Daily evolution of the aerosol backscattering
ACPD
3, 4671–4700, 2003
Different type of aerosols and UV-B
radiation D. S. Balis et al. Title Page Abstract Introduction Conclusions References Tables Figures J I J I Back Close
Full Screen / Esc
Print Version Interactive Discussion
© EGU 2003
29
1-Sep 6-Sep 11-Sep 16-Sep 21-Sep 26-Sep 1-Oct 6-Oct 11-Oct 16-Oct 21-Oct 26-Oct 31-Oct 0 2 4 6 SO LAR IR RADIANCE @ 3 0 5 n m (mW.m -2 .nm -1 ) 240 280 320 360
TOTAL OZONE (m-atm-cm)
Total Ozone 305 nm Measured 305 nm Modeled
Figure 3
Fig. 3. Total ozone and global UV irradiance measurements at Thessaloniki, Greece for the
ACPD
3, 4671–4700, 2003
Different type of aerosols and UV-B
radiation D. S. Balis et al. Title Page Abstract Introduction Conclusions References Tables Figures J I J I Back Close
Full Screen / Esc
Print Version Interactive Discussion © EGU 2003 30 -20 -10 0 10 20 30 LONGITUDE, degrees 30 40 50 60 70 LA TI TU D E, d e g rees 1000 900 800 700 600 500 400 300 200 100 PR ES SU RE , h Pa -96 -72 -48 -24 0 TIME, hours ANALYTICAL BACKTRAJECTORIES
data provided by the German Weather Service
THESSALONIKI, 19 UTC 17.09.01 975 hPa 850 hPa 700 hPa 500 hPa -20 -10 0 10 20 30 LONGITUDE, degrees 30 40 50 60 70 LA TI TU D E, d e g rees 1000 900 800 700 600 500 400 300 200 100 PR ES SU RE , h Pa -96 -72 -48 -24 0 TIME, hours ANALYTICAL BACKTRAJECTORIES
data provided by the German Weather Service
THESSALONIKI, 19 UTC 25.09.01 975 hPa 850 hPa 700 hPa 500 hPa 0 1000 2000 3000 4000 5000 0.0 2.0x10⁻⁴ 4.0x10⁻⁴ 5.0x10-61.0x10-5 0 40 80 120 He ig ht (m )
Extinction (m-1) Backscatter (m-1sr-1) Lidar ratio (sr)
THESSALONIKI, 19 UTC 17 Sep 2001 - 355 nm AOD355 = 0.48 (lidar) AOD416 = 0.52 (MFR) ozone = 287 DU 850 hPa 700 hPa 975 hPa 0 1000 2000 3000 4000 5000 0.0 2.0x10⁻⁴ 4.0x10⁻⁴ 5.0x10-61.0x10-5 0 40 80 120 He ig ht (m )
Extinction (m-1) Backscatter (m-1sr-1) Lidar ratio (sr)
THESSALONIKI, 19 UTC 25 Sep 2001 - 355 nm AOD355 = 0.54 (lidar) AOD416 = 0.55 (MFR) ozone = 275 DU 850 hPa 975 hPa 700 hPa Figure 4
Fig. 4. Profiles of aerosol extinction coefficient, aerosol backscatter coefficient and lidar-ratio
measured at Thessaloniki with the corresponding backward air trajectories calculated from the DWD for 25 September 2001 and 17 September 2001.
ACPD
3, 4671–4700, 2003
Different type of aerosols and UV-B
radiation D. S. Balis et al. Title Page Abstract Introduction Conclusions References Tables Figures J I J I Back Close
Full Screen / Esc
Print Version Interactive Discussion © EGU 2003 31 -20 -10 0 10 20 30 LONGITUDE, degrees 30 40 50 60 70 LA TI TU D E, d eg rees 1000 900 800 700 600 500 400 300 200 100 PRES SU RE , h Pa -96 -72 -48 -24 0 TIME, hours ANALYTICAL BACKTRAJECTORIES
data provided by the German Weather Service
THESSALONIKI, 19 UTC 29.10.01 975 hPa 850 hPa 700 hPa 500 hPa -20 -10 0 10 20 30 LONGITUDE, degrees 30 40 50 60 70 LA TI TU D E, d eg re es 1000 900 800 700 600 500 400 300 200 100 PRES SU RE , h Pa -96 -72 -48 -24 0 TIME, hours ANALYTICAL BACKTRAJECTORIES
data provided by the German Weather Service
THESSALONIKI, 19 UTC 13.09.01 975 hPa 850 hPa 700 hPa 500 hPa 0 1000 2000 3000 4000 5000 0.0 2.0x10⁻⁴ 4.0x10⁻⁴ 5.0x10-61.0x10-5 0 40 80 120 He ig ht (m )
Extinction (m-1) Backscatter (m-1sr-1) Lidar ratio (sr)
THESSALONIKI, 19 UTC 29 Oct 2001 - 355 nm AOD355 = 0.26 (lidar) AOD416 = 0.44 (MFR) ozone = 305 DU 850 hPa 700 hPa 975 hPa 0 1000 2000 3000 4000 5000 0.0 2.0x10⁻⁴ 4.0x10⁻⁴ 5.0x10-61.0x10-5 0 40 80 120 Extinction (m-1) H ei ght (m )
Backscatter (m-1sr-1) Lidar ratio (sr)
THESSALONIKI, 19 UTC 13 Sep 2001 - 355 nm AOD355 = 0.33 (lidar) AOD416 = 0.43 (MFR) ozone = 301 DU 850 hPa 700 hPa 975 hPa Figure 5
ACPD
3, 4671–4700, 2003
Different type of aerosols and UV-B
radiation D. S. Balis et al. Title Page Abstract Introduction Conclusions References Tables Figures J I J I Back Close
Full Screen / Esc
Print Version Interactive Discussion © EGU 2003 32 -20 -10 0 10 20 30 LONGITUDE, degrees 30 40 50 60 70 LA TIT U D E, d e g rees 1000 900 800 700 600 500 400 300 200 100 PR ES SU RE , h Pa -96 -72 -48 -24 0 TIME, hours ANALYTICAL BACKTRAJECTORIES
data provided by the German Weather Service
THESSALONIKI, 19 UTC 11.10.01 975 hPa 850 hPa 700 hPa 500 hPa -20 -10 0 10 20 30 LONGITUDE, degrees 30 40 50 60 70 LA TI TU D E, de gr e e s 1000 900 800 700 600 500 400 300 200 100 PRES SU RE , h Pa -96 -72 -48 -24 0 TIME, hours ANALYTICAL BACKTRAJECTORIES
data provided by the German Weather Service
THESSALONIKI, 19 UTC 04.10.01 975 hPa 850 hPa 700 hPa 500 hPa 0 1000 2000 3000 4000 5000 0.0 2.0x10⁻⁴ 4.0x10⁻⁴ 5.0x10-61.0x10-5 0 40 80 120 Extinction (m-1) He ig ht (m )
Backscatter (m-1sr-1) Lidar ratio (sr)
850 hPa 700 hPa
THESSALONIKI, 19 UTC 11 Oct 2001 - 355 nm AOD355 = 0.75 (lidar) AOD416 = 0.66 (MFR) ozone = 252 DU 975 hPa 0 1000 2000 3000 4000 5000 0.0 2.0x10⁻⁴ 4.0x10⁻⁴ 5.0x10-61.0x10-5 0 40 80 120 Lidar ratio (sr) Backscatter (m-1sr-1) Extinction (m-1) H ei ght (m ) 850 hPa 700 hPa
THESSALONIKI, 19 UTC 04 Oct 2001 - 355 nm AOD355 = 0.30 (lidar) AOD416 = 0.33 (MFR) ozone = 284 DU
975 hPa
Figure 6
ACPD
3, 4671–4700, 2003
Different type of aerosols and UV-B
radiation D. S. Balis et al. Title Page Abstract Introduction Conclusions References Tables Figures J I J I Back Close
Full Screen / Esc
Print Version Interactive Discussion © EGU 2003 33 -20 -10 0 10 20 30 LONGITUDE, degrees 30 40 50 60 70 LA TI TU D E, d eg rees ANALYTICAL BACKTRAJECTORIES
data provided by the German Weather Service
-20 -10 0 10 20 30 LONGITUDE, degrees 30 40 50 60 70 LA TI TU D E, d eg rees ANALYTICAL BACKTRAJECTORIES
data provided by the German Weather Service
-20 -10 0 10 20 30 LONGITUDE, degrees 30 40 50 60 70 LA TI TU D E, d eg rees ANALYTICAL BACKTRAJECTORIES
data provided by the German Weather Service
-20 -10 0 10 20 30 LONGITUDE, degrees 30 40 50 60 70 LA TI TU D E, d eg rees ANALYTICAL BACKTRAJECTORIES
data provided by the German Weather Service
-20 -10 0 10 20 30 LONGITUDE, degrees 30 40 50 60 70 LA TI TU D E, d eg rees ANALYTICAL BACKTRAJECTORIES
data provided by the German Weather Service
-20 -10 0 10 20 30 LONGITUDE, degrees 30 40 50 60 70 LA TI TU D E, d eg rees ANALYTICAL BACKTRAJECTORIES
data provided by the German Weather Service
975 h Pa 8 50 h Pa 70 0 h Pa 50 0 h Pa -20 -10 0 10 20 30 LONGITUDE, degrees 30 40 50 60 70 LA TI TU D E, d eg re e s ANALYTICAL BACKTRAJECTORIES
data provided by the German Weather Service
-20 -10 0 10 20 30 LONGITUDE, degrees 30 40 50 60 70 LA TI TU D E, d eg re e s ANALYTICAL BACKTRAJECTORIES
data provided by the German Weather Service
-20 -10 0 10 20 30 LONGITUDE, degrees 30 40 50 60 70 LA TI TU D E, d eg re e s ANALYTICAL BACKTRAJECTORIES
data provided by the German Weather Service
-20 -10 0 10 20 30 LONGITUDE, degrees 30 40 50 60 70 LA TI TU D E, d eg re e s ANALYTICAL BACKTRAJECTORIES
data provided by the German Weather Service
-20 -10 0 10 20 30 LONGITUDE, degrees 30 40 50 60 70 LA TI TU D E, d eg re e s ANALYTICAL BACKTRAJECTORIES
data provided by the German Weather Service
-20 -10 0 10 20 30 LONGITUDE, degrees 30 40 50 60 70 LA TI TU D E, d eg re e s ANALYTICAL BACKTRAJECTORIES
data provided by the German Weather Service
975 h Pa 850 h Pa 7 00 h Pa 5 00 h Pa -20 -10 0 10 20 30 LONGITUDE, degrees 30 40 50 60 70 LA TI TU D E, d e g rees ANALYTICAL BACKTRAJECTORIES
data provided by the German Weather Service
-20 -10 0 10 20 30 LONGITUDE, degrees 30 40 50 60 70 LA TI TU D E, d e g rees ANALYTICAL BACKTRAJECTORIES
data provided by the German Weather Service
-20 -10 0 10 20 30 LONGITUDE, degrees 30 40 50 60 70 LA TI TU D E, d e g rees ANALYTICAL BACKTRAJECTORIES
data provided by the German Weather Service
-20 -10 0 10 20 30 LONGITUDE, degrees 30 40 50 60 70 LA TI TU D E, d e g rees ANALYTICAL BACKTRAJECTORIES
data provided by the German Weather Service
975 h Pa 8 50 h Pa 70 0 h Pa 50 0 h Pa 0 10 20 30 40 50 60 70 80 90 100 110 120 0.60 0.65 0.70 0.75 0.80 0.85 0.90 0.95 1.00 S in gl e S cat te ring A lbed o Lidar Ratio (sr) Continental Maritime Figure 7 Fig. 7. Lidar ratio versus single scattering albedo as determined by measurements together
ACPD
3, 4671–4700, 2003
Different type of aerosols and UV-B
radiation D. S. Balis et al. Title Page Abstract Introduction Conclusions References Tables Figures J I J I Back Close
Full Screen / Esc
Print Version Interactive Discussion © EGU 2003 34 20 40 60 80 100 Lidar ratio (sr) 0.6 0.7 0.8 0.9 1.0 S ingl e s cat te ri ng al bedo cont. clean cont. avg cont. polluted urban desert maritime clean maritime polluted maritime tropical