HAL Id: inserm-00840268
https://www.hal.inserm.fr/inserm-00840268
Submitted on 2 Jul 2013
HAL is a multi-disciplinary open access
archive for the deposit and dissemination of
sci-entific research documents, whether they are
pub-lished or not. The documents may come from
teaching and research institutions in France or
abroad, or from public or private research centers.
L’archive ouverte pluridisciplinaire HAL, est
destinée au dépôt et à la diffusion de documents
scientifiques de niveau recherche, publiés ou non,
émanant des établissements d’enseignement et de
recherche français ou étrangers, des laboratoires
publics ou privés.
multiple myeloma, delays growth and induces mature
plasma cell markers in malignant plasma cells.
Alboukadel Kassambara, Matthieu Schoenhals, Jérôme Moreaux, Jean-Luc
Veyrune, Thierry Rème, Hartmut Goldschmidt, Dirk Hose, Bernard Klein
To cite this version:
Alboukadel Kassambara, Matthieu Schoenhals, Jérôme Moreaux, Jean-Luc Veyrune, Thierry Rème,
et al.. Inhibition of DEPDC1A, a bad prognostic marker in multiple myeloma, delays growth and
induces mature plasma cell markers in malignant plasma cells.. PLoS ONE, Public Library of Science,
2013, 8 (4), pp.e62752. �10.1371/journal.pone.0062752�. �inserm-00840268�
Multiple Myeloma, Delays Growth and Induces Mature
Plasma Cell Markers in Malignant Plasma Cells
Alboukadel Kassambara1, Matthieu Schoenhals1, Je´roˆme Moreaux2, Jean-Luc Veyrune2, Thierry Re`me1, Hartmut Goldschmidt3, Dirk Hose3, Bernard Klein1,2,4*
1 INSERM, U1040, Montpellier, France, 2 CHU Montpellier, Institute of Research in Biotherapy, Montpellier, France, 3 Medizinische Klinik V, Universita¨tsklinikum Heidelberg and Nationales Centrum fu¨r Tumorerkrankungen, Heidelberg, Germany,4 Universite´ MONTPELLIER1, UFR Me´decine, Montpellier, France
Abstract
High throughput DNA microarray has made it possible to outline genes whose expression in malignant plasma cells is associated with short overall survival of patients with Multiple Myeloma (MM). A further step is to elucidate the mechanisms encoded by these genes yielding to drug resistance and/or patients’ short survival. We focus here on the biological role of the DEP (for Disheveled, EGL-10, Pleckstrin) domain contained protein 1A (DEPDC1A), a poorly known protein encoded by DEPDC1A gene, whose high expression in malignant plasma cells is associated with short survival of patients. Using conditional lentiviral vector delivery of DEPDC1A shRNA, we report that DEPDC1A knockdown delayed the growth of human myeloma cell lines (HMCLs), with a block in G2 phase of the cell cycle, p53 phosphorylation and stabilization, and p21Cip1 accumulation. DEPDC1A knockdown also resulted in increased expression of mature plasma cell markers, including CXCR4, IL6-R and CD38. Thus DEPDC1A could contribute to the plasmablast features of MMCs found in some patients with adverse prognosis, blocking the differentiation of malignant plasma cells and promoting cell cycle.
Citation: Kassambara A, Schoenhals M, Moreaux J, Veyrune J-L, Re`me T, et al. (2013) Inhibition of DEPDC1A, a Bad Prognostic Marker in Multiple Myeloma, Delays Growth and Induces Mature Plasma Cell Markers in Malignant Plasma Cells. PLoS ONE 8(4): e62752. doi:10.1371/journal.pone.0062752
Editor: Paul J. Galardy, Mayo Clinic, United States of America
Received July 18, 2012; Accepted March 26, 2013; Published April 30, 2013
Copyright: ß 2013 Kassambara et al. This is an open-access article distributed under the terms of the Creative Commons Attribution License, which permits unrestricted use, distribution, and reproduction in any medium, provided the original author and source are credited.
Funding: This work was supported by grants from ARC (SL220110603450, Paris France), the European Community (FP7-OVERMYR), the Tumorzentrum Heidelberg/Mannheim, Germany, and the Deutsche Krebshilfe, Bonn, Germany, the Deutsche Forschungsgemeinschaft, Transregio TRR79, Bonn, Germany. The funders had no role in study design, data collection and analysis, decision to publish, or preparation of the manuscript.
Competing Interests: The authors have declared that no competing interests exist. * E-mail: bernard.klein@inserm.fr
Introduction
Multiple myeloma (MM) is a heterogeneous clonal plasma-cell disorder in terms of molecular abnormalities, proliferation, and differentiation. Multiple myeloma cells (MMCs) from almost all patients harbor chromosomal abnormalities detected by iFISH [1] and at least 7 molecular groups have been identified in previously-untreated patients using high throughput gene expression profiling [2]. Numerous genes whose expressions in MMCs are associated with adverse or good prognosis have been identified and used to build gene expression-based prognostic scores [3,4,5,6,7,8,9]. Some of these genes encode for proteins involved in DNA replication, repair and recombination, as it is the case in other cancers [10,11,12,13].
Whereas a majority of recent studies concur to indicate that the myeloma progenitor cell, able to form colonies in semi-solid culture medium vitro or tumors in animal models, express plasma cell markers (lack of CD20 et expression of CD138) [14,15,16], it is well recognized that MMCs in patients with poor prognosis are less differentiated than normal bone marrow plasma cells expressing plasmablast cytological markers, and secreting lower levels of Ig [17]. We report here that the DEPDC1A protein – for DEP (for Disheveled, EGL-10, Pleckstrin) domain contained protein 1A – could be involved in this undifferentiated stage of
MMCs in some patients. The biological function of DEPDC1A is poorly known, with only 4 published reports showing it is a bad prognostic factor in patients with bladder, breast or lung cancers [18,19,20]. In addition, a knockdown of DEPDC1A inhibited growth of bladder cancer cell line [21].
We report here that DEPDC1A gene expression in MMCs of previously-untreated patients with MM is associated with adverse prognosis, and that DEPDC1A knockdown induces growth retardation and overexpression of genes coding for mature plasma cell markers in multiple myeloma cell lines.
Results
Increased Expression of DEPDC1A Gene in Multiple Myeloma Cells Compared to Normal Bone Marrow Plasma Cells in Association with a Poor Prognosis
DEPDC1A gene expression was significantly increased (P = .001) in MMCs of previously-untreated patients compared to normal BMPCs and in HMCLs compared to primary MMCs (Figure 1A). Affymetrix data (probe set 222958_s_at) were validated by real time RT-PCR (P = .005, Supplementary Figure S1A). A high DEPDC1A expression could predict for shorter overall survival in 2 independent large cohorts of previously-untreated patients. Using Maxstat R function, 22% of the patients of UAMS-TT2 cohort
with the highest DEPDC1A expression had an overall survival of 56 months versus not reached in the remaining patients (Figure 1B, P,.001). Twelve % of the patients of the HM cohort with high DEPDC1A expression had an overall survival of 42.2 months versus not reached for the remaining patients (Figure 1C, P,.001). MMCs of previously-untreated patients can be classified in 8 molecular groups [2] and DEPDC1A expression was significantly increased in the proliferation (PR) group and decreased in the low bone disease (LB), hyperdiploidy (HY), and myeloid (MY) groups (P #.05, Supplementary Figure S1B).
As DEPDC1A could be involved in cell proliferation [21], the prognostic value of DEPDC1A gene expression was compared to that of a gene expression based proliferation index (GPI) recently designed by our group [5] or of the Proliferation (PR) stratification designed by UAMS [2]. In univariate Cox analysis, the 3 parameters were significant. When compared two by two, DEPDC1A remained an independent prognosis factor when tested with PR stratification, and only DEPDC1A remained significant when tested with GPI. When the 3 parameters were tested together, only DEPDC1A remained significant (Supplementary Table S2).
Knockdown of DEPDC1A Gene Delays the Cell Growth of Human Myeloma Cell Lines (HMCLS)
Two wild-type TP53 HMCLs (XG7 and XG19) were first transduced with a lentivirus containing the tetracycline repressor (TR) that repressed the Tet operator (TR) and HMCL-TRs were then transduced with a lentiviral vector containing a DEPDC1A shRNA (shD1) linked to the GFP gene under the control of the Tet operator (HMCL-TR-shD1). As expected, HMCL-TR-shD1 did not express GFP and adding doxycycline (dox) induced GFP expression (Supplementary Figure S2). Doxycycline reduced DEPDC1A RNA by 50–60% (P,.001) and DEPDC1A protein by 80–95% (P,.001) in the 2 HMCL-TR-shD1 (Figure 2). An efficient inhibition of DEPDC1A expression by the shRNA was only observed after 3–5 days culture as shown in supplementary Figure S3. Doxycycline had no effect on HMCL-TR, which did not contain DEPDC1A shRNA (data not shown). Adding doxycycline induced growth delay of the 2 HMCL-TR-shD1, which becomes visible 4–5 days after adding doxycycline (Figure 3A). It had no effect on control HMCL-TR (data not shown). In 3 separate experiments, the doubling time of
XG7-Figure 1.DEPDC1Agene is expressed in primary myeloma cells of patients with newly-diagnosed MM in association with a short overall survival. A. DEPDC1A gene expression was assayed using Affymetrix microarray in normal bone marrow plasma cells (BMPCs, n = 7), primary multiple myeloma cells (MMCs) of 206 newly-diagnosed patients with MM and 20 Human Myeloma Cell Lines (HMCLs). Data are the log2 MAS5-normalized expression signal of DEPDC1A probe set 222958_s_at (the DEPDC1A probe set yielding the highest variance) in the different cell populations and statistical comparison was done with a Mann Whitney test.B. Prognostic value of DEPDC1A expression using UAMS-TT2 cohort of patients.C. Prognostic value of DEPDC1A expression using HM cohort of patients. The R Maxstat function was used to compute the cutoff yielding to the maximum difference in overall survival between patients with low or high DEPDC1A expression. Kaplan Meir survival curves of patients with high (black line) or low (gray line) DEPDC1A expression signal are shown.
HMCL-TR-shD1 cells was significantly (P,.05) increased 2 fold (from 1 day to 2 days) by adding doxycycline, and that of XG19-HMCL-TR-shD1 1.7 fold (from 0.9 day to 1.6 days, P,.05). The growth retardation induced by DEPDC1A knockdown was not due to a significant induction of apoptosis (Figure 3B), but to a partial blockade of cell cycle in the G2/M phase (Figure 4). Using BrdU incorporation and labelling with DAPI dye and an anti-BrdU antibody, the percentage of cells in the G2/M phase was increased 1.9 fold and 1.7 fold respectively in XG7-HMCL-TR-shD1 and XG19-HMCL-TR-shD1 in 3 separate experiments (P,.05, Table 1). FACS data of a representative experiment are displayed on Figure 4. The MFI of the labelling with anti-BrdU antibody was similar for cells treated or not with doxycycline, suggesting no delay in the DNA synthesis rate (Figure 4). To exclude off-targets of DEPDC1A shRNA, we used a siRNA targeting the non-coding 39 part of DEPDC1A mRNA. This DEPDC1A siRNA had the same biological effect as the shDEPDC1A, which targets DEPDC1A coding sequence: reduction of DEPDC1A mRNA by 47%, delay the growth of XG7 cells (Supplementary Figure S4), with partial accumulation of cells in the G2 phase (supplementary Figure S4). Of interest, overexpressing DEPDC1A gene lacking the non-coding 39 sequence targeted by the DEPDC1A siRNA abrogated the siRNA-mediated growth inhibitory effect and delay in G2 phase as shown in Supplementary Figure S4.
We next evaluated the role of DEPDC1A in a dox inducible TP53-mutated cell line (XG2-TR), which was transduced with the DEPDC1A shRNA lentiviral vector. Adding doxycycline reduced DEPDC1A RNA by 50% (P,.001) and protein by 90% (P,.001) (Figure 5A). DEPDC1A knockdown induced a dramatic apoptosis for XG2-HMCL-TR-shD1 cells, (80.2%63.1%, P = .002) and a stop in cell growth after 3 days of culture (Figures 5B and 5C). Due to the massive apoptosis in XG2-HMCL-TR-shD1 cells, the effect of DEPDC1A knockdown on cell cycle could not be investigated in XG2 cells.
Regulation of Signaling Pathway by DEPDC1A Knockdown
Given the cell cycle delay induced by DEPDC1A knockdown, the expression of some major proteins regulating cell cycle was investigated. DEPDC1A knockdown resulted in p21Cip1induction in association with p53 phosphorylation on Ser-15, leading to p53 stabilization (Figure 6). P27Kip1 expression was not affected (Figure 6). In XG2, the HMCL carrying TP53 mutated genes, a high level of mutant p53 could be detected and DEPDC1A knockdown induced no induction of p21cip1 and no change in p27Kip1level (Figure 6).
DEPDC1A Knockdown Increases Expression of Markers of Mature Plasma Cells
Genes whose expression was regulated by DEPDC1A knock-down were identified using Affymetrix U133 plus 2.0 microarrays performing 3 independent experiments for each of the 3 HMCLs. Wild-type TP53 XG7 and XG19 cells were treated for 5 days with or without dox and mutated TP53 XG2 cells for 3 days before apoptosis occurrence. Statistical analysis was done with Affymetrix GCOS (GeneChip Operating Software) software and the P-value are adjusted with Benjamini-Hochberg multiple testing correction. Crossing the gene lists obtained in the 3 independent experiments for each HMCL, 34 genes/ESTs were upregulated (fold change $1.5, P#.05) and 125 downregulated (fold change #0.67, P#.05) by DEPDC1A knockdown in XG7 HMCL (supplementary Table S3), 56 genes/ESTs upregulated (fold change $1.5, P#.05) and 87 downregulated (fold change #0.67, P#.05) in XG19 HMCL (supplementary Table S4). Twelve genes/ESTs were commonly upregulated (fold change $1.5, P#.05) and 39 downregulated (fold change #0.67, P#.05) in XG7 and XG19 HMCLs (Table 2). Regarding XG2 cells, 52 genes/ESTs were upregulated (fold change $1.5, P#.05) and 60 downregulated (fold change #0.67, P#.05) by DEPDC1A knockdown in XG2 HMCL (supplementary Table S5), and only 13 genes were commonly deregulated in XG7 and XG19 cells in one hand and XG2 cells in the other hand (Table 3), likely due to the dramatic apoptotic program induced by shDEPDC1A in XG2 cells.
Table 1. Knockdown of DEPDC1A expression induces a partial blockade in the G2/M phase.
XG7-TR-shD1 XG19-TR-shD1 (2dox) (+dox) (2dox) (+dox) G1 37.265 37.563.7 42.663.2 29.463.2* S 50.665.2 41.967.4* 48.862.6 53.262.6 G2/M 12.260.3 20.563.5* 8.565.9 17.365.8* XG7-TR-shD1 or XG19-TR-shD1 cells were cultured with or without dox for 6 days and cell cycle was quantified using BrdU incorporation and labelling with an anti-BrdU antibody and DAPI. Data are the mean percentages 6 SD of cells in each phase of the cell cycle (G1, S, G2/M) of three separate experiments. *indicates the mean value in the dox group is significantly different than that in the control group using a paired t test (P,.05).
doi:10.1371/journal.pone.0062752.t001
Figure 2. Knockdown ofDEPDC1Aexpression using shRNA. XG7-TR-shD1 and XG19-XG7-TR-shD1 cells were treated for 6 days with doxycycline (dox). Dox-induced knockdown of DEPDC1A expression was assayed using real time PCR and western blotting. Results are those of one experiment representative of three. Western lots were quantified by densitometry using NIH ImageJ software (National Institutes of Health, Bethesda, MD, USA) and levels of DEPDC1A protein normalized according to those of b-actin, and giving the arbitrary value of 100 in cells not treated with dox.
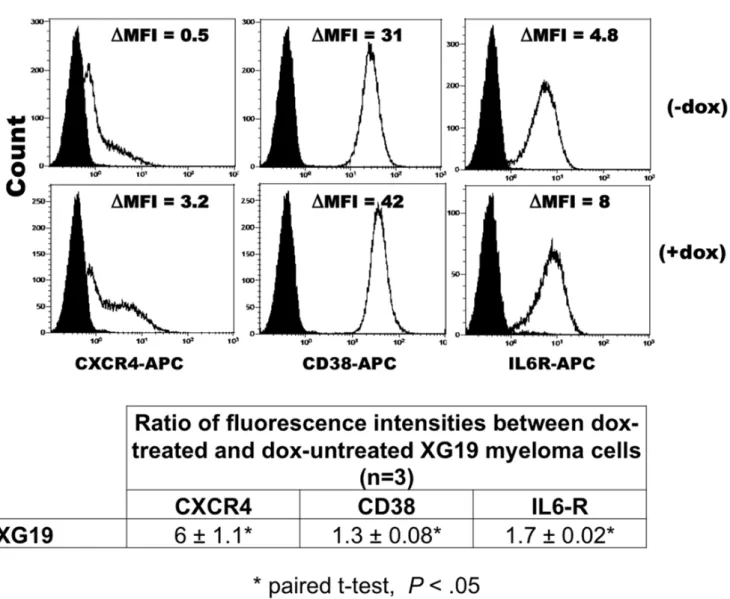
The majority of genes upregulated in HMCL-TR-shD1 upon DEPDC1A knockdown encode for proteins, we and others have reported to be markers of normal mature plasma cells including CD38 and its receptor PECAM1/CD31, CXCR4, IL6R, CD9, SULF2, FGFR2, HES1 and HES2 [22,23]. We checked that DEPDC1A knockdown could significantly (P,.05) upregulate the expression of CXCR4, IL-6R or CD38 proteins in XG19 cells (Figure 7) or XG7 cells (supplementary Figure S5) using flow cytometry in 3 independent experiments.
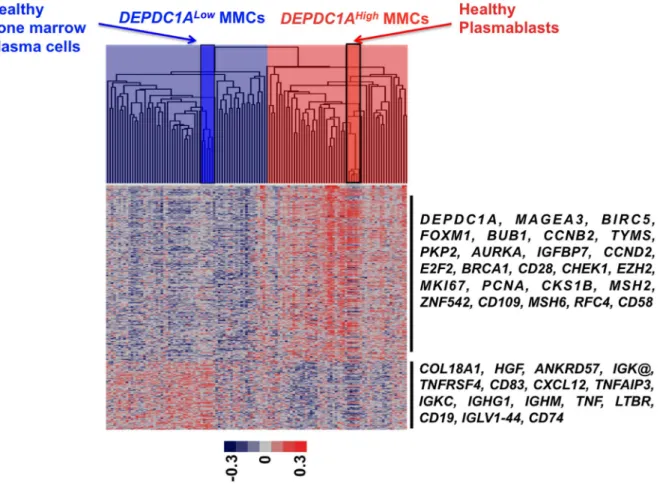
DEPDC1AHigh MMCs have a Plasmablastic Signature and DEPDC1ALowMMCs a Mature Plasma Cell One
We looked for differences in gene expression profiles between MMCs of 25% of patients with the highest DEPDC1A expression (DEPDC1AHigh) and those of 25% of patients with the lowest DEPDC1A expression (DEPDC1ALow). 320 genes/ESTs were differentially expressed between DEPDC1ALow and DEPDC1AHigh MMCs using SAM supervised analysis (1000 permutation, fold change $2, supplementary Table S6). Using Gene Ontology, DEPDC1AHigh MMC genes are enriched in genes coding for proteins involved in cell cycle or DNA replication (Supplementary Table S6). Conversely, DEPDC1ALowMMC genes are enriched in genes coding for intercellular communication signals, immuno-globulin heavy chains, and signal transduction (Supplementary
Table S6). Using unsupervised clustering with these 320 DEPDC1A genes, DEPDC1AHigh MMCs clustered together with healthy plasmablasts (Spearman correlation coefficient, 0.6; P = .001) and DEPDC1ALow MMCs with healthy bone marrow plasma cells (Spearman correlation coefficient, 0.4; P = .001; Figure 8). Altogether, these data indicate DEPDC1ALow MMCs display a mature plasma cell signature, and DEPDC1AHighMMCs a plasmablast one.
Discussion
We report that a high DEPDC1A gene expression in MMCs is associated with poor prognosis in two independent large series of previously-untreated patients with MM, and that a conditional knockdown of DEPDC1A affects the growth of multiple myeloma cell lines and induces markers of mature plasma cell. Regarding myeloma cell lines, two different biological effects were observed: a growth delay without major apoptosis in XG7 and XG19 cells carrying wild-type TP53 genes and a dramatic apoptosis in the XG2 cells carrying mutated TP53 genes. In wild-type TP53 cell lines, the growth delay is explained by a partial blockade of myeloma cells in the G2/M phase of the cell cycle, in association with p53 phosphorylation and stabilization, p21Cip1 expression, and no change in p27KIP1. P21Cip1is a cell cycle inhibitor acting
Figure 3. Knockdown ofDEPDC1Aexpression delays myeloma cell line growth. The HMCL-TR-shD1 were cultured for 10 days with or without doxycycline (dox). Data are the mean counts 6 SD of viable cells using trypan blue exclusion of 3 separate experiments. Given the log scale representation, standard errors bars could be too small to be visible.B. The HMCL-TR-shD1 were cultured for 6 days with or without dox and annexin V+apoptotic cells evaluated by flow cytometry. Data are FACS data of one representative experiment and mean values 6 SD of 3 separate experiments. Statistical analysis was done with a paired t-test.
on the G1/S phase, late S phase and G2/M phase checkpoints [24]. p53 phosphorylation could be induced by ATM and CHK2 kinases controlling the DNA Damage Response (DDR) [25]. But we failed to find DEPDC1A knockdown increases the phosphor-ylation of ATM and CHK2 or of ATR and CHK1 kinases (results not shown). Alternative hypotheses are that DEPDC1A knockdown could activate other kinases able to phosphorylate p53, such as DNA-dependent protein kinase [26]. Of note, DEPDC1A was recently shown to interact with zinc finger transcription factor ZNF224, a known transcriptional repressor [19]. The transcrip-tional repression by ZNF224 involves DNA epigenetic modifica-tions, in particular binding and recruitment of KAP1 to DNA
[27]. KAP1 is a scaffold protein activating the epigenetic machinery and participating in the DNA damage response [28]. Thus, we may speculate that DEPDC1A knockdown will release ZNF224, which could efficiently recruit KAP1 yielding to increased DNA damage response, activation of cell cycle checkpoints and delay in cell cycle. The high apoptosis induced by DEPDC1A knockdown in XG2 cells carrying mutated TP53 genes could be understandable in light of data with wild-type TP53 HMCLs. In these cells, there was no induction of p21Cip1due to lack of wild-type p53. This could result in a lack of mitotic delay to check for DNA integrity and eventually repair of DNA defects, yielding to mitotic catastrophe [29].
Figure 4. Knockdown ofDEPDC1Aexpression blocks cell cycle in myeloma cell lines. XG7-TR-shD1 and XG19-TR-shD1 cells were cultured with or without doxycycline (dox) for 6 days and cell cycle was quantified using BrdU incorporation and labelling with an anti-BrdU antibody and DAPI. Data are those of one experiment representative of three.
A second current finding is that DEPDC1A knockdown induces markers of mature plasma cells in TP53 wild-type HMCLs, including CD38, CXCR4, IL-6R. Plasma cell differentiation is mainly driven by the BLIMP1 inhibitory transcription factor [30]. BLIMP1 interacts with PRTM5, an arginine-specific histone methyltransferase, which in turn mediates symmetrical dimethylation of arginine 3 on histone H2A and/or H4 tails [31]. As PRTM5 is also a component of ZNF224 transcription complex [32], DEPDC1A could modulate PRTM5 activity and thus BLIMP1 activity, blocking full plasma cell differentiation. This function should be relevant for normal plasma cells as DEPDC1A is highly expressed in normal plasmablasts and downregulated upon their differentiation into plasma cells (see http:// amazonia.transcriptome.eu/expression.php?probeId = 222958_s_at& zone = PlasmaCell) [23,33].
This function found using myeloma cell lines likely occurs in primary myeloma cells, since DEPDC1A is increased in myeloma cells of patients belonging to the proliferation molecular group. The fact that DEPDC1A promotes cell cycle and blocks differentiation of myeloma
cells explains its value as an indicator of poor prognosis in multiple myeloma since both cell cycling and plasmablast phenotype of myeloma cells are associated with poor prognosis [34,35]. Expression of DEPDC1A in human tissues can be visualized using our Amazonia! Web site (http://amazonia.transcriptome.eu/expression.php?probeId = 222958_s_at). DEPDC1A is poorly expressed in the majority of tissues, except in human bone marrow and lymphoid organs. It is highly expressed in human embryonic pluripotent stem cells in agreement with its supposed ability to promote cell cycle and block differentiation. The current results together with previous data reporting a role of DEPDC1A in promoting epithelial cancer proliferation suggest that DEPDC1A could be an interesting target in multiple myeloma, with potentially limited toxicity.
Materials and Methods
The study was approved by the ethics boards of the University Hospitals of Heidelberg and Montpellier. Multiple myeloma cells
Figure 5. Knockdown ofDEPDC1A induced apoptosis in TP53-mutated cell line. A. XG2-TR-shD1 cells were treated for 3 days with doxycycline (dox). Doxycycline-induced knockdown of DEPDC1A gene or protein expression were assayed using real time PCR or western blotting.B. XG2-TR-shD1 cells were cultured for 6 days with or without dox and annexin V+apoptotic cells evaluated by flow cytometry. Data are FACS data of
one representative experiment and mean values 6 SD of 3 separate experiments. Statistical analysis was done with a paired t-test.C. XG2-TR-shD1 cells were cultured for 7 days with or without doxycycline (dox). Data are the mean counts 6 SD of viable cells using trypan blue exclusion of 3 separate experiments. Given the log scale representation, standard errors bars could be too small to be visible.
(MMCs) were purified from a series of 206 newly diagnosed patients with myeloma after written informed consent was given according to the Declaration of Helsinki.
Patients’ Samples and Cell Lines
The XG1, XG2, XG3, XG4, XG5, XG6, XG7, XG10, XG11, XG12, XG13, XG16, XG19, and XG20 human myeloma cell lines (HMCLs) were obtained as described [36,37,38] and SKMM, OPM2, LP1 and RPMI8226 HMCLs purchased from ATTC (LGC Standards, France). These HMCLs were recently molecularly and phenotypically characterized [9]. MMCs of 206 patients with previously untreated MM were included in this study after written informed consent was given at the University hospitals of Heidelberg (Germany) or Montpellier (France) and agreement by the ethics boards of Heidelberg University and Montpellier University. These 206 patients were treated with high dose therapy (HDC) and autologous stem cell transplantation (ASCT) and this cohort is termed in the following Heidelberg-Montpellier (HM) cohort. Patients’ characteristics are available in Supplementary Table S1. Gene expression profiling (GEP) of purified MMCs was assayed using Affymetrix U133 2.0 plus microarrays as described [39] and data were normalized using the MAS5 Affymetrix algorithm with a scaling factor of 100. The.CEL
and MAS5 files are deposited in the ArrayExpress public database (http://www.ebi.ac.uk/arrayexpress/), under accession number E-MTAB-362. Interphase-FISH-analysis was performed accord-ing to our previously reported protocol [40]. We also used publicly available Affymetrix data (http://www.ncbi.nlm.nih.gov/geo, GSE2658) of a cohort of 345 purified MMCs from previously untreated patients from the University of Arkansas for Medical Sciences (UAMS, Little Rock, AR). These patients were treated with total therapy 2 [41] and this cohort is termed in the following UAMS-TT2 cohort. Normal Healthy plasmablasts and healthy bone marrow plasma cells (BMPCs) were obtained as described [23,42] and GEP data are available on ArrayExpress public database (http://www.ebi.ac.uk/arrayexpress/), under accession numbers E-MEXP-2360, E-MEXP-3034 and E-MEXP-2360.
Real-time RT-PCR
RNA was converted to cDNA using the Qiagen’s QuantiTect Rev. Transcription Kit (Qiagen, Hilden, Germany). The assays-on-demand primers and probes and the TaqMan Universal Master Mix were used according to the manufacturer’s instruc-tions (Applied Biosystems, Courtaboeuf, France). The measure-ment of gene expression was performed using the Roche LC480 Sequence Detection System. For each primer, serial dilutions of a
Figure 6. Knockdown ofDEPDC1Ainduced p53 phosphorylation and stabilization, and p21Cip1accumulation. A. HMCL-TR-shD1 cells were cultured for 4-6 days with or without dox and protein detection was assayed using western blot analysis. Membranes were stained with rabbit anti-p27Kip1, anti-p53, anti-Phospho-p53 (Ser15 or Ser20) and mouse anti-p21Cip1antibodies. A mouse monoclonal anti-b-actin antibody was used as
control. The antibody binding was revealed using peroxidase-conjugated secondary antibodies and an enhanced chemiluminescence detection system.B. Western lots were quantified by densitometry using NIH ImageJ software (National Institutes of Health, Bethesda, MD, USA) and protein levels normalized according to those of b-actin. Data are the mean normalized protein expressions of 3 experiments. *indicates a significant change (P,.05) in dox-treated cells compared to untreated ones using a Wilcoxon test.
standard cDNA were amplified to create a standard curve, and values of unknown samples were estimated relative to this standard curve in order to assess PCR efficiency. Ct values were obtained for GAPDH and the respective genes of interest during log phase of the cycle. Gene expression was normalized to that of GAPDH
(DCt = Ct gene of interest – Ct GAPDH) and compared with the values obtained for a known positive control using the following formula: 100/2DDCt where DDCt = DCt unknown –DCt positive control.
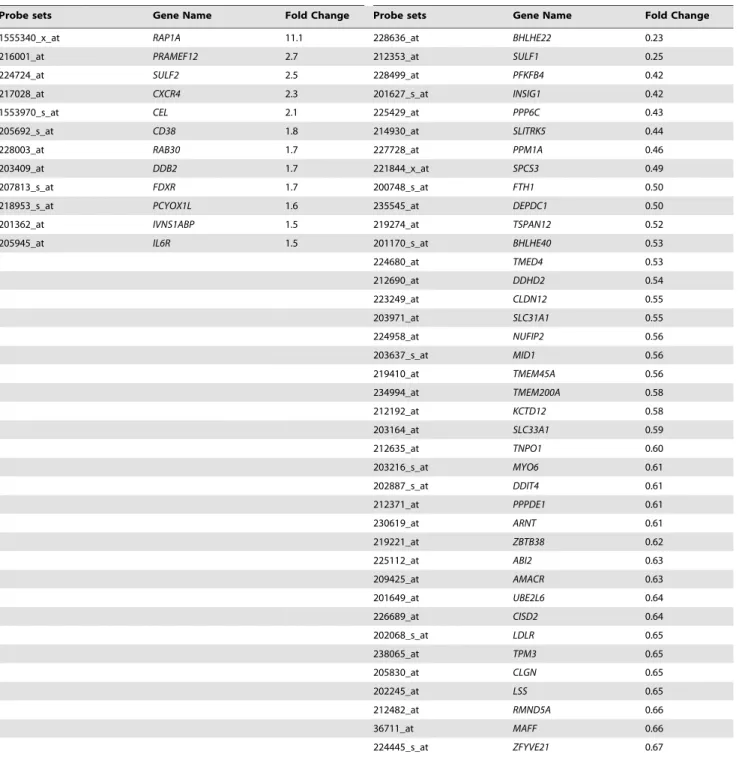
Table 2. Common genes deregulated by DEPDC1A knockdown in XG7 and XG19 human myeloma cell lines carrying wild-type TP53 genes.
Genes significantly upregulated by DEPDC1A knockdown Genes significantly downregulated by DEPDC1A knockdown Probe sets Gene Name Fold Change Probe sets Gene Name Fold Change 1555340_x_at RAP1A 11.1 228636_at BHLHE22 0.23 216001_at PRAMEF12 2.7 212353_at SULF1 0.25
224724_at SULF2 2.5 228499_at PFKFB4 0.42
217028_at CXCR4 2.3 201627_s_at INSIG1 0.42
1553970_s_at CEL 2.1 225429_at PPP6C 0.43
205692_s_at CD38 1.8 214930_at SLITRK5 0.44
228003_at RAB30 1.7 227728_at PPM1A 0.46
203409_at DDB2 1.7 221844_x_at SPCS3 0.49
207813_s_at FDXR 1.7 200748_s_at FTH1 0.50
218953_s_at PCYOX1L 1.6 235545_at DEPDC1 0.50 201362_at IVNS1ABP 1.5 219274_at TSPAN12 0.52 205945_at IL6R 1.5 201170_s_at BHLHE40 0.53 224680_at TMED4 0.53 212690_at DDHD2 0.54 223249_at CLDN12 0.55 203971_at SLC31A1 0.55 224958_at NUFIP2 0.56 203637_s_at MID1 0.56 219410_at TMEM45A 0.56 234994_at TMEM200A 0.58 212192_at KCTD12 0.58 203164_at SLC33A1 0.59 212635_at TNPO1 0.60 203216_s_at MYO6 0.61 202887_s_at DDIT4 0.61 212371_at PPPDE1 0.61 230619_at ARNT 0.61 219221_at ZBTB38 0.62 225112_at ABI2 0.63 209425_at AMACR 0.63 201649_at UBE2L6 0.64 226689_at CISD2 0.64 202068_s_at LDLR 0.65 238065_at TPM3 0.65 205830_at CLGN 0.65 202245_at LSS 0.65 212482_at RMND5A 0.66 36711_at MAFF 0.66 224445_s_at ZFYVE21 0.67
XG7-TR-shD1 and XG19-TR-shD1 cells were cultured with or without doxycycline for 5 days. Genes whose expression is deregulated by DEPDC1A knockdown were identified using Affymetrix U133 plus 2.0 microarrays. Data are the common genes significantly (P#.05) upregulated ($1.5 fold) or downregulated (#0.67 fold) by DEPDC1A knockdown in the 2 human multiple myeloma cell lines.
Western Blot Analysis
Cells were lysed in 10mM Tris-HCl (pH 7.05), 50 mM NaCl, 50 mM NaF, 30 mM sodium pyrophosphate, 1% Triton X-100, 5mM ZnCl2, 100mM Na3VO4, 1 mM dithiothreitol, 20 mM
b-glycerophosphate, 20 mM p-nitrophenol phosphate, 20mg/ml aprotinin, 2.5mg/ml leupeptin, 0.5 mM phenylmethylsulfonyl fluoride, 0.5 mM benzamidine, 5mg/ml pepstatin and 50 nM okadaic acid. Lysates were resolved on 12% sodium dodecyl sulfate-polyacrylamide gel electrophoresis and transferred to a nitrocellulose membrane (Schleicher and Schuell, Kassel, Ger-many). Membranes were blocked for 2 h at room temperature in 140 mM NaCl, 3 mM KCl, 25 mM Tris-HCl (pH 7.4), 0.1% Tween 20 (tris-buffered saline Tween-20), 5% non-fat milk, and then immunoblotted with monoclonal mouse anti-DEPDC1 antibody (Abnova, Taiwan, China), rabbit anti-p27Kip1, anti-p53, anti-Phospho-p53 (Ser-15 or Ser-20), and mouse anti-p21Cip1 antibodies (Cell Signaling Technology, Beverly, MA, USA). As a control for protein loading, we used a mouse monoclonal anti-b-actin antibody (Sigma, St Louis, MO, USA). The primary antibodies were visualized with goat anti-rabbit (Sigma) or goat anti-mouse (Bio-Rad, Hercules, CA, USA) peroxidase-conjugated antibodies by an enhanced chemiluminescence detection system. Blots were quantified by densitometry using NIH ImageJ software (National Institutes of Health, Bethesda, MD, USA) and protein expression normalized according to b-actin expression.
Obtaining of HMCLs Conditionally Expressing shDEPDC1A
Three human multiple myeloma cell lines (HMCLs) were used including two wild type TP53 HMCLs (XG7 and XG19) and one TP53-mutated HMCL (XG2). HMCLs (XG2, XG7 and XG19) were first transduced with a lentivirus containing the tetracycline repressor (TR) that repressed Tet operator (Tet)O (HMCL-TR).
HMCL-TRs were then transduced with a lentiviral vector containing a DEPDC1A shRNA (shD1) linked with GFP gene under the control of Tet operator (HMCL-TR-shD1). The DEPDC1A shRNA targets the coding sequence of DEPDC1A and was
purchased from Invitrogen (Invitrogen, Carlsbad, USA). In some experiments, HMCL-TR-shD1 were also cotransduced with a lentivirus containing DEPDC1A gene under the control of Tet operator (HMCL-TR-DEP-shD1). The lentivirus expressing shDEPDC1A or DEPDC1A were produced using Invitrogen methodology(Invitrogen, Carlsbad, USA). The human 293FT cell line was cultured in Dulbecco’s modified Eagle’s medium and supplemented with 10% defined fetal bovine serum, 500mg/ml geneticin, 4 mM L-glutamine, and 1 mM MEM sodium pyruvate. The day before transfection, cells were plated into a 10 cm tissue culture plate to 90%–95% confluence. Nine mg of ViraPower packaging mix, 9mg of pLenti3.3TR plasmid, and 9mg of pLenti4 plasmid containing or not shDEPDC1A (Invitrogen, Carlsbad, USA). were co-transfected into 293FT cells using 36ml Lipofectamine 2000 reagent. The nucleotide sequence of shDEPDC1A used was: 59-TGCTGTTAAGTGGCGAAGTTGCAGGAGTTTTGGCC ACTGACTGACTCCTGCAATCGCCACTTAA-39. To produce the DEPDC1A lentivirus, 9 mg of pLenti6.3 plasmid (Invitrogen) containing or not DEPDC1A cDNA (comprising the coding sequence only, purchased from ImaGenes (ImaGenes GmbH, Berlin, Germany) were used. After forty-eight hours, culture supernatant was collected, concentrated, and viral titer determined. The HMCLs expressing TR transgene (HMCL-TR) or TR and shDEPDC1A (HMCL-TR-shDEPDC1A) or DEPDC1A were ob-tained applying selection antibiotics. To exclude off-targets of DEPDC1A shRNA, we used a siRNA targeting the non-coding 39 part of DEPDC1A mRNA (position 835 in the sequence) and the control scrambled siRNA, purchased from Invitrogen (Invitrogen, Carlsbad, USA). To introduce the siRNA into cells, XG7 cells were transfected with lipofectamine RNAiMAX (5ml, Invitrogen, Carlsbad, USA) and 50 nM siRNA in RPMI 1640 culture medium and 10% fetal bovine serum. Transfected cells are cultured with RPMI 1640 medium, 10% fetal bovine serum and 2 ng/ml IL6.
Gene expression in shDEPDC1A shRNA-expressing cells was evaluated performing three independent experiments (control cells and cells expressing the shRNA) for each myeloma cell line treated Table 3. Common genes deregulated by DEPDC1A knockdown in the 2 wild-type TP53 XG19 and XG7 human myeloma cell lines and in the mutated TP53 XG2 human myeloma cell line.
Probe sets Gene Name Fold Change Category
1555340_x_at RAP1A 8.49 Genes significantly upregulated by DEPDC1A knockdown
227728_at PPM1A 0.44 Genes significantly downregulated by DEPDC1A knockdown 218817_at SPCS3 0.46 235545_at DEPDC1 0.47 221844_x_at SPCS3 0.55 225429_at PPP6C 0.55 224680_at TMED4 0.55 212690_at DDHD2 0.57 238065_at TPM3 0.61 225112_at ABI2 0.62 224445_s_at ZFYVE21 0.62 226689_at CISD2 0.64 202666_s_at ACTL6A 0.65
XG2-TR-shD1 cells were cultured with or without doxycycline for 3 days and XG7-TR-shD1 and XG19-TR-shD1 cells for 5 days. Genes whose expression is deregulated by DEPDC1A knockdown were identified using Affymetrix U133 plus 2.0 microarrays. Data are the common gene significantly significantly (P#.05) upregulated ($1.5 fold) or downregulated (#0.67 fold) by DEPDC1A knockdown in the 3 human multiple myeloma cell lines.
for 5 days (XG7 and XG19 HMCLs) or 3 days (XG2 cells) with dox and hybridizing six microarrays (Affymetrix U133 plus 2.0) per cell line (3 controls and 3 shDEPDC1A).
Cell Growth, Cell Cycle, Apoptosis and Immunophenotypic Analysis
HMCLs were cultured for 4 days in 96-well flat-bottom microtiter plates in complete culture medium with IL-6 and cell growth was evaluated by quantifying intracellular ATP amount with a Cell Titer Glo Luminescent Assay (Promega, Madison, WI) with a Centro LB 960 luminometer (Berthold Technologies, Bad Wildbad, Germany). In some experiments, doxycycline (1mg/ml) was added to induce shDEPDC1A expression. The cell cycle was assessed using 49,6-diamidino-2-phenylindole (DAPI) staining
(Sigma Aldrich) and ModFit analysis (Verity Software House, Topsham, ME). Cells in the S phase were quantified using incubation with bromodeoxyuridine (BrdU) for 1 hour, and labelling with an anti-BrdU antibody (APC BrdU flow kit, BD Pharmingen, Le Pont De Claix, France) as indicated [43]. Apoptotic cells were detected using phycoerythrin-conjugated annexin V (PE-annexin V, BD Pharmingen). For the immuno-phenotypic analysis, cells were stained using an anti-CXCR4 mAb, an anti-IL6R mAb and an anti-CD38 mAb (all from BD Biosciences).
Statistical Analysis
Gene expression data were normalized with the MAS5 algorithm and analyzed with our bioinformatics platform - RAGE, http://
Figure 7.DEPDC1Aknockdown increases expression of markers of mature plasma cells in myeloma cell lines. XG19-TR-shD1 cells were cultured with or without doxycycline (dox) for 6 days and cells were stained with phycoerythrin-conjugated CXCR4 mAb, IL6R mAb, anti-CD38 mAb (continuous line) or isotype-matched control mAbs (black full histogram). Facs data are those of one experiment representative of three. DMFI is the difference between the mean fluorescence intensity (MFI) with the antigen-specific antibody and MFI with isotype-matched control mAb. The table indicates the mean ratio of DMFI between dox-treated and dox-untreated XG19 myeloma cells in 3 independent experiments. *indicates a significant increase in CXCR4, IL6R or CD38 expression using a paired t-test (P,.05).
rage.montp.inserm.fr/[44] and Amazonia, http://amazonia. montp.inserm.fr/) [45] - and the SAM (Significance Analysis of Microarrays) software (www-stat.stanford.edu/,tibs/SAM/). Sta-tistical comparisons were done with Mann-Whitney, Chi-square, or unpaired or paired Student’s t-tests. The change in gene expression induced by shDEPDC1A in HMCLs was evaluated with Affymetrix GCOS (GeneChip Operating Software) software using Wilcoxon test and crossing, for each cell line, the gene lists of the 3 independent experiments. The advantage of Affymetrix GCOS software is to use the information provided by the 11 perfect-match (PM) and the 11 mismatch (MM) probes designed to build a given probe set signal, and avoids losing most of information given we have only 3 replicates and stringent multiple testing correction. Briefly, The analysis compares the difference values (PM-MM) of each probe pair in the baseline array to its matching probe pair on the experiment array. For each probe set a change p-value and an associated fold change is generated using Wilcoxon test. The p-value is then adjusted using Benjamini-Hochberg multiple testing correction.
Supporting Information
Figure S1 A. Correlation (r = 0.7, P = .005) between DEPDC1A gene expression assayed both by real time RT-PCR or Affymetrix microarrays (probe set 222958_s_at) in 16 HMCLs.B. DEPDC1A
expression in primary MMCs of the eight molecular groups of previously-untreated patients defined by UAMS. *DEPDC1A expression was significantly (P #.05) increased in patients in the proliferation (PR) group and decreased in patients with bone disease (LB), hyperdiploid (HY) or myeloid (MY) groups. (TIF)
Figure S2 Knockdown of DEPDC1A expression using
inducible shRNA. XG19-TR-shD1 cells were treated for 6 days with or not doxycycline (dox). Data shows the induction of GFP expression by dox treatment assayed using flow cytometry. (TIF)
Figure S3 Kinetics of DEPDC1A gene expression after doxycycline treatment. XG19-TR-shD1 cells were treated for various days with or without doxycycline (dox) and DEPDC1A gene expression assayed using real time PCR. Results are the mean percentages of DEPDC1A gene expression in dox-treated cells compared to dox-untreated cells in 3 separate experiments. *indicates the mean percentage in the dox-treated cells is significantly different than that in the dox-untreated cells using a paired t test (P,.05).
(TIF)
Figure S4 Overexpression of DEPDC1A abrogated the growth delay induced by aDEPDC1A siRNA. DEPDC1A
Figure 8.DEPDC1Agene signature clusterDEPDC1AHighMMCs with healthy plasmablasts andDEPDC1ALowMMCs with mature bone
marrow plasma cells. Using the 320 genes differentially expressed between DEPDC1AHighand DEPDC1ALowMMCs, DEPDC1AHighMMCs (light red) of previously-untreated patients cluster together with healthy plasmablasts (red) and DEPDC1ALowMMCs (light blue) cluster with mature healthy bone
marrow plasma cells. The color of each cell in the tabular image represents the expression level of each gene (red, expression higher than the mean; blue, expression lower than the mean; increasing color intensity represents a higher magnitude of deviation from the mean). Arrows highlight some remarkable genes.
gene was overexpressed 8 fold in XG7 cells by lentiviral delivery of DEPDC1A coding sequence. DEPDC1A RNA was quantified by real time RT-PCR and results are mean values of 3 representative experiments. A. The siRNA targeting the non-coding part of DEPDC1A mRNA decreased by 47% the expression of endoge-nous DEPDC1A gene, and did not affect that of DEPDC1A transgene lacking the 39 non-coding sequence. Results are mean values of real-time RT-PCR of 3 independent experiments. B. The siRNA targeting the non-coding part of DEPDC1A mRNA delayed the growth of XG7 cells but did not affect the growth of XG7 cells transduced with DEPDC1A transgene. The cell lines were cultured for 3 days after siRNA transfection. Data are the mean counts 6 SD of viable cells using trypan blue exclusion of 3 separate experiments. D. The siRNA targeting the non-coding part of DEPDC1A mRNA delayed cell cycle in the G2 phase in XG7 cells, but did not affect cell cycle in XG7 cells transduced with DEPDC1A transgene lacking the 39 non-coding sequence. Results are FACS cell cycle data of a representative experiment and the table below shows the mean values 6 SD of cell cycle data of 3 experiments. *indicates the mean percentage is significantly different than that in cells treated with the scrambled siRNA using a paired t test (P,.05).
(TIF)
Figure S5 DEPDC1A knockdown increases expression of markers of mature plasma cells in myeloma cell lines. XG7-TR-shD1 cells were cultured with or without doxycycline (dox) for 6 days and cells were stained with phycoerythrin-conjugated anti-CXCR4 mAb, anti-IL6R mAb, anti-CD38 mAb (continuous line) or isotype-matched control mAbs (black full histogram). Facs data are those of one experiment representative of three. DMFI is the difference between the mean fluorescence intensity (MFI) with the antigen-specific antibody and MFI with isotype-matched control mAb. The table indicates the mean ratio of DMFI between dox-treated and dox-untreated XG19 myeloma cells in 3 independent experiments. *indicates a significant increase in CXCR4, IL6R or CD38 expression using a paired t-test (P,.05).
(TIF)
Table S1 Clinical characteristics of patients of HM cohort. Data are median values and ranges for age, serum monoclonal protein, serum-b-microglobulin and the Salmon-Durie and International Staging System (ISS) stages. NA, not available.
(PDF)
Table S2 Cox univariate and multivariate analysis of overall survival in UAMS-TT2 patients’ cohorts. The prognostic factors were tested as single variable or multi variables using a Cox-model. Hazard ratios (HR) and P-values are shown. NS, Not Significant at a 5% threshold; GPI, gene expression based proliferation index; PR, Proliferation stratification according to UAMS.
(PDF)
Table S3 Genes deregulated in wild-type TP53 XG7 human myeloma cell line.
(XLS)
Table S4 Genes deregulated in wild-type TP53 XG19 human myeloma cell line.
(XLS)
Table S5 Genes deregulated in mutated TP53 XG2
human myeloma cell line. (XLS)
Table S6 Genes overexpressed in DEPDC1A high pa-tients compared to DEPDC1 low papa-tients.
(XLS)
Acknowledgments
We thank the Microarray Core Facility of IRB (http://irb.montp.inserm. fr/en/index.php?page = Plateau&IdEquipe = 6).
Author Contributions
Conceived and designed the experiments: AK BK. Performed the experiments: AK MS. Analyzed the data: AK BK. Contributed reagents/materials/analysis tools: DH HG JM TR JLV. Wrote the paper: AK BK DH.
References
1. Fonseca R, Bergsagel PL, Drach J, Shaughnessy J, Gutierrez N, et al. (2009) International Myeloma Working Group molecular classification of multiple myeloma: spotlight review. Leukemia 23: 2210–2221.
2. Zhan F, Huang Y, Colla S, Stewart JP, Hanamura I, et al. (2006) The molecular classification of multiple myeloma. Blood 108: 2020–2028.
3. Shaughnessy JD Jr., Zhan F, Burington BE, Huang Y, Colla S, et al. (2007) A validated gene expression model of high-risk multiple myeloma is defined by deregulated expression of genes mapping to chromosome 1. Blood 109: 2276– 2284.
4. Decaux O, Lode L, Magrangeas F, Charbonnel C, Gouraud W, et al. (2008) Prediction of survival in multiple myeloma based on gene expression profiles reveals cell cycle and chromosomal instability signatures in high-risk patients and hyperdiploid signatures in low-risk patients: a study of the Intergroupe Francophone du Myelome. J Clin Oncol 26: 4798–4805.
5. Hose D, Reme T, Hielscher T, Moreaux J, Meissner T, et al. (2011) Proliferation is a central independent prognostic factor and target for personalized and risk adapted treatment in multiple myeloma. Haematologica 96: 87–95.
6. Hose D, Reme T, Meissner T, Moreaux J, Seckinger A, et al. (2009) Inhibition of aurora kinases for tailored risk-adapted treatment of multiple myeloma. Blood 113: 4331–4340.
7. Seckinger A, Meissner T, Moreaux J, Goldschmidt H, Fuhler GM, et al. (2009) Bone morphogenic protein 6: a member of a novel class of prognostic factors expressed by normal and malignant plasma cells inhibiting proliferation and angiogenesis. Oncogene 28: 3866–3879.
8. Kassambara A, Hose D, Moreaux J, Walker BA, Protopopov A, et al. (2012) Genes with a spike expression are clustered in chromosome (sub)bands and spike (sub)bands have a powerful prognostic value in patients with multiple myeloma. Haematologica 97: 622–630.
9. Moreaux J, Klein B, Bataille R, Descamps G, Maiga S, et al. (2011) A high-risk signature for patients with multiple myeloma established from the molecular classification of human myeloma cell lines. Haematologica 96: 574–582. 10. Chibon F, Lagarde P, Salas S, Perot G, Brouste V, et al. (2010) Validated
prediction of clinical outcome in sarcomas and multiple types of cancer on the basis of a gene expression signature related to genome complexity. Nat Med 16: 781–787.
11. Lemee F, Bergoglio V, Fernandez-Vidal A, Machado-Silva A, Pillaire MJ, et al. (2010) DNA polymerase theta up-regulation is associated with poor survival in breast cancer, perturbs DNA replication, and promotes genetic instability. Proc Natl Acad Sci U S A 107: 13390–13395.
12. Pillaire MJ, Selves J, Gordien K, Gourraud PA, Gentil C, et al. (2010) A ‘DNA replication’ signature of progression and negative outcome in colorectal cancer. Oncogene 29: 876–887.
13. Carter SL, Eklund AC, Kohane IS, Harris LN, Szallasi Z (2006) A signature of chromosomal instability inferred from gene expression profiles predicts clinical outcome in multiple human cancers. Nat Genet 38: 1043–1048.
14. Christensen JH, Jensen PV, Kristensen IB, Abildgaard N, Lodahl M, et al. (2012) Characterization of potential CD138 negative myeloma ‘‘stem cells’’. Haematologica 97: e18–20.
15. Chiron D, Surget S, Maiga S, Bataille R, Moreau P, et al. (2012) The peripheral CD138+ population but not the CD138- population contains myeloma clonogenic cells in plasma cell leukaemia patients. Br J Haematol 156: 679–683. 16. Kim D, Park CY, Medeiros BC, Weissman IL (2012) CD19(-)CD45 (low/2)CD38(high)/CD138(+) plasma cells enrich for human tumorigenic myeloma cells. Leukemia.
17. Greipp PR, Raymond NM, Kyle RA, O’Fallon WM (1985) Multiple myeloma: significance of plasmablastic subtype in morphological classification. Blood 65: 305–310.
18. Kretschmer C, Sterner-Kock A, Siedentopf F, Schoenegg W, Schlag PM, et al. (2011) Identification of early molecular markers for breast cancer. Mol Cancer 10: 15.
19. Harada Y, Kanehira M, Fujisawa Y, Takata R, Shuin T, et al. (2010) Cell-permeable peptide DEPDC1-ZNF224 interferes with transcriptional repression and oncogenicity in bladder cancer cells. Cancer Res 70: 5829–5839. 20. Okayama H, Kohno T, Ishii Y, Shimada Y, Shiraishi K, et al. (2011)
Identification of Genes Up-regulated in ALK-positive and EGFR/KRAS/ALK-negative Lung Adenocarcinomas. Cancer Res.
21. M Kanehira YH, R Takata, T Shuin, T Miki, T Fujioka, et al. (2007 ) Involvement of upregulation of DEPDC1 (DEP domain containing 1) in bladder carcinogenesis. Oncogene 26: 6448–6455.
22. Jego G, Robillard N, Puthier D, Amiot M, Accard F, et al. (1999) Reactive plasmacytoses are expansions of plasmablasts retaining the capacity to differentiate into plasma cells. Blood 94: 701–712.
23. Jourdan M, Caraux A, De Vos J, Fiol G, Larroque M, et al. (2009) An in vitro model of differentiation of memory B cells into plasmablasts and plasma cells including detailed phenotypic and molecular characterization. Blood 114: 5173– 5181.
24. Cazzalini O, Scovassi AI, Savio M, Stivala LA, Prosperi E (2010) Multiple roles of the cell cycle inhibitor p21(CDKN1A) in the DNA damage response. Mutat Res 704: 12–20.
25. Smith J, Tho LM, Xu N, Gillespie DA (2010) The ATM-Chk2 and ATR-Chk1 pathways in DNA damage signaling and cancer. Adv Cancer Res 108: 73–112. 26. Hill R, Lee PW (2010) The DNA-dependent protein kinase (DNA-PK): More
than just a case of making ends meet? Cell Cycle 9: 3460–3469.
27. Medugno L, Florio F, De Cegli R, Grosso M, Lupo A, et al. (2005) The Kruppel-like zinc-finger protein ZNF224 represses aldolase A gene transcription by interacting with the KAP-1 co-repressor protein. Gene 359: 35–43. 28. Friedman JR, Fredericks WJ, Jensen DE, Speicher DW, Huang XP, et al. (1996)
KAP-1, a novel corepressor for the highly conserved KRAB repression domain. Genes Dev 10: 2067–2078.
29. Vitale I, Galluzzi L, Castedo M, Kroemer G (2011) Mitotic catastrophe: a mechanism for avoiding genomic instability. Nat Rev Mol Cell Biol 12: 385– 392.
30. Kallies A, Hasbold J, Fairfax K, Pridans C, Emslie D, et al. (2007) Initiation of plasma-cell differentiation is independent of the transcription factor Blimp-1. Immunity 26: 555–566.
31. Ancelin K, Lange UC, Hajkova P, Schneider R, Bannister AJ, et al. (2006) Blimp1 associates with Prmt5 and directs histone arginine methylation in mouse germ cells. Nat Cell Biol 8: 623–630.
32. Lupo A, Cesaro E, Montano G, Izzo P, Costanzo P (2011) ZNF224: Structure and role of a multifunctional KRAB-ZFP protein. Int J Biochem Cell Biol 43: 470–473.
33. Jourdan M, Caraux A, Caron G, Robert N, Fiol G, et al. (2011) Characterization of a transitional preplasmablast population in the process of human B cell to plasma cell differentiation. J Immunol 187: 3931–3941. 34. Hose D, Reme T, Hielscher T, Moreaux J, Messner T, et al. (2011) Proliferation
is a central independent prognostic factor and target for personalized and risk-adapted treatment in multiple myeloma. Haematologica 96: 87–95. 35. Greipp PR, Leong T, Bennett JM, Gaillard JP, Klein B, et al. (1998)
Plasmablastic morphology-An independent prognostic factor with clinical and laboratory correlates: eastern cooperative oncology group (ECOG) myeloma trial E9486 report by the ECOG myeloma laboratory group [In Process Citation]. Blood 91: 2501–2507.
36. Zhang XG, Gaillard JP, Robillard N, Lu ZY, Gu ZJ, et al. (1994) Reproducible obtaining of human myeloma cell lines as a model for tumor stem cell study in human multiple myeloma. Blood 83: 3654–3663.
37. Gu ZJ, Vos JD, Rebouissou C, Jourdan M, Zhang XG, et al. (2000) Agonist anti-gp130 transducer monoclonal antibodies are human myeloma cell survival and growth factors. Leukemia 14: 188–197.
38. Rebouissou C, Wijdenes J, Autissier P, Tarte K, Costes V, et al. (1998) A gp130 Interleukin-6 Transducer-Dependent SCID Model of Human Multiple Myeloma. Blood 91: 4727–4737.
39. De Vos J, Thykjaer T, Tarte K, Ensslen M, Raynaud P, et al. (2002) Comparison of gene expression profiling between malignant and normal plasma cells with oligonucleotide arrays. Oncogene 21: 6848–6857.
40. Cremer FW, Bila J, Buck I, Kartal M, Hose D, et al. (2005) Delineation of distinct subgroups of multiple myeloma and a model for clonal evolution based on interphase cytogenetics. Genes Chromosomes Cancer 44: 194–203. 41. Barlogie B, Tricot G, Rasmussen E, Anaissie E, van Rhee F, et al. (2006) Total
therapy 2 without thalidomide in comparison with total therapy 1: role of intensified induction and posttransplantation consolidation therapies. Blood 107: 2633–2638.
42. Moreaux J, Cremer FW, Reme T, Raab M, Mahtouk K, et al. (2005) The level of TACI gene expression in myeloma cells is associated with a signature of microenvironment dependence versus a plasmablastic signature. Blood 106: 1021–1030.
43. Jourdan M, Mahtouk K, Veyrune JL, Couderc G, Fiol G, et al. (2005) Delineation of the roles of paracrine and autocrine interleukin-6 (IL-6) in myeloma cell lines in survival versus cell cycle. A possible model for the cooperation of myeloma cell growth factors. Eur Cytokine Netw 16: 57–64. 44. Reme T, Hose D, De Vos J, Vassal A, Poulain PO, et al. (2008) A new method
for class prediction based on signed-rank algorithms applied to Affymetrix microarray experiments. BMC Bioinformatics 9: 16.
45. Tanguy Le Carrour SA, Sylvie Tondeur, Ludovic Lhermitte, Ned Lamb, Thierry Reme, et al. (2010) Amazonia!: An Online Resource to Google and Visualize Public Human whole Genome Expression Data. The Open Bioinformatics Journal 4 5–10.