HAL Id: hal-00822454
https://hal.archives-ouvertes.fr/hal-00822454
Submitted on 14 May 2013HAL is a multi-disciplinary open access archive for the deposit and dissemination of
sci-L’archive ouverte pluridisciplinaire HAL, est destinée au dépôt et à la diffusion de documents
A Search for the Free Inner Core Nutation in VLBI Data
Sébastien Lambert, Séverine Rosat, Xiaoming Cui, Yves Rogister, Christian
Bizouard
To cite this version:
Sébastien Lambert, Séverine Rosat, Xiaoming Cui, Yves Rogister, Christian Bizouard. A Search for the Free Inner Core Nutation in VLBI Data. 7th IVS General Meeting, Mar 2012, Madrid, Spain. pp.370-374. �hal-00822454�
A Search for the Free Inner Core Nutation in VLBI Data
S´ebastien Lambert 1 , S´everine Rosat2 , Xiaoming Cui 3 , Yves Rogister 2 , Christian Bizouard 11) Observatoire de Paris, SYRTE, CNRS, Universit´e Pierre et Marie Curie, France 2) IPGS, CNRS, Universit´e de Strasbourg (EOST), France
3) State Key Laboratory of Geodesy and Earth’s Dynamics, Institute of Geodesy and Geophysics,
Chinese Academy of Sciences, Wuhan, China
Contact author: S´ebastien Lambert, e-mail: [email protected]
Abstract
We investigate the time-frequency spectrum of VLBI nutation series, including operational series released by IVS analysis centers. Especially, we focus on the interannual, prograde band, where the signal associated with the free inner core nutation (FICN) should be searched. We do not conclude on the detection of the FICN. However, we point out some significant but unexplained structures within the FICN frequency band. One should investigate whether their origin is geophysical or they are artifacts due to VLBI analysis methods or reference frame effects.
1. Introduction
For an elastic Earth in hydrostatic equilibrium with a liquid outer core and a solid inner core, one can expect a resonance in the nutation due to the free inner core nutation (FICN) at 475 days in space. Mathews et al. (2002) were the first to report the observation in the VLBI data of a resonance at a period of approximately 1034 days supposedly caused by the FICN. To fill the gap between the observation and prediction of the FICN period for a hydrostatic elastic Earth model, Mathews et al. (2002), Mathews & Guo (2005) and Koot et al. (2010) have invoked a visco-magnetic coupling between the inner and outer cores, and Koot & Dumberry (2011) have investigated the influence of the viscosity of the inner core on the FICN. Besides, Rogister & Valette (2009) have suggested that the dynamics of a stratified liquid core can give birth to a double FICN with eigenperiods ranging from hundreds to thousands of days.
Plausible excitation sources for both the free core nutation (FCN) and FICN are, according to Dehant et al. (2005), the atmosphere and the oceans, which could excite the FICN to an amplitude of a few tens of microseconds of arc (µas). It could be therefore detectable observationally as the observation precision is now of this order of magnitude.
Nevertheless, nutation time series obtained by the analysis of VLBI delays can contain signifi-cant structures due to, e.g., network effects or unmodeled/mismodeled geophysical and astronomi-cal phenomena, and are sometimes very sensitive to the parameterization or analysis configuration. Since they could mimic an FICN signal, such artifacts in the time series could lead to wrong conclu-sions. In this study we aim at analyzing the interannual prograde band of the recent nutation data to point out the significant signal, possibly resulting from the analysis configuration or geophysical phenomena, that should be further investigated.
2. The Nutation Offsets
The IAU 2000A nutation model of Mathews et al. (2002) is not perfect. One expects therefore the VLBI-estimated offsets to IAU 2000A contain a non negligible signal arising from unmodeled or mismodeled tidal terms (e.g., at 18.6-year or semi-annual periods) or other geophysical contribution including the atmosphere (Bizouard et al. 1998, Yseboodt et al. 2002, Dehant et al. 2003, Vondr´ak et al. 2005, Lambert 2006). The amplitude- and phase-variable retrograde FCN was not included in IAU 2000A and is therefore also left in the nutation offsets. A better, but empirical, modeling of the nutation can be achieved by (i) adjusting a retrograde, 430-day period signal with variable amplitude and phase (on a 2-year sliding window displaced by 1 year) to account for the FCN, and (ii) fitting a number of tidal terms of fixed period and phase to the nutation offsets. A list of 42 tidal terms is provided in Herring et al. (2002). The atmospheric contribution to the nutation remains unpredictable due to strong inconsistencies in the global circulation models at diurnal frequencies (de Viron et al. 2005) and will therefore not be considered here.
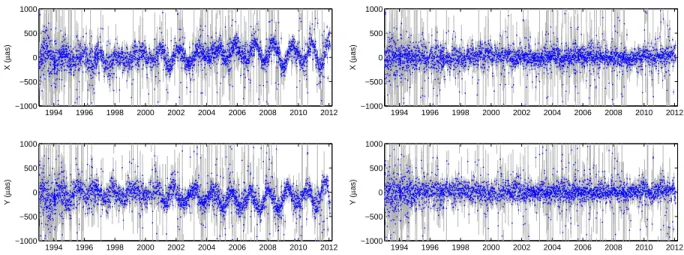
The tidal term and time-variable FCN amplitudes and phases were fitted by weighted least-squares to the whole data set (i.e., opa2012a Earth orientation series released by the Observatoire de Paris, designed OPA hereafter). The solution is shown in Fig. 1 before (left) and after (right) fitting. The residuals are generally flat. A slight variation over few years shows up in both X and Y of amplitude below 100 µas, but could be due to the method used to remove the FCN. This point should be further investigated by using other filtering methods.
1994 1996 1998 2000 2002 2004 2006 2008 2010 2012 −1000 −500 0 500 1000 X ( µ as) 1994 1996 1998 2000 2002 2004 2006 2008 2010 2012 −1000 −500 0 500 1000 Y ( µ as) 1994 1996 1998 2000 2002 2004 2006 2008 2010 2012 −1000 −500 0 500 1000 X ( µ as) 1994 1996 1998 2000 2002 2004 2006 2008 2010 2012 −1000 −500 0 500 1000 Y ( µ as)
Figure 1. The OPA series of nutation offsets with respect to IAU 2000A after 1993 before (left) and after (right) fitting and removal of the FCN and the tidal terms.
3. The Residual Signal in the Prograde Band
The nutation offsets after 1993 were analyzed by Morlet wavelets coded in MATLAB routines provided by C. Torrence and G. Compo (http://atoc.colorado.edu/research/wavelets), for nutation series released by various IVS operational analysis centers (Fig. 2). All data sets were obtained with the same VLBI analysis software package (Calc/Solve) with very slight differences in the
GSF series (gsf2011b solution) defines it in such a manner that the positions and velocities of a subset of 34 strong stations have no net translation or rotation with respect to their positions and velocities as reported in the ITRF 2008 catalog. In contrast, the USN (usn2011a), BKG (bkg00013) and OPA analyses tie the TRF to the VTRF 2008 catalog using 26 stations only. The four analysis centers define the celestial reference france (CRF) by applying a no-net rotation condition to the 295 ICRF2 defining sources. However, BKG estimates all sources as global parameters (i.e., the source positions are estimated in average over almost 30 years), whereas USN downgrades 713 poorly observed sources as session parameters, and even eliminates 135 sources with bad data. GSF and OPA estimate all source coordinates as global parameters except a the 39 most unstable ICRF2 sources whose coordinates are estimated as session parameters. Finally, though OPA, GSF and USN processed almost all available VLBI sessions since 1979 (including smaller networks and sessions not primarily dedicated to Earth orientation monitoring), BKG did not treat a number of sessions which are considered as not suitable for reliable Earth orientation determination by the IVS analysis coordinator.
For the purpose of the wavelet algorithm, the series were regularized by a moving average every 10 days. Some significant structures show up in every spectrum: strong power in the early years above 1000 days, increasing power in the FICN band after 2008 (this might be a side effect), and some power around 2004 at a period of about 600 days.
However, even though the analysis strategies are very close one each other, some differences appear at long periods (e.g., the strong pattern before 2002 at periods longer than 1000 days is weaker in USN series, and the power distribution in the band 300–500 days between 2002 and 2006 is different in each data set).
4. The Signature of the Unstable Radio Sources
Estimates of nutation by VLBI are especially sensitive to the realization of the CRF. For instance, Feissel-Vernier et al. (2005) showed that some power in the FICN band was associated with an intense activity of the radio sources that resulted in significant displacements of their radio centers. The CRF is materialized by the coordinates of more than 4000 quasars whose coordinates are estimated during the analysis. The coordinates of a set of “defining sources”, chosen for their time stability, are constrained by a no-net rotation condition. Generally, most of the quasars’ coordinates are estimated as global parameters. Nevertheless, since some quasars are very unstable, the analyst can decide to downgrade their coordinates to session parameters. Especially, during the ICRF2 work (Fey et al. 2010), we isolated 39 unstable quasars having a large observational history (observed in more than 1000 sessions).
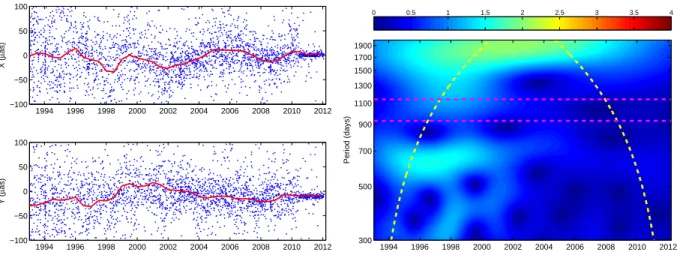
To check whether the signal present in the wavelet spectrum is due to the celestial reference frame instability, we ran two solutions: a first one where the 39 unstable radio source coordinates are estimated as global parameters, and a second one where these source coordinates are estimated as session parameters (i.e., identical to the OPA solution shown in Fig. 2). Time series and spectrum of the difference between the two nutation series are displayed in Fig. 3. A significant variation shows up in both X and Y at the level of a few tens of µas. However, the wavelet spectrum shows that these variations do not explain those mentioned in the nutation series in Section 3.
Period (days) BKG 1994 1996 1998 2000 2002 2004 2006 2008 2010 2012 300 500 700 900 1100 1300 1500 1700 1900 0 2 4 6 8 10 12 14 16 18 20 Period (days) GSF 1994 1996 1998 2000 2002 2004 2006 2008 2010 2012 300 500 700 900 1100 1300 1500 1700 1900 0 2 4 6 8 10 12 14 16 18 20 Period (days) OPA 1994 1996 1998 2000 2002 2004 2006 2008 2010 2012 300 500 700 900 1100 1300 1500 1700 1900 0 2 4 6 8 10 12 14 16 18 20 Period (days) USN 1994 1996 1998 2000 2002 2004 2006 2008 2010 2012 300 500 700 900 1100 1300 1500 1700 1900 0 2 4 6 8 10 12 14 16 18 20
Figure 2. Wavelet spectra of four operational nutation series. The horizontal dotted lines show the FICN frequency band around 1034 days following Mathews et al. (2002). Amplitude unit: µas.
5. Concluding Remarks
The prograde band of the nutation series shows significant structures at the level of a few tens of µas. These structures are similar for all series analyzed in this work and produced by four distinct analysis centers (that used, however similar observations!). These structures are likely connected to (i) network effects, i.e., inconsistencies between session-wise TRF and CRF, (ii) processes occurring in the external fluid layers, especially the atmosphere, and (iii) unmodeled nutations, possibly including the free motion associated with the inner core. As regards to the first item, the instability of the CRF seems to produce an effect which is much smaller than the observed structures. As for point (ii), the contribution of the atmospheric angular momentum variations to the nutation at diurnal time scales could dominate. Unfortunately, the quality of atmospheric data at diurnal frequencies is not good enough to allow one to remove properly the atmospheric contribution to the nutation. Investigating the point (iii) (and directly observing the
1994 1996 1998 2000 2002 2004 2006 2008 2010 2012 −100 −50 0 50 100 X ( µ as) 1994 1996 1998 2000 2002 2004 2006 2008 2010 2012 −100 −50 0 50 100 Y ( µ as) Period (days) 1994 1996 1998 2000 2002 2004 2006 2008 2010 2012 300 500 700 900 1100 1300 1500 1700 1900 0 0.5 1 1.5 2 2.5 3 3.5 4
Figure 3. Nutational signature of the unstable radio sources (left), and prograde band of its wavelet spectrum (right). The horizontal dotted lines show the FICN frequency band following Mathews et al. (2002). Amplitude unit: µas.
increase of the accuracy of VLBI results in the future.
References
[1] Bizouard, C., A. Brzezi´nski, S. D. Petrov, J. Geod., 72, 561–577, 1998
[2] Dehant, V., M. Feissel-Vernier, O. de Viron, et al., JGR, 108, doi:10.1029/2002JB001763, 2003 [3] Dehant, V., O. de Viron, M. Greff-Lefftz, A&A, 438, 1149–1161, 2005
[4] Feissel-Vernier, M., C. Ma, A.-M. Gontier, C. Barache, A&A, 438, 1141–1148, 2005
[5] Fey, A. L., Gordon, D. G., Jacobs, C. S., et al. 2010, International Earth Rotation and Reference Systems Service (IERS) Technical Note 35, Bundesamts f¨ur Kartographie und Geod¨asie, Frankfurt am Main
[6] Herring, T. A., P. M. Mathews, B. A. Buffett, JGR, 107, doi:10.1029/2001JB000165, 2002 [7] Koot, L., M. Dumberry, A. Rivoldini, et al., Geophys. J. Int., 182, 1279–1294, 2010 [8] Koot, L., M. Dumberry, Earth Planet. Sci. Lett., 308, 343–349, 2011
[9] Lambert, S., A&A, 457, 717–720, 2006
[10] Mathews, P. M., T. A. Herring, B. A. Buffett, JGR, 107, doi:10.1029/2001JB000390, 2002 [11] Mathews, P. M., J. Y. Guo, JGR, 110, doi:10.1029/2003JB002915, 2005
[12] Rogister, Y., B. Valette, Geophys. J. Int., 176, 368–388, 2009
[13] de Viron, O., G. Schwarzbaum, F. Lott, V. Dehant, JGR, 110, doi:10.1029/2005JB003761, 2005 [14] Vondr´ak, J., R. Weber, C. Ron, A&A, 444, 297–303, 2005