Decarbonizing the Indian Power Sector by 2037: Evaluating Different
Pathways that Meet Long-Term Emissions Targets
by
Iván Rudnick García
Bachelor in Engineering SciencesCivil Engineer of Industry
Pontificia Universidad Católica de Chile, 2011 Submitted to the Institute for Data, Systems, and Society in partial fulfillment of the requirements for the degree of
Master of Science in Technology and Policy at the
MASSACHUSETTS INSTITUTE OF TECHNOLOGY September 2019
© 2019 Massachusetts Institute of Technology. All rights reserved.
Author
Institute for Data, Systems, and Society August 09, 2019 Certified by
Audun Botterud Principal Research Scientist, MIT Laboratory for Decisions and Information Systems Thesis Supervisor Certified by
Pablo Duenas-Martinez Research Scientist, MIT Energy Initiative Thesis Supervisor Certified by
Carlos Batlle Research Scholar, MIT Energy Initiative Thesis Supervisor Accepted by
Noelle Selin Director, Technology and Policy Program Associate Professor, Institute for Data, Systems, and Society and Department of Earth, Atmospheric and Planetary Sciences
Decarbonizing the Indian Power Sector by 2037: Evaluating Different
Pathways that Meet Long-Term Emissions Targets
by
Iván Rudnick García
Submitted to the Institute for Data, Systems, and Society in partial fulfillment of the requirements for the degree of
Master of Science in Technology and Policy
ABSTRACT
The Indian government is aiming to reduce carbon emissions intensity in the power sector through incentivizing the addition of renewables sources into the grid. India has set the goal that at least 40% of total power capacity must be non-fossil fuel-based by 2030 with more ambitious goals expected to be set for 2040 and 2050. To meet the decarbonization goals by the next decades, the central government is promoting a large-scale development of wind turbines and solar photovoltaic power plants.
Achieving long-term decarbonization in the Indian power sector presents several challenges to the current electric grid. For example, the current generation mix relies heavily on coal power plants such that integrating solar and wind plants (i.e., variable renewable energy (VRE) sources) adds several layers of economic and technical complexity. Other challenges include improving the national quality of service and reducing local emissions. The overall effect is amplified by India’s rapidly increasing electricity consumption, which has necessitated the build-out of additional capacity to meet the future load.
The following thesis analyzes potential pathways to the decarbonization of India’s grid by 2037. The study explores 24 different scenarios, each considering different technology costs (solar, wind, and storage), setting different gas prices, and defining different emissions limits. The analysis uses the capacity expansion model “GenX” developed internally at MIT. GenX is a deterministic capacity expansion planning model. The model optimizes generation, storage, and transmission capacity expansion decisions and dispatch of generation and storage resources on an hourly basis to meet the electricity demand in a year, at the lowest cost possible.
The study successfully identifies the trade-offs between system costs, global emissions, and local emissions levels for different scenarios, enabling the assessment of the long-term impact of large infrastructure decisions in the electric power sector. Of the findings: (1) Scenarios without emission limits, continue to be dominated by coal and emissions rose relative to 2017 levels. (2) Scenarios with emissions limits had an increased share of VRE sources, greater than 50% in some scenarios. (3) Some scenarios with high VRE penetration required significant dispatchable capacity that could ramp up suddenly to meet net load, reaching 270 GW in peak load days. (4) Gas-based plants competed directly with storage technologies; both technologies are flexible and can adapt to abrupt changes in VRE generation. However, as storage costs rise, gas plants begin to dominate the generation mix. There are some challenges in developing new gas plants, as plants cycling increase and the gas fleet is underutilized in some scenarios.
The thesis also addresses the policy implications for each scenario. To reduce greenhouse gasses emissions, setting emissions limits can be hard to enforce. Imposing a carbon tax is ideal, although
it is hard to set the right price. Setting a non-fossil fuel portfolio standard can not necessarily help reduce emissions to a specific target. Many regulatory changes are required to encourage higher levels of VRE penetration such as promoting better coordination between state and regional system operators, reducing uncertainty in the use of the gas infrastructure, and promoting the development of storage technologies.
Thesis Supervisor: Audun Botterud
Title: Principal Research Scientist, MIT Laboratory for Decisions and Information Systems
Thesis Supervisor: Pablo Duenas-Martinez Title: Research Scientist, MIT Energy Initiative
Thesis Supervisor: Carlos Batlle
Title: Research Scholar, MIT Energy Initiative
Acknowledgments
This thesis would not have been possible without the help and support of many individuals. I would like to thank my thesis supervisors, Dr. Audun Botterud, Dr. Carlos Batlle, and Dr. Pablo Duenas-Martinez, for their guidance and support in this research project. I am indebted to their help in understanding power markets, working with capacity expansion models, and dealing with optimization challenges. I would also like to thank Professor Ignacio Perez Arriaga, Professor Christopher Knittel, Mackay Miller, and Dr. Karen Tapia-Ahumada. They provided me assistance during my two years at MIT.
I am greatly indebted to the Exxon Mobil people, Dr. Dimitri Papageorgiou, Dr. Michael Harper, Dr. Srinivasan Rajagopalan, and Dr. Bryan K. Mignone. They always provided relevant feedback, which was vital to the success of this research. Dimitri, in particular, was always available to have meetings and discuss all relevant research items and provided assistance if needed. I am thankful to Karthik Ganesan from the Council of Energy, Environment and Water for providing me data sources and being actively involved in the research discussion. Karthik was available at any time to discuss the main assumptions behind the research.
I am grateful to Nestor Sepulveda, Dr. Jesse Jenkins, Dr. Dharik Mallapragada, and Aurora Eddington. I thank the former two for creating GenX and teaching me how to use it, and the latter two for helping me run the software.
My sincere gratitude to the Fulbright Program and MITEI, for providing me funding, helping me apply to MIT and providing me resources to conduct my research. I appreciate the assistance of the Supercloud team, in particular, Lauren Milechin, who provided me the resources to effectively complete my optimization runs.
I am also especially grateful to all my friends at MIT and my TPP classmates for making my time at MIT, amazing. Additionally, I want to thank the faculty and staff that make TPP possible, in particular to Barbara DeLaBarre and Ed Ballo.
Finally, I feel immensely grateful to my family. My parents have supported me throughout my entire life and have taught me the values I feel greatly proud of. My parents-in-law for providing constant support and affection. And last but not least, I would like to thank and dedicate this work to my wife Valentina, and my newborn daughter, Sara. Thank you, Valentina, for leaving your work and life behind in Chile to follow me to Boston and providing me constant and unconditional support during this two-year journey.
Table of Contents
ABSTRACT ... 3 Table of Contents ... 6 Table of Figures ... 8 Table of Tables ... 12 Table of Equations ... 13 1 Introduction ... 14 1.1 Motivations ... 14 1.2 Background... 15 1.3 Research question ... 16 1.4 Thesis organization... 162 Indian power sector: past, present and future challenges ... 18
2.1 Description of the Indian power system ... 18
2.1.1 Indian power sector ... 18
2.1.2 Indian generation mix: actual capacity and potential development. ... 20
2.2 Transforming the Indian power sector: regulatory changes in past decades ... 23
2.3 National Electricity Plans: authorities are pushing for VRE sources ... 25
2.4 Moving forward: major challenges ahead ... 27
3 Studies of decarbonization plans in India and the world ... 31
3.1 Studies of decarbonization in developed countries ... 31
3.2 Studies of decarbonization in India ... 32
3.3 Optimization tools often used in power systems modeling ... 34
4 Understanding the Indian system’s operation ... 37
4.1 Thermal fleet operation: below international standards ... 38
4.2 Hydro sources: declining contribution to the generation mix ... 41
4.3 VRE sources: spread out and with low capacity factors ... 44
5 Methodology used ... 45
5.1 Optimal generation mix under centralized decision-making. ... 45
5.2 Definition of scenarios ... 45
5.2.1 Defining base scenarios ... 45
5.2.1 Additional scenarios: different policies to achieve emissions targets ... 48
5.3 Using GenX, a capacity expansion model ... 49
5.3.1 Description of the original existing model... 49
5.3.2 Adjustments to original GenX code considered in this study. ... 50
5.4 Data assumptions ... 51
5.4.1 Modeling the Indian system ... 51
5.4.2 Load profiles used ... 52
5.4.3 Technologies considered in the analysis and potential development ... 54
5.4.4 Definition of power plant clusters ... 57
5.4.5 Economic and technical assumptions for generation plants ... 58
5.4.6 Fuel costs, emissions, water consumption, and water withdrawal assumptions ... 61
5.4.8 VRE production profiles and hydro reservoir inflows ... 63
6 Results ... 67
6.1 2037 results under 24 base scenarios ... 67
6.1.1 Optimal generation mix for 24 base scenarios ... 67
6.1.1 Energy curtailment, unserved energy, and provision of reserves ... 70
6.1.2 CO2, NOx and SO2 emissions ... 73
6.1.3 Gas consumption, water withdrawal and water consumption ... 75
6.1.4 Hourly generation dispatch on critical days ... 76
6.1.1 Operation of thermal fleet ... 80
6.2 Results under additional policy scenarios ... 84
6.2.1 Designing a carbon tax ... 84
6.2.2 Setting non-fossil fuel portfolio standards ... 86
7 Sensitivity analysis ... 89
7.1 Modeling with integer UC (MILP approach) ... 89
7.2 Including gas-based OCGT as a potential generation source ... 91
7.3 Changes in load growth ... 94
7.4 Eliminating transmission constraints ... 95
7.5 Reducing long term gas price ... 96
7.6 Modeling 90 GW of behind-the-meter diesel generators... 97
7.7 Evaluating the effect of a monsoon ... 99
8 Conclusions and discussion ... 101
8.1 Main results ... 101
8.2 Policy discussion ... 102
8.3 Further work ... 103
9 Bibliography ... 104
A. Appendix: forced and planned outages ... 110
B. Appendix: load profiles ... 112
C. Appendix: installed capacity and installation limits per technology for each region . 116 D. Appendix: VRE production profiles per region ... 117
Table of Figures
Figure 2-1: Map of the Indian power system showing the five interconnected regions. ... 19
Figure 2-2: Annual electricity demand per region for the period 2008-09 to 2017-18. ... 20
Figure 2-3: National installed capacity at the end of each fiscal year in the period between years 2008-09 and 2017-18. ... 22
Figure 2-4: Generation per source for the years 2008-09 to 2017-18. ... 22
Figure 2-5: Milestones in the development of power markets in India. ... 23
Figure 2-6: Structure of the Indian Electricity Market. ... 24
Figure 2-7: Type of contracts in the wholesale market. ... 25
Figure 2-8: 13th National Electricity Plan: 2017-2022. ... 26
Figure 2-9: Targeted v/s installed solar and wind capacity. ... 26
Figure 2-10: Actual and forecasted electricity demand... 28
Figure 2-11: Average daily power outages in Indian cities between November 2015 and October 2016. ... 29
Figure 2-12: Percentage of non-served energy and non-served peak load. ... 30
Figure 3-1: Examples of model resolution options for capacity expansion models. ... 34
Figure 4-1: Peak Load, Installed Capacity, and Firm Capacity at the end of each fiscal year between 2008-09 and 2017-18. ... 38
Figure 4-2: Evolution of installed capacity and capacity factors for thermal plants. ... 39
Figure 4-3: Planned outages, forced outages, and availability of the coal fleet. ... 40
Figure 4-4: Gas supplied to gas-based plants v/s gas required. ... 41
Figure 4-5: Evolution of installed capacity and capacity factors of run of the river plants. ... 42
Figure 4-6: Seasonality of run of river plants. ... 42
Figure 4-7: Evolution of installed capacity and capacity factors for reservoir plants ... 43
Figure 4-8: Daily evolution of energy stored in the Bhakra reservoir in the period between September 2017 and August 2018. ... 43
Figure 4-9 : Evolution of installed capacity and capacity factors for wind, solar PV, biomass, and small hydro plants. ... 44
Figure 5-1: Pivotal dimensions to define future power systems. ... 46
Figure 5-2: Dimensions considered in the study. ... 47
Figure 5-3: Indian transmission system in 2037 modeled in the analysis. ... 51
Figure 5-4: Estimated distribution of electricity demand per hour of the year 2036-37. ... 54
Figure 5-5: Estimated average daily load for the system per month in the year 2036-37. ... 54
Figure 5-6: Distribution of solar production profile in the western region for each hour of the day. ... 64
Figure 5-7: Average hourly solar profile per trimester in the western region. ... 64
Figure 5-8: Distribution of wind production profile in the western region for each hour of the day. ... 65
Figure 5-9: Average wind profile per trimester in the western region. ... 65
Figure 5-10: Capacity factor used for run of the river plants. ... 66
Figure 5-11: Hourly inflows used for reservoir plants... 66
Figure 6-1: 2037 capacity additions and retirements by generator type across different scenarios. ... 68
Figure 6-2: 2037 total installed capacity by generator type across different scenarios. ... 68
Figure 6-4: 2037 generation share per generator type across different emissions limits scenarios.
... 70
Figure 6-5: 2037 total costs across different scenarios. ... 70
Figure 6-6: Renewable energy curtailment across all scenarios. ... 71
Figure 6-7: Histogram summarizing hourly renewable generation curtailed, for the scenario with Low VRE capex and Low Storage costs and gas price at $11/MMBtu. ... 71
Figure 6-8: Total non-served energy and maximum non-served load across all scenarios. ... 72
Figure 6-9: Total regulating reserves (up and down) contributed throughout the year per technology across all scenarios. ... 72
Figure 6-10: Total spinning reserves (up and down) contributed throughout the year per technology across all scenarios. ... 72
Figure 6-11: 2037 CO2 emissions across all scenarios. ... 73
Figure 6-12: 2037 SO2 emissions across all scenarios. ... 73
Figure 6-13: 2037 NOx emissions across all scenarios. ... 74
Figure 6-14: Marginal and average CO2 abatement costs - 1,275 million tons emissions limit. .... 74
Figure 6-15: Marginal and average CO2 abatement costs - 621 million tons emissions limit. ... 74
Figure 6-16: CO2 emissions over total generation across all scenarios. ... 75
Figure 6-17: 2037 gas consumption across different scenarios. ... 76
Figure 6-18: 2037 water withdrawal and consumption across all scenarios. ... 76
Figure 6-19: Dispatch example on peak net load curve day (October 16th) for a scenario with an emissions limit of 621 million tons of CO2, Low VRE capex, Low Storage costs and gas price at $11/MMBtu. ... 77
Figure 6-20: Dispatch example on minimum net load curve day (April 28th) for a scenario with an emissions limit of 621 million tons of CO2, Low VRE capex, Low Storage costs and gas price at $11/MMBtu. ... 78
Figure 6-21: Dispatch example on peak net load curve day (October 16th) for a scenario with an emissions limit of 621 million tons of CO2, Low VRE capex, High Storage costs and gas price at $8/MMBtu. ... 79
Figure 6-22: Dispatch example on minimum net load curve day (June 22th) for a scenario with an emissions limit of 621 million tons of CO2, Low VRE capex, High Storage costs and gas price at $8/MMBtu. ... 79
Figure 6-23: Dispatch example on coal maximum ramp day (August 24th) for a scenario with an emissions limit of 1,275 million tons of CO2, Low VRE capex, High Storage costs and gas price at $11 /MMBtu. ... 80
Figure 6-24: Capacity factors for dispatchable technologies across all scenarios. ... 81
Figure 6-25: Histogram summarizing coal fleet capacity factors over 8,760 hours. Scenarios with Low VRE capex, High Storage costs, and gas price at $11/MMBtu. ... 82
Figure 6-26: Histogram summarizing gas fleet capacity factors over 8,760 hours. Scenarios with High VRE capex, High Storage costs, and gas price at $8/MMBtu. ... 82
Figure 6-27: Histogram summarizing behind-the-meter backup generators capacity factors over 8,760 hours. Scenarios with Low VRE capex, High Storage costs, and gas price at $11/MMBtu. ... 83
Figure 6-28: Average number of starts per coal plant per year across all scenarios. ... 83
Figure 6-29: Average number of starts per gas-based plant per year across all scenarios. ... 84
Figure 6-30: 2037 installed capacity by generator type under different cost scenarios and CO2 taxes. ... 85
Figure 6-31: 2037 generation by generation type under different costs scenarios and CO2 taxes. 85 Figure 6-32: 2037 CO2 emissions under different costs scenarios and CO2 taxes. ... 86
Figure 6-33: 2037 installed capacity by generator type under different cost scenarios and
non-fossil fuel shares. ... 87
Figure 6-34: 2037 generation by generation type under different costs scenarios and non-fossil fuel shares. ... 87
Figure 6-35: Comparing CO2 emissions and non-fossil fuel shares when imposing moderate emissions limits (1,275 million tons) and moderate non-fossil fuel share (60%). ... 88
Figure 6-36: Comparing CO2 emissions and non-fossil fuel shares when imposing stringent emissions limits (621 million tons) and high non-fossil fuel share (80%). ... 88
Figure 6-37: 2037 CO2 emissions under different costs scenarios and non-fossil fuel shares. ... 88
Figure 7-1: Using Integer UC v/s Linear UC. Comparing the generation mix and capacity mix. 89 Figure 7-2: Including OCGT as a potential source. Comparing the generation mix and capacity mix. ... 91
Figure 7-3: Including OCGT as a potential source. Comparing capacity factors of coal, CCGT, and OCGT fleet. ... 92
Figure 7-4: Comparing the effect of including OCGT. Dispatch example on peak net load curve day (October 16th) for a scenario with an emissions limit of 621 million tons of CO2, High VRE capex, High Storage costs and gas price at $8/MMBtu. ... 93
Figure 7-5: Increasing 2037 load by 30%. Comparing the generation mix and capacity mix. ... 94
Figure 7-6: Eliminating transmission constraints. Comparing the generation mix and capacity mix. ... 95
Figure 7-7: Reducing long term price to $6/MMBtu. Comparing the generation mix and capacity mix. ... 96
Figure 7-8: Histogram summarizing gas fleet capacity factors over 8,760 hours. Scenarios with High VRE capex, High Storage costs, and gas price at $6/MMBtu. ... 96
Figure 7-9: Modelling 90 GW in behind-the-meter backup generators. Comparing the generation mix and capacity mix. ... 97
Figure 7-10: Comparing generation dispatch when including 10 and 90 GW of backup generators. Dispatch example on peak net load curve day (October 16th) for a scenario with an emissions limit of 621 million tons of CO2, Low VRE capex, High Storage costs and gas price at $11/MMBtu. ... 98
Figure 7-11: Evaluating the effect of a monsoon season on solar production. Comparing the generation mix and capacity mix. ... 99
Figure 7-12: Comparing generation dispatch when including the effect of a monsoon season on solar production. Dispatch example on July 3rd for a scenario with an emissions limit of 621 million tons of CO2, Low VRE capex, Low Storage costs, and gas price at $11/MMBtu. ... 100
Figure A-1: Causes behind forced and planned outages of the coal fleet. ... 110
Figure A-2: Coal generation lost due to coal shortage. ... 110
Figure A-3: Causes behind forced and planned outages of the gas fleet. ... 111
Figure A-4: Causes behind forced and planned outages of the nuclear fleet. ... 111
Figure B-1: Distribution of regional electricity demand per hour of the day for the year 2036-37. ... 114
Figure B-2: Regional average daily load per month in the year 2036-37. ... 115
Figure C-1: Installed capacity by 2017 v/s installation limits of VRE sources. ... 116
Figure C-2: Installed capacity by 2017 v/s installation limits of storage technologies. ... 116
Figure C-3: Installed capacity by 2017 v/s installation limits of dispatchable technologies. ... 116
Figure D-1: Distribution of solar production profile per region for each hour of the day. ... 117
Figure D-3: Distribution of wind production profile per region for each hour of the day... 118 Figure D-4: Average wind profile per trimester for each region. ... 118
Table of Tables
Table 3-1: Model resolution adopted in existing Indian studies. ... 36
Table 5-1: VRE capital cost scenarios: Assumptions for low and high VRE capital costs. ... 47
Table 5-2: Gas price scenarios: Assumptions for low and high gas prices. ... 47
Table 5-3: Storage scenarios: Assumptions for low and high batteries costs. ... 47
Table 5-4: Policy scenarios: Assumptions for emissions limits. ... 48
Table 5-5 : Additional scenarios: Implementing different policies. ... 48
Table 5-6: Total load: 2015 estimates, actual load in 2016-17, and forecasts for 2021-22 and 2036-37. ... 53
Table 5-7: Peak load: 2015 estimates, actual load in 2016-17, and forecasts for 2021-22 and 2036-37. ... 53
Table 5-8: Technologies considered in the analysis. ... 56
Table 5-9: Installed capacity and total installation limits ... 57
Table 5-10: Clusters considered in the analysis. ... 58
Table 5-11: Investment and operational cost assumptions. ... 59
Table 5-12: Technical assumptions for dispatchable plants. ... 60
Table 5-13: Technical assumptions for VRE sources. ... 60
Table 5-14: Technical assumptions for storage technologies. ... 61
Table 5-15: Fuel cost and emissions assumptions. ... 61
Table 5-16: Water withdrawal and consumption rates. ... 62
Table 5-17: Reliability requirements. ... 62
Table 5-18: Reserves contribution and cost for providing regulating reserves... 63
Table 7-1: Using Integer UC v/s Linear UC. Comparing total costs and CO2 emissions. ... 90
Table 7-2: Including OCGT as a potential source. Comparing total costs. ... 92
Table 7-3: Increasing 2037 load by 30%. Comparing total costs and CO2 emissions. ... 94
Table 7-4: Eliminating transmission constraints. Comparing total costs and CO2 emissions. ... 95
Table B-1: Original source of load profiles per state. ... 112
Table B-2 : Peak load: comparison between 2015 estimates and actual load. ... 113
Table of Equations
Equation 5-1: Updated constraints for reservoir hydro including spillage variables. ... 50 Equation 5-2: Scaling 2015 load profiles... 52
1
Introduction
1.1 Motivations
Climate change, one of society’s biggest challenges, is gaining relevance in most countries’ political agendas. The fear of experiencing adverse effects that are and will be caused by the rise in temperature, not only environmentally but also socio-politically, is slowly driving countries to action. Member countries of the United Nations Framework Convention on Climate Change (UNFCC) have held several meetings and discussions on how to reduce greenhouse gas emissions (GHG), the leading cause behind the rise in temperatures. A total of 195 members of the UNFCC signed the Paris Accords by April 20161, by which they commit to implementing the necessary
measures that would keep the rise in average temperature below 2°C. Countries that ratified the Paris Accords are currently implementing policies that help them achieve committed goals. However, the challenges faced by different countries differ significantly. On the one hand, wealthy countries can allocate significant resources, financial and technical, to develop and deploy clean technologies replacing fossil-fuel-based sources. On the other hand, developing countries lack resources, while they face multiple challenges besides climate change, such as promoting economic growth, and decreasing inequality, among others.
India has a pivotal role in achieving global goals. With over 1.3 billion people, India accounts for over 17% of the global population (United States Census Bureau 2019), but emitted in 2016 roughly over 6.5% (2,075 million tons) of total GHG emissions (International Energy Agency 2018). However, the country still has a long road to achieving economic development: Indian GDP per capita is still far below the average observed of member countries of the Organization for Economic Co-operation and Development (OECD)2. If India follows an economic growth
pathway similar to that of developed countries, GHG emissions will increase significantly, surpassing the global targets. Hence, India has a difficult task, reducing its emissions intensity without compromising economic growth.
Most of the GHG emissions have historically come from the power sector, the industry that is now leading the transformation to non-carbon emitting sources. If India follows the global trend, then it will have to decarbonize its power mix, an ambitious challenge, considering that over 75% of electricity generated comes from coal-based plants and the emissions per MWh generated are far higher than in Europe and the United States3. The purpose of this thesis is to explore future
decarbonization scenarios in the power sector; under different technical and cost assumptions, what are the future power mixes that would achieve different GHG emissions targets?
1 Although, up to date, 186 countries have ratified the agreement.
2 In 2016, average GDP per capita (purchasing power parity) for OECD countries was $38,170
while in India, $5,933. (Organisation for Economic Co-Operation and Development 2019)
3 In 2016, India emitted 0.72 tons of CO2 per MWh generated, while USA and the European
1.2 Background
India is among the countries that signed the Paris Accords and submitted its Intended National Determined Contribution (INDC). India committed to reducing the emission intensity of its GDP4
between 33% and 35% by 2030, based on 2005 levels (Government of India 2015). The power sector is one of the main GHG emitters; in 2016, 52% of the total greenhouse gas emissions came from the power sector (International Energy Agency 2018). As a part of the efforts to reduce the emissions intensity, the country established a renewable portfolio target, stating that at least 40% of total power capacity must be non-fossil fuel-based5. Most of the targeted capacity will be
achieved through the development of solar photovoltaic (solar PV) and wind power plants. As a first step and in the current 13th National Electricity Plan6, elaborated by the Central Electricity
Authority (CEA)7, the central government is aiming to achieve 175 GW in renewable sources
installed capacity by March 2022, mainly composed by solar PV and wind sources8. Furthermore,
a tentative 14th National Electricity Plan is aiming to achieve 250 GW in renewables sources by
March 2027. Further development of renewable sources is expected after 2027 to meet the committed emissions reductions by 2030 as well as even further reductions after 2030.
Nevertheless, the country is facing several additional challenges that must be taken into account when aiming to decarbonize the power sector. On the one hand, the electricity consumption is increasing at high rates and is expected to triple by 20309 (Government of India 2015). The
electricity sector is also facing significant regulatory challenges as it has gradually shifted from a vertically bundled and centrally planned industry to an unbundled, market-driven sector. Local pollution, not necessarily correlated with GHG emissions, is also a major problem; seven of the ten most polluted cities in the world are in India (Thornton 2019). Local authorities are pushing to reduce local emissions. Improving reliability is also a significant challenge: power outages and low quality of service have been frequent in the past, and higher standards are expected in the future. The power system has historically relied on coal plants, and currently, nearly 75% of the electricity generated comes from this source. However, most of the plants to be developed in the following years are variable renewable energy (VRE10) sources, mainly solar PV plants and wind farms. In the
medium-term, CEA expects to have in India 60 GW of wind and 100 GW of solar by 2022, ambitious goals considering that only 12 GW and 32 GW, respectively were installed by March
4 This is calculated as the absolute of GHG emissions (measured in CO2 equivalent) divided by
the GPD (measured in Indian Rupees).
5 Capacity measured in MW, corresponded to installed capacity.
6 National Electricity Plan are five year plans elaborated by the Central Electricity Authority and
include capacity plans by the end of the five-year period
7 The Central Electricity Authority is a statutory organization that advises the government on policy
matters and formulates plans for the development of electricity system.
8 The target consist in 100 GW of solar PV, 60 GW in onshore wind, 10 GW in biomass plants
and 5 GW in mini hydro plants.
9 Based on 2012 levels.
10 Renewable energy sources are defined as solar PV, wind farms, biomass plants and hydro plants
2017. Including additional solar and wind plants introduce several challenges, mainly because these sources are variable with limited dispatchability. Solar and wind, are variable because their generation will depend on the availability of resources (e.g., solar irradiation and wind blowing) and they have limited dispatchability because plant operators do not have any control on the availability of these resources11. The high variability of irradiation and wind can lead to abrupt changes in the
plants’ power output in a matter of hours or even minutes. Thus, focusing on developing these technologies provides reliability challenges: how can India maintain or even improve the system’s reliability and at the same time, promote variable sources?
Finally, India is a country with a long way to achieve economic wealth and has limited resources. Finding a cost-effective solution to decarbonize the power sector and achieve multiple other goals is necessary. Every penny saved in the power sector can be allocated to education, healthcare, security, etc. The role of policymakers is crucial. How can policy help shape a future power system that is clean, efficient, and reliable?
1.3 Research question
This thesis explores and compares different future scenarios for the Indian power sector. The research evaluates and compares long-term decarbonization with business-as-usual scenarios under different technological assumptions. In particular, the thesis attempts to answer the following questions:
What optimal energy mix can meet the future load, considering different cost assumptions and emissions targets?
What different policies could be implemented to achieve the long-term emissions goals? How feasible are these policies?
The objective of this study is to provide an extensive analysis of different pathways that can lead to the decarbonization of the power sector. The study aims to help Indian policymakers in their design of future regulations by providing a broad analysis of how the future power system will work under different scenarios and how it will be influenced by the technological development.
1.4 Thesis organization
The structure of the thesis is as follows. First, Chapter 2 describes the Indian electric power sector, outlining the main technical and regulatory changes in the past decades and discusses the future challenges that lie ahead.
Then, Chapter 3 reviews the literature investigating the decarbonization of power systems around the world. While most research analyzes North American and European markets, only a few studies have analyzed the Indian power sector. The latter reports have mostly focused on short- and medium-term analyses and have not discussed the challenges in fully decarbonizing the Indian network in the long term.
Chapter 4 includes an analysis of the operation of the Indian power sector in the last decade. The
Indian interconnected system has unique characteristics that differentiate it from other power
systems in the United States or the European Union. Analyzing these characteristics is crucial to establishing the main assumptions and defining the different scenarios expected in the future.
Chapter 5 details the methodology used, the scenarios defined in the analysis, and the main model,
and data assumptions. The results are presented in Chapter 6 and the sensitivity analyses in
Chapter 7 . Chapter 8 discuss the results and its policy implications and includes discussion of
2 Indian power sector: past, present and future challenges
2.1 Description of the Indian power system
2.1.1 Indian power sectorIndia is a federal republic consisting of 29 states and 7 union territories. Around 1.3 billion people live in India (Central Intelligence Agency 2018), placing the country as the second most populated in the world. Despite the high population, the total electricity consumption is lower than in the United States and Europe. In fact, according to the International Energy Agency (IEA) estimates in (International Energy Agency 2018), Indian electricity consumption per capita in 2017 was around 1,000 kWh, significantly lower than in the United States or large European countries, (e.g., UK, Spain, and Italy) countries with a range between 4,000 and 5,000 kWh per capita. Total capacity by December 2018 was 350 GW, where nearly 60% came from coal plants. The installed capacity almost doubled the peak load, which was slightly over 160 GW during 2018.
The power system is divided, for planning and operational purposes, into five interconnected regions12, where each region covers multiple states. Interregional transmission links interconnect
the regions with each other. The five regions, shown in Figure 2-1 are named Northern, Western, Southern, Eastern, and Northeastern regions. Most states within each region have their own system operator, named State Load Dispatch Centers (SLDC). Each region has a Regional Load Dispatch Center that coordinates the different State Load Dispatch Centers included in the region as well as operating the intraregional links. On a national level, regions and interregional links are coordinated by the National Load Dispatch Center, controlled by Power System Operation Corporation (POSOCO), a central government-owned company. Moreover, POSOCO operates the international transmission links that trade energy between India and neighboring countries. Currently, India has transmission links with Bhutan, Bangladesh, and Nepal, while interconnections with Pakistan and Sri Lanka are in discussion (Government of India, Ministry of Power 2109) (Central Electricity Authority 2018a).
Although the Indian power grid is a single interconnected system, it is operated in a decentralized manner. Distribution companies (DISCOMs) and State Load Dispatch Centers (SLDCs) schedule plants only within the boundaries under their control, and there is little coordination among DISCOMs/SLDCs across states.
12 In addition, there are small non-interconnected regions (mainly Andaman & Nicobar Islands and
Lakshadweep) which have a small share of the total load. The five interconnected grids during the financial year 2016-2017 covered nearly 99.97% of total electricity load in the country (Central Electricity Authority 2008-2018a).
Figure 2-1: Map of the Indian power system showing the five interconnected regions. Source: Maps of India (Maps of India 2016).
Figure 2-2 shows the annual electricity demand13 per region for the period between fiscal years
2008-09 and 2017-18. Around 90% of the total load is concentrated in three main regions (North, South, and West). Around 80% of the electricity consumption comes from residential, industrial, and irrigation sectors, a percentage that is expected to remain stable in the following years (Central Electricity Authority 2017c).
13 The values shown correspond to the electricity requirement and not the demand met. There is a
percentage of demand not met due to several reasons that will be explained in the following sections, a gap that has been reduced in recent years.
Figure 2-2: Annual electricity demand per region for the period 2008-09 to 2017-18. Source: (Central Electricity Authority 2008-2018a).
2.1.2 Indian generation mix: actual capacity and potential development.
Coal14 has dominated the power mix in recent years. Figure 2-3 shows that coal represented on
average around 57% of the total installed capacity in the period between the years 2008-09 and 2017-18, while, as shown in Figure 2-4, coal plants accounted on average for over 71% of the total generation mix per year15. Most of the coal used is domestic coal, according to CEA (Central
Electricity Authority 2018a), in the fiscal year 2017-18 around 92% of total coal electricity generation was expected to be produced with domestic coal16. The potential for further increase in
14 Within the coal category, coal and lignite plants are included. Lignite is the lowest grade coal with
the least concentration of carbon. Lignite capacity represented 3% of the total installed coal capacity as of March 2017 (Central Electricity Authority 2008-2018b).
15 The aggregated capacity and generation figures presented do not consider either captive plants
or behind-the-meter backup diesel generators. Industrial firms install captive plants for their own consumption and inject the excess energy not consumed into the grid. By year 2015, the CEA estimated around 44.6 GW in installed captive plants (Central Electricity Authority 2017c). Behind-the-meter diesel generators are backup plants that small business and residential consumers install as a response to frequent blackouts experienced in many Indian cities. By 2014, the Central Advisor of the Central Electricity Regulatory Commission counted 90 GW in installed backup diesel generators (Central Electricity Regulatory Commission 2014). The presence of these generators will be addressed in the following sections.
16 Coal is a regulated industry in India and has traditionally been controlled by state and federal
coal plants is high, considering that a substantial share is met by domestic sources and taking into account that coal is a commodity with many global suppliers17.
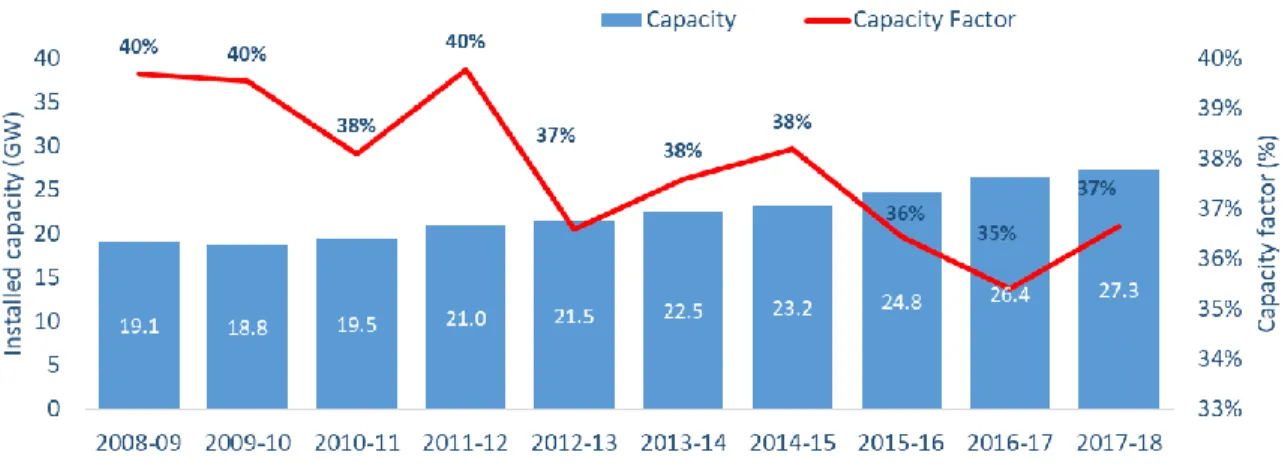
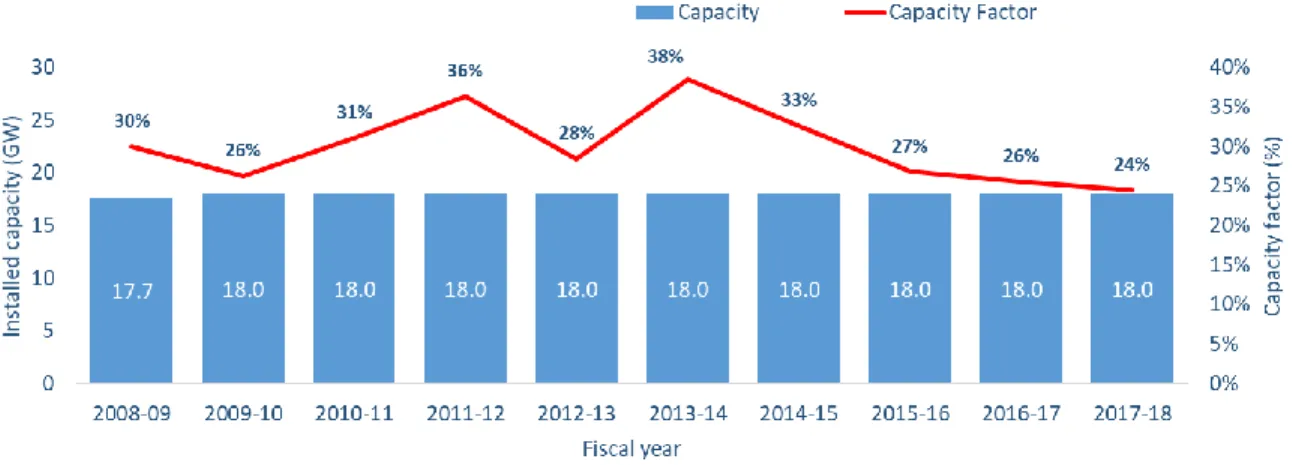
Hydro18 has lost share in the total capacity and generation mix, caused by a slow development in
new plants and a reduction in capacity factors. According to CEA in (Central Electricity Authority 2018a) and (Central Electricity Authority 2018b), there is a vast potential for further development of hydro plants. While by March 2017 there were nearly 40 GW of run of river and reservoir plants, and 11 GW were under construction, CEA estimated 95 GW of additional potential development. Regarding pumped hydro storage plants, 5 GW were operating by the end of the year 2016-17, 1 GW were under construction, and CEA estimates 97 GW in additional pumped storage potential at 63 different sites.
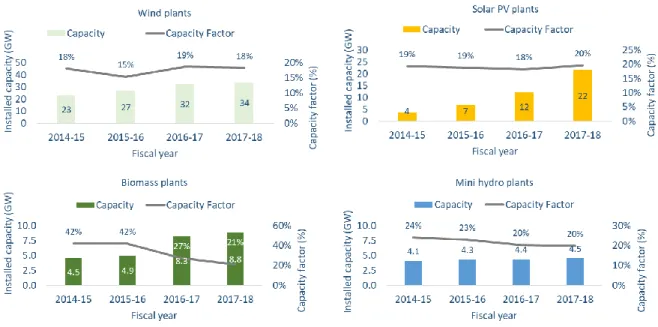
VRE sources have slowly gained share, mainly fostered by the development of solar PV plants (rooftop and utility-scale) and onshore wind farms. Indian authorities are pushing to develop the two latter technologies, in order to meet the goals set in the INDC. There is huge potential for solar and wind; the latest estimates indicate that there is potential for total development of over 700 GW of solar PV capacity19 (Central Electricity Authority 2018a) and 300 GW of onshore wind
capacity (Jethani 2017). The actual and future reductions in the investment costs of both solar panels and wind farms can continue to bolster further deployment of these technologies.
Gas-based plants, mainly combined cycles20, have reduced their contribution to the total electricity
generated, although experiencing a less drastic reduction in the capacity mix. This combined effect has resulted in major reductions in the capacity factors; an effect that will be described in the following sections. The main challenges this technology faces in the future are the development of gas infrastructure, either liquefied natural gas (LNG) terminals or gas pipelines, for the power sector as well as alternative uses for gas such as the fertilizing and the petrochemical industry.
Finally, nuclear plants have remained practically stable in the total generation mix, but significantly low compared to the other sources. Nuclear plants in India are either constructed with domestic equipment or imported mainly from Russia and have resulted in significantly lower capital costs in comparison to nuclear plants in western countries (Lovering, Yip and Nordhau 2016). However, the ability to develop and construct nuclear plants in reasonable timelines seems challenging. Currently, there are nearly 6.8 GW of plants under operation and 5.4 GW under construction. Although the (World Nuclear Association 2019) has estimated that between proposed and planned
17 India currently imports coking coal, mainly from Australia. Coking coal is used in the steelmaking
industry (Varadhan 2019).
18 Values shown consider hydro plants over 25 MW, including run of river plants, reservoir plants
and pumped hydro storage plants.
19 In addition, according to (Sharma, Tiwari and Sood 2012), an area of 35,000 km2 in the Thar
Desert has been specifically set aside for solar projects; a potential between 700 GW and 2,100 GW has been estimated in this area.
20 By March 2017 of the 25,330 MW of gas-based capacity, only 350 MW were open-cycle plants.
projects, additional 80 GW of nuclear capacity could be installed in the long term, other studies21
are more conservative to the degree of feasible capacity that could to be deployed.
Even though India has interconnections with Bhutan, Bangladesh, and Nepal, the energy traded through the existent links is low. In 2017-18, net imports only accounted for 1% of total electricity generated, coming mainly from Bhutan.
Figure 2-3: National installed capacity at the end of each fiscal year in the period between years 2008-09 and 2017-18. Source: (Central Electricity Authority 2008-2018b).
Note: Values are from March of every fiscal year. Values do not consider captive plants and behind-the-meter diesel generators.
Figure 2-4: Generation per source for the years 2008-09 to 2017-18. Source: (Central Electricity Authority 2008-2018b).
Note: Values are annual, starting from March of every fiscal year. Values do not consider captive plants and behind the meter diesel generators.
2.2 Transforming the Indian power sector: regulatory changes in past decades
The Indian Power sector historically consisted of largely independent regional power grids, with state-owned vertically integrated firms, named State Electricity Boards (SEBs) operating in each region. Driven by the poor performance of SEBs and financial difficulties of DISCOMs22, severalregulatory modifications, beginning in the early 90s, gradually changed the existing power system structure. Privatization and unbundling began, separating the transmission, generation, and distribution businesses and allowing the participation of independent power producers. However, the process of unbundling is still being undertaken, with some states lagging behind. In addition, central authorities pushed for integrating the independent regional grids, forming one national integrated system.
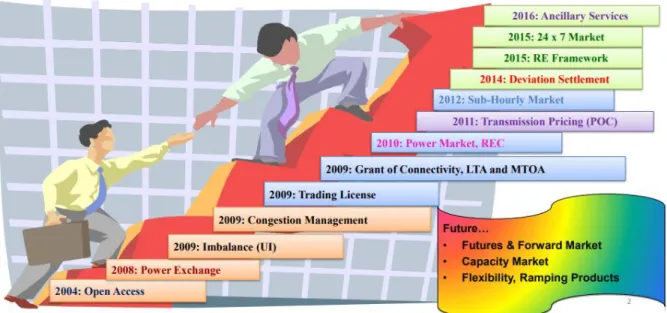
The Electricity Act (2003) enabled the introduction of competitive power markets in India. The act established competition at the wholesale level and among many changes, delicensed thermal generation, established open access to transmission and enabled power trading. As Figure 2-5 shows, the Indian power sector is in gradual evolution. Since the promulgation of the Electricity Act in 2003, several new regulations have been approved, changing different stages of the electricity chain.
Figure 2-5: Milestones in the development of power markets in India. Source: (Saxena 2017).
Figure 2-6 shows the different players in the Indian sector. Policymaking is delegated to the Central Government, the Central Electricity Authority (CEA), and each State Government, while the regulatory role is assumed by the Central Electricity Regulatory Commission (CERC) and the State Electricity Regulatory Commissions (SERCs). CEA is the authority at the federal level, assisting the Ministry of Power and elaborating the National Electricity Plans every 5 years. Additionally, it
22 The main reasons behind distribution financial struggles were high wholesale supply costs due
to legacy PPAs and, regulated tariffs that are below-cost recovery levels (especially for agricultural customers) and high technical and commercial losses (in 2003-04 in some states losses surpassed 60%).
advises in the elaboration of the National Electricity Policy and elaborates the grid standards. The CERC, and SERCs, among other responsibilities, are in charge of awarding and revoking of licenses, setting tariffs consistent with National Electricity Policy, defining and enforcing performance standards and quality of service.
Figure 2-6: Structure of the Indian Electricity Market. Source: (Power System Operation Corporation Ltd. 2017).
Investment in the generation and transmission sectors have been mainly driven by federal and state governments. Power generation plants have been historically financed through cost-plus schemes. Once the National Tariff Policy was established in 2006, new power plants were developed by participating in competitive bidding processes to sign long-term agreements. In recent years, power exchanges with Day-Ahead and Intraday markets have developed in some states. However, the total percentage of energy traded through power exchanges is still low, as shown in Figure 2-7.
Figure 2-7: Type of contracts in the wholesale market. Source: (Indian Energy Exchange 2018).
Renewables are incentivized in India through supply-side and demand-side incentives. Renewable Purchase Obligations (RPOs) have been imposed for load-serving entities and other end users, which can be met by purchasing Renewable Energy Credits (RECs). Renewable generators can either sell energy at a feed-in tariff, sell through bilateral agreements (including RECs), or sell energy and RECs in a separate basis and through power exchanges. Feed-in tariffs, previously set by regulators, are now being more commonly determined by competitive bidding processes.
2.3 National Electricity Plans: authorities are pushing for VRE sources
Every 5 years, the CEA publishes a National Electricity Plan. This electricity plan considers the suggestions of licensees, generating companies and the public and is under the approval of the Central Government. This plan includes the planning of interstate transmission systems as well as intrastate transmission systems (up to 66kV). Central Transmission Utilities (CTUs) and State Transmission Utilities (STUs)23 have the key responsibility of network planning and development
based on the National Electricity Plan in coordination with all concerned agencies as provided in the Act. Previous National Electricity Plans focused on developing baseload capacity, mainly coal plants, to improve energy security and reduce the non-served energy. During the period between 2012 and 2017, 99 GW of new plants were installed, 85 GW of them, coal capacity. Following the goals set in the INDC, the CEA is focused now on encouraging renewables. Figure 2-8 shows the current National Electricity Plan with an end date of March 2022. The aims of the plan are set for
23 Transmission ownership is dispersed among a Central Transmission Utility, State Transmission
Utilities, and Private Transmission Licensees. The Central Transmission Utilities is Power Grid Corporation of India Limited (PGCIL), a Government-of-India enterprise and is responsible for interregional and international links while, State Transmission Utilities (STUs) own intrastate transmission networks.
renewable energy sources (RES24) share to double, bolstered by the development of nearly 88 GW
of solar and 28 GW of onshore wind. Coal plants would still continue to develop while large hydro, nuclear, and gas capacity would lose share with small development. Figure 2-9 shows that new wind capacity has achieved the targeted additions, while solar additions are falling behind the goals.
Figure 2-8: 13th National Electricity Plan: 2017-2022. Source: (Central Electricity Authority 2017c).
Figure 2-9: Targeted v/s installed solar and wind capacity.
Source: (Central Electricity Authority 2017c) and (Central Electricity Authority 2008-2018b).
2.4 Moving forward: major challenges ahead
Besides coping with the ambitious renewables goal, central authorities in India have to deal with several struggles when planning the future power system. The dilemmas are related to the following factors:
1. Electricity load is expected to increase by threefold in the next 20 years.
2. The power mix will shift from coal-based to one more dependent on VRE generation. 3. The power system has experienced reliability problems and provided a low quality of
service.
4. Local pollution in several cities is a significant problem, and authorities are pushing to reduce local emissions, directly affecting several fossil fuel technologies.
On the one hand, as shown in Figure 2-10, electricity consumption is expected to nearly triple in the next two decades. The additional load will be driven by an increase in electricity coverage and a rise in electricity consumption per capita. The central government has focused on increasing electricity coverage: during the last five years, the government electrified 100% of all Indian villages25 (BBC news 2018). Many challenges arise with the inclusion of the new customers; most
of them did not consume electricity before they were connected to the grid, so there is no information regarding their expected electricity consumption and load profile. Additionally, electricity consumption per capita is expected to increase following the forecasted growth in GDP per capita. An example is the adoption of air conditioning units, which increases as the population becomes wealthier, and that would increase load and even shift peak load intervals. Electrifying sectors that have traditionally been fossil fuel-based, such as transportation and heating, would influence further load growth26. Meeting high load growth rates would require considerable
investments in the power and transmissions sectors. The required capacity to meet the future load and replace those plants that would age and retire in the future years is equivalent to the current total installed capacity in India. This is added to the fact that there is some uncertainty regarding future load: how much electricity is expected to be demanded, and what would the load profile be?
25 The central government defines that a village is electrified if 10 percent of its households, as well
as public places such as schools and health centers, are connected.
26 Official forecasts include only 6 million electric vehicles by 2022 and do not specify forecasts in
Figure 2-10: Actual and forecasted electricity demand.
Source: Actual values from (Central Electricity Authority 2008-2018a) and forecasts from (Central Electricity Authority 2017c).
On the other hand, achieving the VRE goals by 2022 and more ambitious targets by 2026 and further would involve shifting from a generation mix based on coal generation to one with a high share of variable renewables. State and regional load dispatch operators, used to dealing with predictable thermal plants, will face higher uncertainty and variability in the output of thousands of power units. Managing high amounts of variable capacity would require flexible units, able to ramp up or ramp down in order to cope with abrupt changes in VRE generation. Most of the existing coals plants do not satisfy the flexibility needs the system would demand in the future. The CEA forecasts that by 2022 the coal plants will only able to be dispatched down to 55% of nameplate capacity while ramping up and down at a maximum of 1% per min (Authority 2019b). Investment in more flexible capacity would probably be required in the future. Moreover, considering that VRE capacity is spread all over the country, reinforcements to the transmission and distribution grids and better coordination between DISCOMs, State, and Regional system operators would be vital. Many investments, as well as technical and regulatory changes, must be done to operate the power system under reliable standards.
However, operating a reliable system has been a constant headache for Indian system operators. Historically, the country has experienced frequent power outages and low quality of service. Transmission and distribution infrastructure investments have not keep up with the high growth rates in electricity consumption, due mainly to the weak financial status of electricity firms27. Figure
27 On the one hand there is a financing gap: revenues recollected from tariffs paid by regulated
users are not sufficient to cover distribution, transmission and generation costs. On the other hand, a significant share of electricity is not paid or is stolen by end users, generating losses that are borne mainly by DISCOMs. This creates a vicious cycle: the weak financial health of electricity firms cause them to underinvest in network reinforcements, leading to a reduction in the quality of
2-11 shows the average daily power cuts in some major Indian cities during 2015-2016; it is common for citizens of major cities to experience daily power outages, some of them lasting for hours. As a response to frequent power outages, many residential, commercial and industrial customers invested in their own backup diesel generators. CERC estimated in 2014 that there were around 90 GW of behind-the-meter backup diesel generators, increasing by between 5,000 and 8,000 MW per year (Central Electricity Regulatory Commission 2014),
Although the percentage of total energy and peak load not supplied has been steadily decreasing in recent years, as shown in Figure 2-12, there are still some regions with high percentages of unserved load. For instance, during the fiscal year 2017-18, 20% of the required electricity load was not supplied in the state of Jammu & Kashmir, while 9% of unserved energy was observed in Adaman & Nicobar (Central Electricity Authority 2008-2018a). New VRE capacity would only provide additional obstacles to reliability performance. VRE capacity would exert further pressure on the already weak financials of incumbents and will require additional network upgrade investments.
Figure 2-11: Average daily power outages in Indian cities between November 2015 and October 2016. Source: (Bhati and Kalsotra 2017).
service. Then more users feel they should not pay for the poor service provided and lower revenues are collected by DISCOMs increasing the financing gap.
Figure 2-12: Percentage of non-served energy and non-served peak load. Source: (Central Electricity Authority 2008-2018a).
Finally, local pollution is a primary concern among local authorities, considering that seven out of the ten of the most polluted cities in the world are in India (Thornton 2019). Some large-scale thermal plants, operating nearby new large cities have increased the level of SO2, NOx and PM emissions. This is complemented with the usage of backup diesel units, not only emitting a loud noise when operating but contributing to PM2.5, PM10, SO2, NOX, and CO2 total emissions28.
To avoid this, authorities have raised emissions standards for SOx and NOX emissions for utility-scale power plants (Center for Study of Science, Technology & Policy 2018) while imposing restrictions to the use of behind-the-meter diesel generators29 (Central Electricity Regulatory
Commission 2014).
The central authorities, system operators, policymakers and state and private actors would have to deal with all these challenges. Is the Indian power system prepared for all these changes? What is needed to change in the regulatory framework in order to achieve the local and global emission goals in an efficient and reliable way?
28 According to (Bhati and Kalsotra 2017), diesel generation sets contributed to 6% of PM 2.5, 4%
of PM10, 4% of SO2, 25% of NOx and 7% of CO total levels in the Union Territory of Delhi.
29 For instance, the Government of Delhi banned the use of diesel generators with capacity greater
3 Studies of decarbonization plans in India and the world
This chapter summarizes a few different studies that have analyzed and quantified decarbonization plans for power systems. Most studies focus on mature power systems in developed countries, with high reliability standards and low electricity growth rates. Most of the challenges come from electrifying fossil-fuel-based sectors, such as transportation and heat, instead of experiencing additional growth in electricity consumption. Some reports have analyzed the Indian power sector; however, these studies either analyze the system operation in the short- and medium-term, or evaluate a single scenario in the long-term. None of the studies address the uncertainty in future decarbonization pathways as they fail to explore multiple scenarios that will depend on the different technical, economic, and regulatory assumptions. Finally, to reduce computational challenges, existing research often considers simplified models of power systems, misrepresenting or neglecting key characteristics that exist in power mixes with a high share of variable renewables.
3.1 Studies of decarbonization in developed countries
Several studies have been published evaluating different roadmaps to achieve a drastic reduction in GHG emissions. For instance, (Jenkins, Luke and Thernstrom 2018) and (Sepulveda, et al. 2018) examine different pathways to achieve zero emissions in grids resembling existing power systems in developed countries. Both studies compare the path of relying mainly on VRE sources and flexible capacity with the alternative of developing a broader range of technologies, including low-carbon firm resources30. The authors conclude that policymakers should consider the latter
technologies to achieve ambitious emissions reduction goals in a cost-effective way. While (Jenkins, Luke and Thernstrom 2018) conduct a literature review of several studies analyzing deep decarbonization with a global scope or focused in developed countries, (Sepulveda, et al. 2018) simulate multiple scenarios in a fictitious system based on the western US. Other studies have examined the transition from fossil-fuel based to renewable generation mixes in Great Britain (Zeyringer, et al. 2018), Denmark (Lund and Mathiesen 2009), Norway (Hagos, Gebremedhin and Zethraeus 2014), Iceland (Duenas, et al. 2018), Australia (Riesz, Vithayasrichareon and MacGill 2015), South Korea (Koo, et al. 2011), and Portugal (Fernandes and Ferreira 2014). None of these studies analyze the case of India, a developing country with high economic growth rates.
The Deep Decarbonization Pathways Project in its 2015 report (Deep Decarbonization Pathways Project 2015), provides global guidelines to maintain the global temperature rise below 2°C by 2050. The study promotes three main pillars for deep decarbonization: energy efficiency, decarbonizing electricity and fuels, and switching to low carbon sources in energy end-uses. The study proposes recommendations for several countries, including India, although these are general. Finally, the IEA in its latest World Energy Outlook (International Energy Agency 2018) evaluates three different global policy scenarios to provide insights and inform government and decision-makers about the main outcomes. The main findings, although they include specific recommendations for countries like India, do not provide technical and operational details of how the future grid would behave.
30 Among low-carbon firm sources the authors refer to nuclear, geothermal, biomass and fossil fuel
3.2 Studies of decarbonization in India
Following CEA’s 13th National Electricity Plan announcement, several independent studies have
been published analyzing the future operation of the Indian system and evaluating the impact of including 175 GW of installed VRE capacity in the Indian grid. These studies are contrasted with two official reports elaborated by the CEA that provide a technical and operational description of the system by 2022 and 2030, respectively.
On the one hand, the CEA in its official document describing the 13th National Electricity Plan
evaluates the main effects of incorporating the VRE goals by 2022. Considering the demand projection, committed capacity of gas, hydro and nuclear plants, and expected thermal retirements, the CEA predicts that around 6 GW of new coal plants would be required. This number is smaller than the nearly 48 GW of new coal capacity that would likely be operating by 2022. CEA predicts an increase in capacity factors for the coal fleet and forecast that VRE sources would represent around 20% of the generation mix. By 2022, the country would comply with its non-fossil-fuel capacity share established in its INDC31 The central authority also provides an analysis of the
tentative 14th plan, that is aiming to have 250 GW of VRE by the fiscal year 2026-27. VRE would
represent around 24% of the total generation mix and to successfully accommodate the additions, the system would require additional peaking power plants and/or energy storage devices.
On the other hand, the CEA recently published a report (CEA 2030 report) estimating the optimal capacity mix for the Indian power system by 2030, considering the specific technical and economic feasibility of different technology options (Central Electricity Authority 2019a). As a first step, the expected installed capacity by 2022 is used as an input, and the least cost option for system expansion for the period between 2022-23 and 2029-2030 is calculated. Then, hourly generation dispatches are simulated for critical days (e.g., peak load day, maximum wind, and solar day) to verify if the optimal mix is adequate to meet the forecasted load at every hour. As a novelty, the study includes battery energy storage as a candidate technology that can be deployed by 2030; currently there is no significant utility-scale storage capacity installed in the Indian power system. Among the main findings, the report concludes that coal capacity will represent around 32% and 50% of the capacity mix and energy mix, respectively, reducing both shares in comparison to 2022 levels. Expected non-fossil-fuel capacity will represent nearly 65% of the total installed capacity, complying with the goals committed in the INDC. Solar and wind will represent approximately 35% of the energy mix, and renewable energy curtailment peaks at 17% of the energy available. Moreover, the report includes sensitivity analysis, showing that increasing flexibility of coal plants can help gradually reduce renewable energy curtailment. Finally, GHG emissions in absolute terms are expected to rise from 2022 to 2030, but only by 12%.
In contrast, three independent studies have quantified the impacts of including 175 GW of VRE in the system’s operation by 2022. The independent studies are the study published by National Renewable Energy Laboratory (NREL) (Palchak, et al. 2017), the study elaborated jointly by General Electric and the Shakti Foundation (General Electric & Shakti Sustainable Energy
31 The share as indicated before is 40% by 2030. CEA expects that by 2022, non-fossil fuel capacity
Foundation 2018), and the study conducted by Lawrence Berkeley National Laboratory (Phadke, Abhyankar and Deshmukh 2016).
The NREL study, among many conclusions, finds that CEA’s expected generation and transmission infrastructure by 2022 would be sufficient to meet the expected load and accommodate the VRE generation with low levels of renewable curtailment32. The study authors
conclude that the expected capacity mix would have enough flexibility to manage the ramping requirements due to changes in variable generation, and would not require additional investment in storage and/or flexible capacity; instead, the system could deal with the retirement of around 46 GW of the old coal fleet without negatively affecting its operation. The study expects that VRE generation, mainly solar and wind, would represent around 22% of the total energy mix, peaking at 54% in certain hours. Among the key recommendations proposed to allow further VRE adoption are to improve the coordination among states, reduce minimum generation levels of large coal plants, and give a more significant role to flexible hydro plants.
General Electric and the Shakti Foundation (General Electric & Shakti Sustainable Energy Foundation 2018) evaluates CEA’s 13th National Electricity Plan and focus on specific performance
metrics. Among the key findings, the study concludes that including 175 GW in VRE sources would lead to a higher number of starts and stops of the coal fleet, and changes in coal capacity factors, that will depend on the region if they are upward or downward. Interstate and interregional transmission links would likely experience congestion, as electricity exchange among regions, exports mainly from the western to the northern and southern regions would increase. Moreover, some states, mainly in the northern and southern region, would still experience load shedding, due to the inability to import electricity from other regions at peak intervals.
Finally, the authors of Berkeley National Lab’s study estimated that coal capacity required by 2022 would be lower than CEA’s estimates, while additional flexible gas-based capacity would be needed. While renewable sources provide support during peak hours during monsoon and summer seasons, during winter, flexible dispatchable capacity would be required to ramp up to meet the peak loads. The authors advocate for developing additional gas infrastructure, considering evaluating demand response options and reinforce interregional transmission networks.
While the CEA’ National Electricity Plan, NREL, and GE & Shakti studies consider intrastate transmission networks, the Berkeley Lab study is limited to a regional analysis. The CEA 2030 report simulates a single node system and does not consider any transmission congestion. Most studies include detailed analysis of how the system would operate by 2022; nevertheless, they limit their analysis the short- and medium-term. Most studies fail to address its main challenges in the next 20 years: electricity demand will almost triple, a significant share of the existing power capacity would have to retire due to its age, and more stringent emissions limit would be enforced. The CEA in its interregional transmission report (Central Electricity Authority 2016) conducts a long-term assessment (2036) of the transmission operation performance estimating the requirements of transmission capacity under indicative capacity plans; however, it does not include a thorough analysis of how the system would work under more aggressive VRE penetration. The only report that conducts a thorough long-term analysis is the recent CEA 2030 report. Nonetheless, this study considers fix assumptions for the main capacity expansion drivers (e.g., VRE capital costs, storage costs) and fails to explore different scenarios to address the uncertainty in these assumptions. In