HAL Id: cea-02438377
https://hal-cea.archives-ouvertes.fr/cea-02438377
Submitted on 27 Feb 2020
HAL is a multi-disciplinary open access
archive for the deposit and dissemination of
sci-entific research documents, whether they are
pub-lished or not. The documents may come from
teaching and research institutions in France or
abroad, or from public or private research centers.
L’archive ouverte pluridisciplinaire HAL, est
destinée au dépôt et à la diffusion de documents
scientifiques de niveau recherche, publiés ou non,
émanant des établissements d’enseignement et de
recherche français ou étrangers, des laboratoires
publics ou privés.
Granular compaction and stretched exponentials
M. Nicolas, J.-E. Mathonnet, B. Dalloz, P. Sornay
To cite this version:
M. Nicolas, J.-E. Mathonnet, B. Dalloz, P. Sornay. Granular compaction and stretched exponentials:
Experiments and a numerical stochastic model. Powders and Grains 2017 - the 8th International
Conference on Micromechanics of Granular Media, Jul 2017, Montpellier, France. �cea-02438377�
Granular compaction and stretched exponentials
Experiments and a numerical stochastic model
Maxime Nicolas1,?, Jean-Eric Mathonnet2,??, Blanche Dalloz1,???, and Philippe Sornay2,???? 1Aix Marseille Univ, CNRS, IUSTI, Marseille, France
2CEA, DEN, DEC, SFER, LCU, 13108 Saint-Paul-Lez-Durance, France
Abstract. We investigate the physical meaning of the characteristic time τ and the exponent β of the KWW expression widely used to fit the tapped granular compaction.
1 Introduction
The compaction of a non-cohesive granular material (glass beads, sand, rice for example) under vibrations or verti-cal tapping is often well represented by a stretched expo-nential function [1], inspired by the Kohlrausch-Williams-Watts (KWW) relaxation model:
C(t)= φ∞−φ(t) φ∞−φ0
= e−(t/τ)β (1)
In this expression, τ is a characteristic time, and β an ex-ponent. While other empirical expressions are proposed in the literature [2–4], we will only focus on the expression (1) throughout this paper with aim of providing a physi-cal meaning to τ and β using a stochastic model and some experiments.
Through simple analytical calculations, it can be first shown that τ is the time where the curve φ(ln t) exhibits an inflexion point in a log-lin space. At this particular time t= τ, the packing fraction is φ∗= φ
∞− (φ∞−φ0)/e, and
the exponent β is proportional to the slope of the φ(ln t) curve: β = φ e ∞−φ0 dφ dln t ! t=τ (2) Hence β can be interpreted as a logarithmic rate of com-paction, i.e. the rate of increase of φ with the logarithm of t. A graphical meaning of β can also be found when plotting Y as a function of ln t,
Y= ln ln1 C !
= β ln t − β ln τ. (3) In these axis, the expression (1) is then a straight line of slope β.
We suggest in this paper a simple one-dimensional stochastic model of compaction to understand the physi-cal origins of τ and β. Moreover, the « universality » of
?e-mail: [email protected]
??e-mail: [email protected]
???e-mail: [email protected]
????e-mail: [email protected]
the KWW relaxation expression may be questioned when the granular material exhibits a cohesive property. Widely used in the industry, cohesive powders are often difficult to handle and transport. A cohesive powder usually presents a high angle of repose and a low bulk volume fraction. The cohesiveness of a powder may be measured through its ability to flow under gravity, and this ill-defined "flowa-bility" is often described by the Hausner ratio IH, the ratio
of the the tapped bulk density of the powder over the freely settled bulk density [5]. A Hausner ratio greater than 1.25 is considered to be an indication of weak flowability.
It is thus interesting to trial the role of cohesion on the compaction curve, with an extension of the stochas-tic model, and also with some experiments on a cohesive powder under vibrations.
2 Stochastic model
2.1 Non cohesive modelWe first describe here a simple stochastic model to simu-late the compaction of a non-cohesive granular material. the model is a set of N unit grains shared out on a dis-cretized one-dimensional space of size H0bounded with a
static grain at the bottom z = 0 (see Fig. 1a). The initial linear fraction is φ0g = N/H0 and we write φ∞g = 1 the
maximum packing fraction. The free spaces between two consecutive grains model the pore space between physical grains and are of the same order of magnitude as the grain volume [6].
At each time step, all the grains are tested in a random order. For each grain a random number r determines its ability to move: if r 6 pg, it may move down of a space unit only if the space below is free. The grain motion prob-ability pgis governed by the packing fraction as
pg(φg)= φ∞g−φg φ∞g−φ0g
, (4)
which is the ratio of the free volume [7] at time t by the free volume at time t = 0. Many other expressions of this
t=0 t=∞ cluster grain t >0 t >t1 2 1 H(t) macro-cavity
}
micro-cavity } (b) cohesive model t=0 t >01 t=∞ (a) non -cohesive model H(t)Figure 1. (a) Sketch of the non-cohesive model with individual grains only. From t= 0 to t1, the green-labeled grain is allowed to move downwards whereas the red-labeled grain can not move. (b) Sketch of the cohesive model with 6 clusters containing 9 grains each. The blue-labeled cluster may move down of a dis-tance of its size (from t= 0 to t1) or of the available space (from t1to t2).
probability (also named mobility) are available in the liter-ature [7, 8] are derived from statistical physics principles, but we prefer an expression which expresses a decrease of this probability from the initial state (φ0g) to the final
state (φg∞) in the simplest way. We checked that the
or-der of tests of the N grains has no influence on the global dynamics. At the end of the loop on the N grains, the global packing fraction φ(t)= N/H(t) is simply computed with the height H(t) of the highest grain of the set at time step t. The computation stops after a predefined number of time steps. The system obviously does not evolve any-more when the packing fraction has reached its maximum limit φ∞g= 1. To avoid random fluctuations on the results,
several runs were averaged before presenting the results. A first example of result of this model is shown on Fig. 2 where the height of the packing is plotted in a log-lin space (blue curve). During the process, a compaction front is uprising. This front is located at Hc(t), and the grains
below Hcare at the maximum packing fraction φ∞g. If we
assume that the packing fraction above Hc is a constant
value φm= φ0, the front location must be
Hc(t)= N φ(t) φ(t) − φ0 φ∞−φ0 (5) Looking at the dashed curve in Fig. 2, this assumption seems to be checked at any time.
Simulated compaction curves averaged on 20 000 runs are shown in Fig. 3 for different initial packing fractions φ0 and for various representations. From these data, we
can compute the characteristic time T and the logarithmic compaction rate b defined by
d2φ d(ln t)2 ! t=T = 0, b= e φ∞−φ0 dφ dln t ! t=T (6) These compaction curves are compared with the KWW expression, and we can notice that the numerical result (ln t, Y) is not a straight line at all time, the stretched ex-ponential expression does not completely fit the numerical
10
010
110
210
310
4t
+1
0.0
0.2
0.4
0.6
0.8
1.0
H
/H
0or
H
c/H
0 H(t) Hc(t)Eq.(5)
Figure 2. Height of the modeled packing H(t) (red curve) nor-malized by the initial height H0, height of the compacted grains Hc(t) (blue curve), compared with expression 5 (black dashed line). The model parameters are N = 250, φ0 = 0.9 from an average of 20 000 runs.
10
010
110
210
310
4t
+1
0.7
0.8
0.9
1.0
φ
(a)
φ
(a)
φ
(a)
0 2 4 6 8 10
ln(
t
+1)
6
4
2
0
2
4
Y
(b)
Y
(b)
Y
(b)
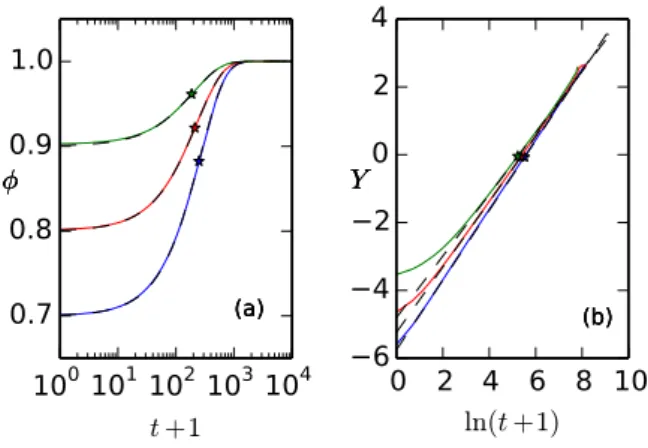
Figure 3. Simulation results (colored continuous lines) for N = 250 grains, averaged on 20 000 runs. Each curve is fitted by Eq. 1 (dashed black line) (a) Compaction curves for three dif-ferent initial conditions. The star symbols indicate the inflexion points at time t= T, (b) Same data in the (ln t, Y) space.
data, especially at short time. However, around t = T (indicated by the stars), the numerical data are fairly well approximated by the KWW expression, showing that τ is indeed a good approximate of T and β ≈ b. Varying both φ0and N, this model shows that the characteristic time is
expressed by T = N φ∞g−φ0g φ0g + A ! , φ0g< φ∞g (7)
with a fitting parameter A= 0.6, and the logarithmic com-paction velocity
b= 0.34φ0g
φ∞g + A, φ0g < φ∞g. (8)
The characteristic compaction time is thus governed by the number of grains N. The ratio φ0g/φ∞gis also a governing
2.2 Cohesive model
The previous model can be extended for a cohesive gran-ular material. the cohesive grangran-ular system is modeled as a set of N unit grains shared out between Ncclusters,
each cluster containing n grains. As previously, the grains and clusters are located on a discretized one-dimensional space of size H0 bounded with a static grain at the
bot-tom z = 0. The initial state is prepared first by placing randomly the clusters of even size n/φ0gwithout overlap,
with a linear fraction of clusters φ0c. Then the grains are
randomly placed inside each cluster with a linear fraction φ0g. The initial global packing fraction is then φ0= φ0cφ0g.
At each time step, the particles and the clusters may move according to the motion probability laws
pc(φc)= φ∞c−φc φ∞c−φ0c , pg(φg)= φ∞g−φg φ∞g−φ0g (9) where subscript c is for clusters, g for individual grains, φc(t) is the cluster linear fraction, and φg(t) is the linear
fraction of grains inside the clusters.
A representative result of the simulation is given in Fig. 4. The compaction curve shows an obvious two-stages evolution. The first stage corresponds to the fast compaction of the clusters while the second stage corre-sponds to the compaction of the individual grains. This ap-proach clearly shows that two separate characteristic times Tcand Tgare present, where the subscripts c and g stand
for clusters and grains. As for the non-cohesive model, the characteristic times are defined through the inflexion points of the φ(log t) curve, and scale on the number of clusters or individual grains,
Tc= Nc φ∞c−φ0c φ0c + A! (10) and Tg= N" A 2 exp φ∞g−φ0g A/2 !# . (11) Whatever the model parameters (φ0c, φ0g, N, n), the
numerical results can be well fitted by an extension of the stretched exponential function expression with two expo-nentials: φ = φ∞− (φp−φ0)e−(t/τc) βc − (φ∞−φp)e−(t/τg) βg (12) with two time-scales τcand τg, two exponents βc and βg
and a plateau packing fraction φp (See Fig. 4a) . The
fit-ted characteristic times τc and τg are again very close to
the computed times Tcand Tg, and the exponents βcand
βgmay be interpreted as logarithmic compaction rates for
clusters and grains respectively.
3 Experiments
The results from the stochastic model are compared with compaction experiments with an experimental setup based on a horizontal vibration of a vertical tank of square sec-tion 15×15 mm2. A first set of experiments was made with
10
010
110
210
310
410
5 t+10.2
0.4
0.6
0.8
1.0
φ
0 2 4 6 8 10
ln(t+1)6
5
4
3
2
1
0
1
2
3
Y
Figure 4. Simulation result for a modeled cohesive granular ma-terial. The parameters are N = 1250, n = 50, φ0c = φ0g = 0.5. (a) volume fraction as a function of time in a log-lin space (blue curve) and the fitted expression (12) (black dashed line). The stars indicate the Tcand Tgcharacteristic times. (b) Same data plotted as Y= ln(ln(1/C)) as a function of ln t. 100 101 102 103 104 105 t+1 0.58 0.59 0.60 0.61 φ H0=5 cm H0=10 cm H0=15 cm H0=20 cm H0=25 cm 1.00 1.05 φ∞/φ0 0 5 10 15 20 τ/ H0 (c m − 1)
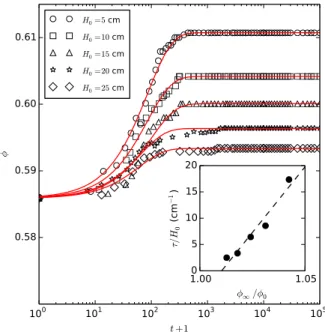
Figure 5. Experimental results of the compaction of a glass bead assembly for different initial height. The red lines are the KWW expression (1). Insert: the fitted characteristic time τ as a func-tion of the initial volume fracfunc-tion.
glass beads of 130 µm, a non-cohesive granular material (IH= 1.08). For these experiments, φ0/φ∞g≈ 0.95. While
it is difficult to compare the 3 dimensional experimental results with 1 dimensional numerical results, we were able to test one of the main result from the stochastic model. By varying the mass of grains in the shaken tank,
A second set of experiments was conducted with a co-hesive UO2 powder. This powder is made of grains of
d = 30 µm diameter with rough surfaces and a Hausner ratio IH = 1.53. The figure 6 presents three sets of data
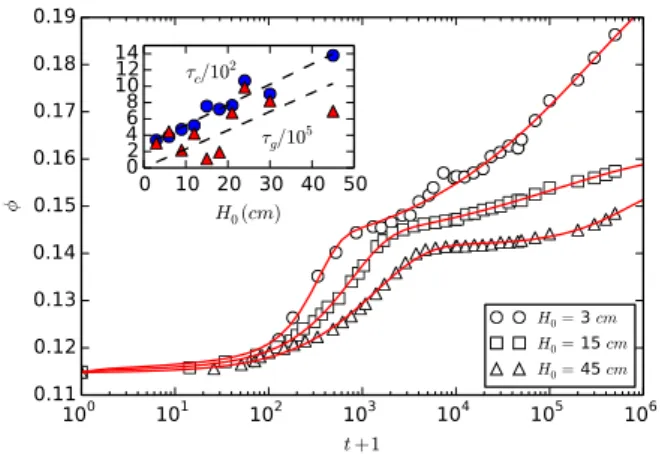
100 101 102 103 104 105 106 t+1 0.11 0.12 0.13 0.14 0.15 0.16 0.17 0.18 0.19 φ H0= 3 cm H0= 15 cm H0= 45 cm 0 10 20 30 40 50 H0(cm) 02 46 8 1012 14 τc/102 τg/105
Figure 6. Experimental results of the compaction of a cohe-sive powder under vibrations (100 Hz, 7g). The red lines are the KWW2 expression (12).
Figure 7. Image of the UO2powder during the vibration process. The arrows indicate macro-cavities near the front plate. Only the top of the tank is shown here.
low initial volume fraction (the UO2grains have an
intrin-sic porosity), a first increase occurs at t ≈ 103cycles of vibrations. A direct observation of the system during the beginning of the vibration process shows the existence of macro-cavities rising upwards at least near the front plate of the tank, and these large void structures may exist also in the bulk (Fig. 7). For a larger time, a second stage of compaction occurs at t ≈ 104cycles.
Despite a long experimental time (106cycles), we did
not observe a saturation of the volume fraction, the limit φ∞ seems to be ill-defined in our experiment. However,
the double exponential (12) fits well the experimental data, and we were able to extract the characteristic times τcand
τg as a function of the number of particles in the system. The insert of Fig. 6 seems to show a linear trend between the characteristic times and the height of the initial pack-ing.
4 Conclusions
With a simple stochastic model we demonstrate that the characteristic time of compaction is proportional to the
number of moveable objects. This result seems to be con-firmed by experiments on two examples of granular mate-rial: a non-cohesive glass beads assembly, and a cohesive powder. Through this work we do not agree with the pre-vious work of Hao [9, 10] where the time of compaction is related to the inverse of the mass of granular material.
A two-stages compaction evolution has already been proposed by Barker and Mehta [11] but here we associate the first stage of compaction with a collective motion of grains, and the second stage of compaction with the indi-vidual motion of the grains.
References
[1] P. Philippe and D. Bideau, Compaction dynamics of a granular medium under vertical tapping, Europhys. Lett. 60(5), 677-683 (2002)
[2] J. B. Knight, C. G. Fandrich, C. N. Lau, H. M. Jaeger ans S. R. Nagel, Density relaxation in a vibrated granu-lar material, Phys. Rev. E 51(5) 3957-3963 (1995) [3] E. R. Nowak, J. B. Knight, E. Ben-Naim, H. M. Jaeger
and S. R. Nagel, Density fluctuations in vibrated gran-ular materials, Phys. Rev. E 57(2) 1971-1982 (1998) [4] E. Rondet, M. Delalonde Michèle and T. Ruiz, Modèle
de relaxation dans un milieu granulaire vertical soumis à des vibrations : équivalence avec la consolidation des sols Récents Progrès en Génie des Procédés, 107 4.8-1–4.8-9 (2015)
[5] R. L. Carr, Evaluating Flow Properties of Solids. Chem. Eng. 72, 163-168 (1965)
[6] P. Philippe, F. Barbe, S. Bourlès, X. Thibault and D. Bideau, Analysis by x-ray microtomography of a gran-ular packing undergoing compaction, Phys. Rev. E 68, 020301(R) (2003)
[7] T. Boutreux and P.-G. de Gennes, Compaction of gran-ular mixtures: a free volume model Physica A 244 59-67 (1997)
[8] J.J. Arenzon and Y. Levin, Slow dynamics under grav-ity: a nonlinear diffusion model, Physica (Amsterdam) 325A, 371 (2003).
[9] T. Hao, Tap density equations of granular powders based on the rate process theory and the free volume concept, Soft Matter 11 1554 (2015)
[10] T. Hao, Derivation of stretched exponential tap den-sity equations of granular powders, Soft Matter 11 3056 (2015)
[11] G. C. Barker and A. Mehta, Transient phenomena, self-diffusion, and orientational effects in vibrated pow-ders, Phys. Rev. E 47(1) 184-188 (1993)