HAL Id: hal-02150886
https://hal.archives-ouvertes.fr/hal-02150886
Submitted on 7 Jun 2019
HAL is a multi-disciplinary open access archive for the deposit and dissemination of sci-entific research documents, whether they are pub-lished or not. The documents may come from teaching and research institutions in France or abroad, or from public or private research centers.
L’archive ouverte pluridisciplinaire HAL, est destinée au dépôt et à la diffusion de documents scientifiques de niveau recherche, publiés ou non, émanant des établissements d’enseignement et de recherche français ou étrangers, des laboratoires publics ou privés.
Validation of TRF-E as gasoline surrogate through an
experimental laminar burning speed investigation
Marco Di Lorenzo, Pierre Brequigny, Fabrice Foucher, Christine
Mounaïm-Rousselle
To cite this version:
Marco Di Lorenzo, Pierre Brequigny, Fabrice Foucher, Christine Mounaïm-Rousselle. Validation of TRF-E as gasoline surrogate through an experimental laminar burning speed investigation. Fuel, Elsevier, 2019, 253, pp.1578-1588. �10.1016/j.fuel.2019.05.081�. �hal-02150886�
Validation of TRF-E as gasoline surrogate through an experimental laminar
1
burning speed investigation
2
M.Di Lorenzo, P.Brequigny, F.Foucher, C.Mounaïm-Rousselle 3
Université d'Orléans, INSA-CVL, PRISME, EA 4229, F45072 Orléans, France 4
1. Introduction
5In the road transport sector, it is more and more evident that spark ignition (SI) engines fuelled with gasoline 6
will remain the main powertrain for the next decades, even incorporated in hybrid electric vehicles. This is why 7
one main challenge concerns the increase of efficiency to improve the fuel economy and decrease pollutant 8
emissions. Due to the highly advanced technology reached in the current state of art of ICEs, it appears clear that 9
the major route towards a high efficiency SI engine is downsizing, which consists in increasing the engine load 10
through displacement reduction and turbocharging. As this leads to an increase of initial temperature and pressure, 11
high level of dilution has to be used to avoid abnormal combustions. But, as the stability of the premixed turbulent 12
combustion is strongly affected by dilution, increasing the tolerance of SI engines to high dilution percentages 13
remains a major technical challenge. The prediction of engine behavior in these working mode conditions remains 14
not sufficiently accurate. Most of turbulent premixed combustion models are based on the flamelets regime 15
assumption [1]. However, recent work of Mounaïm-Rousselle et al. [2] pointed out a possible breach of this regime 16
in Spark-Ignition (SI) engines for particular operating conditions, such as downsized engines with high rates of 17
exhaust gas recirculation (EGR) [3], [4]. According to the flamelets model, the flame is considered as 18
asymptotically thin and locally laminar even if the turbulence can wrinkle the flame surface [5], [6]. That explains 19
why laminar burning velocity is a crucial factor in most practical combustion systems and its investigation is still 20
an open research field. Moreover, even though this parameter depends on equivalence ratio, pressure, temperature 21
and diluent gases in the mixture [7], [8], its value is basically a strict characteristic of the fuel itself. To evaluate 22
potential alternative fuels and/or suitable surrogate [9]–[11], the acquisition of complete laminar burning velocities 23
database is required before having access to accurate kinetics mechanism. 24
Commercial gasoline is composed by hundreds of different chemical species that severely increase the 25
complexity, including experimental or numerical approaches [12]. Using surrogate fuel, with well-known 26
composition, allows reducing the complexity to identify the key mechanisms of the reactive mixture [12], [13]. 27
Nonetheless, the surrogate must be representative of the target gasoline. It can be single or multi-components, 28
depending on the purpose of the investigation. As single-component surrogate, iso-octane is widely used for 29
gasoline fuel and may be representative for fundamental phenomena analysis[14]. Nevertheless, Stanglmainer et 30
al. [15] pointed out that the differences between gasoline and iso-octane can be significant at high pressure and 31
temperature. Thus, when the surrogates have to explicitly represent the gasoline behavior, the association through 32
the research octane number (RON) is a practical solution. This coupling is obtained by mixing iso-octane and n-33
heptane, leading to the Primary Reference Fuels (PRFs) that represent suitable surrogates for gasolines under 34
certain conditions [12], [14], [16]. For example, Jerzembeck et al. [17] compared a commercial gasoline with a 35
PRF mixture characterized by RON 87, deducing that the agreement between the two fuels decreases with 36
increasing equivalence ratio. Similarly, Bradley et al. investigated laminar burning velocities of different PRFs up 37
to 1.0 MPa [18], [19]. However, Cruz et al. [13] and Farrell et al. [20] highlighted the fact that PRFs can 38
considerably differ from a pure gasoline due to the different combustion properties of aromatic species with respect 39
to alkanes. Therefore, in order to simulate refinery gasoline, surrogates that include a certain percentage of toluene 40
in the composition represent the actual reference [12]. These are called Toluene Reference Fuels (TRFs) and the 41
best composition in order to fit the gasoline properties is still an open topic as strictly depending on the gasoline 42
target. However, multi-components surrogates of three or more species are the best option when the target is to 43
develop, for example, advanced chemical kinetics mechanisms. Even if several studies have investigated the flame 44
characteristics of different hydrocarbons used in multi-components surrogates [21]–[23], less studies focused on 45
the determination of the laminar burning velocity for gasoline and TRFs, pure [11], [21] or eventually blended with 46
other species (e.g. ethanol) [24], [25], are available on the literature. The aim of the present work is first to validate 47
a specially designed surrogate, the TRF-E (i.e. a blend of TRF with ethanol), as a surrogate of the commercial 48
gasoline (B71 1188 ESSH EURO5 +20, RON 96.6 MON 86.2, Ethanol 5%vol). And, secondly, to provide TRF-E 49
laminar burning velocity database to allow the development of the accurate kinetics mechanism. Effects of pressure, 50
aromatic compounds oxidation and high EGR percentages, in particular, are critical in the development of kinetics 51
mechanisms [26]. It is then fundamental to provide experimental data concerning the combination of all these 52
factors. In fact, current literature includes several studies on mono-component fuels or PRF surrogates diluted by 53
CO2, N2, H2O or a combination of those, like synthetic EGR [7], [8], [27]–[31]. In this sense remarkable work was
54
conducted by Marshall et al. [32] using real combustion residuals as diluent with several mono-component fuels. 55
Nonetheless, there is still a lack of data regarding more complex fuels diluted by EGR. Recently, Mannaa et al. 56
[33] provided a deep investigation on the influence of ethanol and dilution on a gasoline and its surrogate, using 57
real EGR. It was figured out that significant percentages of ethanol (up to 85%) may mitigate the flame speed 58
reduction caused by EGR dilution. Moreover, a stabilization effect due to EGR was observed, comparing delays in 59
the cellularity arising and Markstein lengths of the different blends. As reported in Table 1, the present work 60
focused on a surrogate with relatively low ethanol percentage (5%) and significant toluene percentage (36%). Then, 61
the TRF-E validation and characterization will be crucial in the development of accurate kinetics mechanism, 62
allowing the investigation of aromatics oxidation, high multi-species diluent rate and high pressure effects on the 63
chemistry. On the other hand, the present work aims to furnish the literature with a refined mathematical correlation 64
for laminar burning velocity prediction of TRFE/air/EGR and gasoline/air/EGR blends. 65
2. Experimental Setup
66Reference conditions were fixed at 473 K, 0% EGR dilution and 0.1 MPa. The two fuels were compared for 67
each combination of dilution and pressure at 473 K. Then, the effect of the temperature was evaluated by adding 68
GASOLINE TRF-E
RON 96.6 RON 95
%C, %H, % O (%mass) 85.1/13.1/1.8 %C, %H, % O (%mass) 84.79/13.34/1.87 𝝆 (𝒌𝒈/𝒎𝟑) 753.0 𝝆 (𝒌𝒈/𝒎𝟑) 750.5
Ethanol (%vol) 5.0 Ethanol (%vol) 5.0
n-Heptane (%vol) 3.6 n-Heptane (%vol) 15.0 Olefin (%vol) 6.2 iso-Octane (%vol) 44.0 Aromatic (%vol) 33.7 Toluene (%vol) 36.0
Benzene (%vol) 0.1 - Methyl-cyclohexane (%vol) 1.5 -
other two experimental points (373 and 423 K) at 0.1 MPa and 0% EGR. The equivalence ratio (ϕ) was varied
69
between 0.8 and 1.3. Three tests were performed for each condition. Once the surrogate validation was 70
accomplished through this first investigation, the TRF-E database was widened with the addition of two other 71
values of temperature, 373 and 423 K for the same combination of pressure, dilution and equivalence ratio. This 72
wide range of experimental points allows to deeply evaluate the mathematical correlation initially proposed by [34] 73
and widely used in previous works [7], [8]. Details on the investigated experimental conditions are reported in 74
Table 2. 75
The experimental setup used in the present work allows both laminar and turbulent flame propagation 76
investigation as described in Galmiche et al. [7]. The combustion chamber is a spherical stainless steel vessel with 77
an inner volume of 4.2 l, and an inner diameter of 200 mm. The vessel is equipped with four quartz windows of 70 78
Figure 1: Scheme of the Double-View Schlieren configuration using one high-speed camera for two transversal profiles of the flame.
mm diameter. A heater wire resistance is placed on the outer surface to heat the chamber up to 473 K. A vacuum 79
pump is used to extract all the gases before starting each test, until reach a minimal pressure of 0.005 bar. After 80
that, a set of gaseous flowmeters (Brooks 5850S, 2 NL/min for air, 0.5 NL/min for CO2 and 0.5 NL/min for N2)
81
allows to inject the different gases according to the desired composition. In this respect, the composition of the 82
synthetic air is 20.9% O2 and 79.1% N2. In parallel, two liquid flowmeters (Bronkhorst mini CORI-FLOW 30 g/h) 83
inject the fuel and the water that is requested in the diluent composition. According to the composition of the burned 84
gases in a stoichiometric flame air/TRF-E, the EGR composition is 13.62% CO2, 12.22% H2O and 74.16% N2. The 85
liquid intakes are heated in order to grant a minimal vaporization temperature of 373 K. Inside the combustion 86
chamber a fan assures the homogeneity of the gaseous mixture consequently to the injection. Anyway, the fan is 87
stopped 10 s before the ignition in order to grant that the flow is at rest, avoiding the development of turbulent 88
perturbations. The ignition is realized through two tungsten electrodes, with a diameter of 0.5 mm and distant 1.5 89
mm each other, powered by a conventional capacitive discharge ignition system. The charging time of the ignition 90
coil is set to 3 ms in the present experiments, resulting in a discharge energy of about 100 mJ. Further details on 91
the ignition system can be found in [7], [8], [27]. For each test, a maximum tolerance of 3% was accepted for the 92
initial pressure, while for the temperature 2 K with respect to the fixed value. The flowmeters accuracy settles at 93
Dilution Pressure
Temp. 1 bar 2 bar 3 bar 5 bar
0% EGR
373 K TRF-E & Gasoline TRF-E TRF-E TRF-E
423 K TRF-E & Gasoline TRF-E TRF-E TRF-E
473 K TRF-E & Gasoline TRF-E & Gasoline TRF-E & Gasoline TRF-E & Gasoline
10% EGR
373 K TRF-E TRF-E TRF-E TRF-E
423 K TRF-E TRF-E TRF-E TRF-E
473 K TRF-E & Gasoline TRF-E & Gasoline TRF-E & Gasoline TRF-E & Gasoline
20% EGR
373 K TRF-E TRF-E TRF-E TRF-E
423 K TRF-E TRF-E TRF-E TRF-E
473 K TRF-E & Gasoline TRF-E & Gasoline TRF-E & Gasoline TRF-E & Gasoline
Table 2: Investigated experimental conditions, for each combination of pressure, temperature and EGR dilution, three test were performed at different Equivalence Ratio (0.8, 0.9, 1.0, 1.1, 1.2, and 1.3).
±0.5% of the maximum range. This usually produces a slight excess in the actual injected quantities with respect 94
to the set point. After each test, quantities of liquids and gases injected are verified, to determine the real 95
equivalence ratio at which the experiment was performed. The maximum error can be considered as 5% with 96
respect to the nominal value. For all data provided in the following, real values of equivalence ratio are considered 97
and not the nominal ones. 98
3. Optical Technique and Post-process
99A Double-Views Schlieren configuration was implemented in the combustion vessel to have simultaneously 100
two different views of the flame propagation recorded in just one High Speed Phantom v1610 camera, as reported 101
schematically in Figure 1. The aim is to evaluate the electrodes effect on the flame or the detection of possible 102
irregularities and/or anisotropies in the flame spherical shape, by giving a tridimensional idea of the flame 103
evolution. 104
Two lamps are used as light sources and a set of mirrors, both planar and convex, ensures that the light beam 105
is, respectively, well-oriented and parallel. As reported in the scheme in Figure 1, the light is firstly directed to a 106
parabolic mirror, with a focal length of 800 mm, that is the same distance from the light source, obtaining a parallel 107
beam. After the combustion chamber, another parabolic mirror, equal to the first, is used to converge the light to 108
the cutoff point. Through other two plano-convex lens (with focal length of 250 and 400 mm) the light beam path 109
is optimized to correctly impact the camera objective with the optimal size. The frame rate was fixed at 7000 fps, 110
with a resolution of 1280x800 pixel2 and a ratio mm/pixel equal to 0.1097.
An example of Double-Views of flame is presented in Figure 2. The assumption of a spherical evolution of the 112
flame is consistent. The images post-processing was performed using a MATLAB routine that subtracts the 113
background and performs the binarization of the image. Moreover, a low pass filter is applied in order to smooth 114
the contour and decrease the noise. From the contour, the burnt gas area is computed and, then by considering the 115
flame spherical, an equivalent radius as 116
𝑅𝑆= √
𝐴
𝜋 (1)
117
The maximum radius value considered for the analysis is 25 mm in order to avoid the chamber wall effect on 118
the flame and respect the constant pressure hypothesis [7], [8], [27]. On the other hand, the minimum radius value 119
considered is 6.5 mm due to the ignition system contribution to the initial flame propagation [35]. Within this range, 120
the flame propagation velocity can be estimated as the time derivative of the radius 121
𝑉𝑆=
𝑑𝑟𝑓
𝑑𝑡 (2)
The experimental radius 𝑅𝑆 corresponds to the isothermal detected through the optical technique. Assuming that
122
the flame thickness can be considered infinitesimal, this radius can be approximated with the flame front radius 𝑟𝑓.
123
The stretch rate is computed as (from [36]) 124
Figure 2: Example of flame visualization: TRF-E, Φ=1.1 (T = 473 K, P = 1 bar, EGR = 0%).
𝐾 = 1 𝐴 𝑑𝐴 𝑑𝑡 (3) that is, 125 𝐾 = 2 𝑟𝑓 𝑑𝑟𝑓 𝑑𝑡 (4)
if a spherical expanding flame is considered [36]. 126
Using the stretch rate and the flame speed, the unstretched laminar flame propagation velocity can be estimated 127
through the non-linear correlation proposed by Kelley and Law [37] and methodology described by Halter al. [38]. 128 (𝑉𝑆 𝑉𝑆0) 2 𝑙𝑛 (𝑉𝑆 𝑉𝑆0) 2 = −2𝐿𝑏𝐾 𝑉𝑆0 (5)
Figure 3: TRF-E laminar burning velocities at different pressure values (Figures a, b, c, d) and fixed temperature (T = 473 K) for three dilution rates: experimental points and correlation curves with comparison between 1-step and 2-step optimization.
a) b)
𝐿𝑏 is the Markstein length that correlates the effect of the stretch to the flame speed evolution and accounts for
129
the flame stretch sensitivity. Finally, the unstretched laminar burning velocity 𝑆𝐿0 is determined from the
130
unstretched laminar flame propagation velocity by introducing the expansion factor 𝜌𝑏⁄𝜌𝑢
131
𝑆𝐿0=
𝜌𝑏
𝜌𝑢
𝑉𝑆0 (6)
Where the expansion factor is estimated by computing the burned and unburned densities through the EQUIL 132
code from CHEMKIN package [39]. Due to the difficulty to implement the correct gasoline composition in the 133
chemical equilibrium software, the chemical composition of the TRF-E can be used for the computation of the 134
gasoline laminar burning velocity. This approximation will be justified in the results section, comparing the similar 135
dynamic behavior of the two fuels (i.e. flame propagation speed dependence on stretch rate). 136
4. Mathematical Correlation
137Initially proposed by Metghalchi and Keck [34] and widely used in the literature, the mathematical correlation 138
aims to predict the laminar burning velocity of a specific fuel starting from the mixture and thermodynamic 139
parameters. This means that it is possible to write a relationship such that 𝑆𝐿0= (𝑇𝑖, 𝑃𝑖, ϕ), corresponding to the
140
Figure 4: TRF-E and gasoline propagation speed function of stretch rate. The data are extrapolated from test performed at pressure of 3 bar, dilution of 10% EGR and temperature of 473 K. Experimental data are reported as well as nonlinear Kelly and Law correlation. Extrapolated unstretched propagation speed and radii range analyzed are reported.
explicit form 141 𝑆𝐿0= 𝑆𝐿𝑟𝑒𝑓0 ( 𝑇𝑖 𝑇𝑟𝑒𝑓 ) 𝛼𝑆 ( 𝑃𝑖 𝑃𝑟𝑒𝑓 ) 𝛽𝑆 (7)
Where 𝑇𝑟𝑒𝑓 and 𝑃𝑟𝑒𝑓 are respectively the reference temperature and the pressure and 𝑆𝐿𝑟𝑒𝑓0 the laminar burning
142
velocity under these conditions (expressed in cm/s). Then, the terms 𝑆𝐿𝑟𝑒𝑓0 , 𝛼𝑆 and 𝛽𝑆 are a function of the
143
equivalence ratio 𝜙, hence 144
𝑆𝐿𝑟𝑒𝑓0 = 𝐴 + 𝐵(𝜙 − 𝜙𝑚) + 𝐶(𝜙 − 𝜙𝑚)2 (8)
𝛼𝑆= 𝛼0+ 𝛼1(𝜙 − 𝜙𝑚) (9)
𝛽𝑆= 𝛽0+ 𝛽1(𝜙 − 𝜙𝑚) (10)
with 𝜙𝑚 representing the reference equivalence ratio equal to 1.1.
Nevertheless, according to Varea et al. [40], the pressure dependence is not linear and, thus, the pressure term 146
evolves following a quadratic law yielding to a different equation of the exponent 𝛽𝑆, that is
147
𝛽𝑆= 𝛽0+ 𝛽1(𝜙 − 𝜙𝑚) + 𝛽2(𝜙 − 𝜙𝑚)2. (11)
Galmiche et al. [7] proposed to implement the effect of dilution by adding a third term and, thus, a new exponent 148
is introduced 149
𝛾𝑆= 𝛾0+ 𝛾1(𝜙 − 𝜙𝑚) (12)
Then, the complete relationship is 150
Figure 5: TRF-E and gasoline Markstein lengths comparison at different pressure values (Figures a, b, c, d) and fixed temperature (T = 473 K) for three dilution rates.
c) d) a) b)
𝑆𝐿0= 𝑆𝐿𝑟𝑒𝑓0 ( 𝑇𝑖 𝑇𝑟𝑒𝑓 ) 𝛼𝑆 ( 𝑃𝑖 𝑃𝑟𝑒𝑓 ) 𝛽𝑆 ( 𝜐𝑂2𝑖 𝜐𝑂2𝑟𝑒𝑓 ) 𝛾𝑆 . (13)
In this new correlation the term 𝜐𝑂2takes into account the percentage of oxygen in the global mixture of synthetic
151
air and diluent, thus 152
𝜐𝑂2=
𝑛𝑂2(𝑎𝑖𝑟)
𝑛𝑂2(𝑎𝑖𝑟)+ 𝑛𝑁2(𝑎𝑖𝑟)+ 𝑛 (𝑑𝑖𝑙𝑢𝑒𝑛𝑡)
× 100 (14)
where n refers to the number of moles of the different mixture components. 153
The global optimization consists in resolving the minimization problem in which the objective function is the 154
mean squared error between the experimental data and the correlation (13). In order to find all the coefficients the 155
optimization process is developed in two phases: 156
- First, the coefficients A, B and C are determined under the reference conditions, therefore only the 157
relative experimental data are taken into account; 158
- In the second phase are then included all the other points. In this way it is possible to compute the 159
coefficients that appear in Eq. 9, Eq. 11 and Eq. 12, obtaining the exponents 𝛼𝑆, 𝛽𝑆 and 𝛾𝑆.
160
Figure 6: TRF-E and gasoline laminar burning velocities comparison at 1 bar initial pressure without dilution for three initial temperature conditions..
Moreover, in the present study, the optimization process is performed in two steps for both the procedures just 161
discussed. In other words, starting from a generic initial guess (e.g. a vector of zeroes) a raw solution is calculated 162
and, successively, this is used as initial guess for a second iterative process. It was found that for the coefficient A, 163
B and C this procedure is redundant, as the algorithm converges to the final optimized solution also with the first 164
generic initial guess. On the contrary, the determination of the exponents is strongly affected by the 2-step process 165
leading to a significant difference of the results. The difference between the 1-step and the 2-step derived 166
coefficients is illustrated in Figure 3. The figure highlights the enhancement of accuracy of the 2-step coefficients, 167
in particular for rich mixtures. Anyway, it was observed that any further iterative process led to the same problem 168
solution obtained at the second step, independently on the initial generic guess of the first step. The results of this 169
investigation are reported in 170
Table 3 and Table 4. The TRF-E coefficients are further refined by extending the experimental matrix. Other 171
two temperatures were investigated, combining the full range of considered dilution and pressure. 172
Figure 7: TRF-E and gasoline laminar burning velocities comparison at different pressure values (Figures a, b, c, d) and fixed temperature (T = 473 K) for three dilution rates.
a) b)
5. Results and Discussion
173For what concerns the laminar burning velocities extrapolation, as discussed in the previous sections the data 174
reliability must be evaluated in terms of both post-process uncertainties and experimental limits (e.g. misfire due 175
to high dilution percentage at low temperature and/or pressure that reduce the flammability limits, or cellularity 176
due to high equivalence ratio and relatively high pressure and/or low temperature). Among these latter, the use of 177
the non-linear equation previously introduced yields more precise results with respect to the linear one, especially 178
when the burned gases’ Markstein length reaches or exceeds the unity [38]. As discussed in the Section 3, ignition 179
effect and wall influence reduce the range of the radii (6.5 – 25 mm). The arising of early cellularity for high 180
equivalence ratio and relatively high pressure and/or may further reduce this range [19]. Moreover, the contour 181
c) d) a) b)
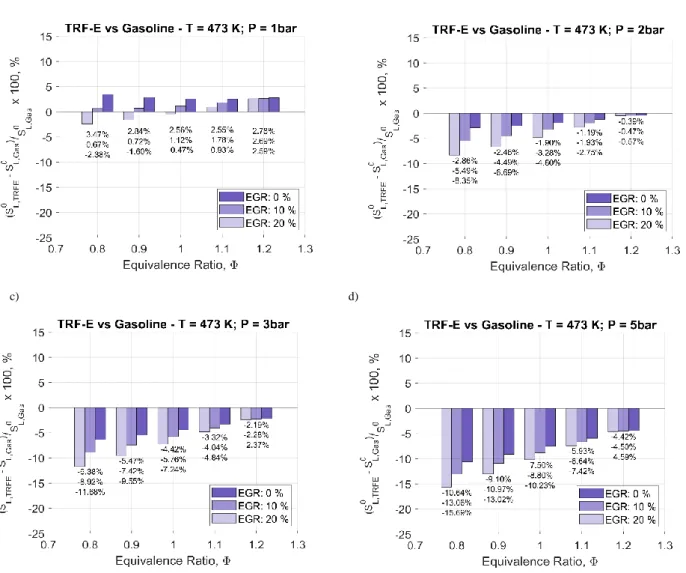
Figure 8: TRF-E and gasoline laminar burning velocities difference at different equivalence ratio for increasing pressure (Figures a, b, c, d) and dilution (EGR = 0, 10, 20 %) at fixed temperature (T = 473 K).
detection scripts may introduce subsequent errors that must be taken into account. For all these reasons, it is 182
important to remark that the error bars displayed in the following subsections will be representative not only of the 183
corrected standard deviation but also of the post-process uncertainties introduced [41], and are computed by adding 184
the different uncertainties in quadrature. 185
𝑒𝑟𝑟𝑡𝑜𝑡= √(𝑒𝑟𝑟𝑝𝑜𝑠𝑡−𝑝𝑟𝑜𝑐𝑒𝑠𝑠)2+ (𝑒𝑟𝑟𝑠𝑡𝑎𝑡𝑖𝑠𝑡𝑖𝑐)2 . (15)
5.1. TRF-E Validation as gasoline surrogate
186
In order to evaluate how the TRF-E surrogate fits the properties of the investigated gasoline, the comparison of 187
the different laminar burning velocities is performed under several experimental conditions as seen in Table 2. In 188
particular, the accordance between the two fuels must be evaluated under reference conditions and, then, by 189
changing the relevant parameters. This will allow appreciating how the surrogate responds to this variation and 190
how it “follows” the gasoline behavior, quantifying the differences. 191
As introduced in the previous section, an error is normally introduced in the calculation of the gasoline 192
expansion factor using the TRF-E composition. Anyway, evaluating the dynamic behavior of the two fuels (that is, 193
the propagation speed as function of the stretch rate and, thus, the Markstein length) it is possible the strength of 194
this approximation. Figure 4 reports the stretched propagation speed as function of the stretch rate for both the 195
TRF-E and the gasoline, for one representative condition (𝑇 = 473 𝐾, P = 0.3 MPa, ϕ = 1.0 and 10% EGR). It 196
Coefficient Optimized value – Gasoline Optimized value – TRF-E
1-step 2-step 1-step 2-step
A 71.2043 71.2043 73.0208 73.0208 B 2.7185 2.7185 3.5315 3.5315 C -142.8526 -142.8526 -138.1265 -138.1265 𝜶𝟎 0.8259 1.6437 1.4977 1.7696 𝜶𝟏 -0.7370 -0.8478 -1.1148 0.3151 𝜷0 -0.17857 -0.1926 -0.2325 -0.2463 𝜷1 -0.2150 -0.1195 -0.0428 -0.0242 𝜷2 -2.0643 -1.5001 -2.2700 -1.5983 𝜸𝟎 3.3959 3.3782 3.4994 3.4494 𝜸1 -0.1844 1.3476 -0.0872 0.7151
Table 3: Mathematical correlation coefficients (relative to the laminar burning velocity) for both TRF-E and gasoline determined at fixed temperature and different values of equivalence ratio, pressure and dilution. Coefficients A, B, C refer to the equivalence ratio fitting equation at reference conditions. First column of each fuel displays the classic one-step method that solves the global optimization problem only once. The second column consists of a further system resolution using the 1-step coefficients as initial guess.
Coefficient (without temperature variation) Optimized value – TRF-E (with temperature variation) Optimized value – TRF-E
1-step 2-step 1-step 2-step
A 73.0208 73.0208 73.0208 73.0208 B 3.5315 3.5315 3.5315 3.5315 C -138.1265 -138.1265 -138.1265 -138.1265 𝜶𝟎 1.4977 1.7696 1.7702 1.7495 𝜶𝟏 -1.1148 0.3151 -1.2579 -0.1010 𝜷0 -0.2325 -0.2463 -0.2453 -0.2481 𝜷1 -0.0428 -0.0242 -0.1499 0.0232 𝜷2 -2.2700 -1.5983 -1.7451 -1.7739 𝜸𝟎 3.4994 3.4494 3.5018 3.4143 𝜸1 -0.0872 0.7151 -1.9900 0.4252
Table 4: Mathematical correlation coefficients (relative to the laminar burning velocity) for TRF-E fuel determined at fixed temperature and different values of equivalence ratio, pressure and dilution firstly, and then including temperature variation in the global optimization problem. Coefficients A, B, C refer to the equivalence ratio fitting equation at reference conditions. First column of each fuel displays the classic one-step method that solves the global optimization problem only once. The second column consists of a further system resolution using the 1-step coefficients as initial guess.
seems clear that, in this case, the dynamic behavior of TRF-E and gasoline is similar. Figure 5 summarizes the 197
comparison between Markstein lengths of the two fuels under the investigated conditions. Figure 5 (a) and (b) 198
evidence a very good agreement between TRF-E and gasoline for every equivalence ratio. With increasing pressure, 199
anyway, the Markstein length determination becomes tougher. Figure 5 (c) highlights points scattering in the rich 200
zone, with also large error bar, while Figure 5 (d) presents large uncertainties over all the equivalence ratio range. 201
However, at the end of this consideration, it has sense to assume that the error in the computation of the expansion 202
factor could be negligible since the two fuels exhibit similar dynamic behavior. 203
According to Figure , under reference conditions (𝑇𝑟𝑒𝑓, 𝑃𝑟𝑒𝑓, 𝐸𝐺𝑅𝑟𝑒𝑓), the laminar burning velocity of TRF-E
204
with respect to gasoline is in a relative short interval (−2.70 %, −3.36 %, see Figure Figure (b)) among all 205
investigated ER range. On the other hand, decreasing temperature affects the laminar burning velocity of the two 206
fuels in a different way. In fact, though the TRF-E shows a constant lowering for all ER values, maintaining the 207
same curve shape, the gasoline exhibits a stronger slowdown in lean conditions with respect to the rich zone that, 208
on the contrary, seems to be less influenced. That corresponds to a change in the curve shape and a slight shifting 209
of the maximum gasoline 𝑆𝐿0 value to higher ER. As seen in Figure (a), at 𝑇 = 423 𝐾, gasoline laminar burning
210
velocity is still lower than the TRF-E one for lean mixtures. The laminar burning velocity of the two fuels is similar 211
after ϕ = 1.1. On the contrary, at 𝑇 = 373 𝐾, after ϕ = 1.1, gasoline rich mixtures are faster than TRF-E ones. 212
Figure (b) quantifies the gap between the two fuels at 𝑇 = 373 𝐾, 423 K and 473 K. 213
Figure displays the laminar burning velocities of the two fuels for all different investigated pressures by varying 214
the dilution rate at fixed temperature (𝑇 = 473 𝐾). Increasing EGR rate produces an opposite effect with respect 215
to the previously discussed temperature reduction. Therefore, the leaner is the gasoline mixture, the less it is 216
influenced by the increase of dilution. This leads to the trend inversion with respect to temperature case as 217
highlighted in Figure (a-b). This behavior induces an intersection of the two fuels curves, as seen in Figure (b), as 218
the TRF-E is equally affected within all the ER range. For the other graphs, that is, Figure (c-d), this phenomenon 219
is partially hidden by the pressure influence. In fact, increasing pressure decreases significantly the laminar burning 220
velocity more strongly for TRF-E than for gasoline, independently of the ER (in Figure (d) TRF-E has become 221
slower than gasoline among the whole ER range). As reported in Figure (a-d) the combination of dilution rate and 222
pressure increase leads to an appreciable difference between the laminar burning velocities of the two fuels for lean 223
mixtures. On the contrary, this discrepancy is less evident for increasing ϕ values. The gap between the two fuels 224
is quantified in Figure, where the dependency on the ER is also put in emphasis. 225
The mathematical correlation, as observed in the graphs reported in the present section, leads to quite precise 226
results evidencing a good predictability of the fuels behavior. As expected, the hardest conditions underlie the 227
largest discrepancies, that is, high pressure or high dilution rate or the combination of both (Figure (d)). The 228
optimized coefficients are reported in 229
Table 3, for both the 1-step and the 2-step coefficients. The fact that the gasoline and TRF-E coefficient are 230
significantly close supports the appreciable properties of the TRF-E as gasoline surrogate. This is also confirmed 231
by the accordance of the experimental data under the great part of the investigated conditions, evidencing large 232
discrepancy in the laminar burning velocity values only under the hardest condition (high dilution and pressure and 233
low equivalence ratio). Anyway, this gap is limited to ~15 % in the worst cases (see Figure (d)). 234
5.2 TRFE extended condition
235
Once the direct comparison between the gasoline and its surrogate was performed and critically analyzed, the 236
experimental conditions grid was extended for the TRF-E in order to increase the mathematical correlation 237
precision and enlarge the data availability for future kinetic model development. Table 4 shows the coefficients 238
obtained at fixed temperature but with pressure and dilution variations and the ones computed by solving the 239
enlarged global optimization problem (that is, taking into account all the combinations with temperature variation 240
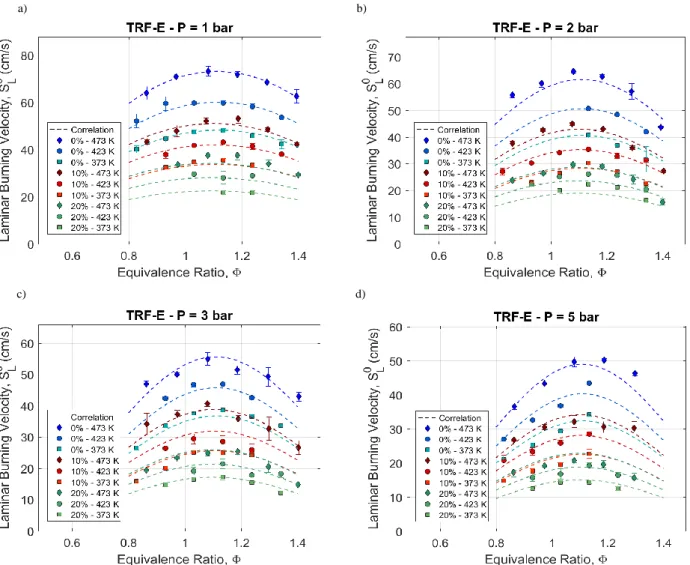
in addition). Figure shows the TRF-E laminar burning velocities under the investigated conditions. In particular, 241
for sake of clearance, the temperature and dilution variation curves are reported for each different considered 242
pressure. This approach points out several evidences. First, for what concerns the experimental investigation it is 243
possible to notice that for some limit conditions there is a lack of experimental points. For example, at low pressure 244
and temperature and high dilution rate ignition problems could be experienced leading to a reduction of the ER 245
investigated range. This could also affects the quality of the global optimization due to a non-uniform number of 246
points for the different thermodynamic conditions. At the same time, during the post-processing, other issues could 247
limit the meaningful radii that it is possible to consider, avoiding thermo-diffusive instabilities. A concurrency 248
effect of high pressure, low temperature and high equivalence ratio leads to an early cellularity arising and, thus, 249
to a lack of exploitable points under certain equivalence ratios, as can be seen in Figure . The result is that the great 250
part of collected data is in the lean zone for certain parameters combinations. Despite this, once again the correlation 251
seems to adequately fit the experimental data even though a not negligible overestimation is observed for 10 and 252
20 % dilution rate at 3 and 5 bar when the temperature is 423 or 473 K (Figure (c-d)). On the contrary, lower 253
pressure (that is, 1 and 2 bar) may lead to a slight underestimation for 20 % of dilution rate (Figure (a-b)). Figure 254
10 summarizes these differences in terms of absolute error of the laminar burning velocity correlation with respect 255
to the experimental data. The bars height and color proportionally depend on the error entity. Each combination of 256
dilution and pressure is reported, considering three equivalence ratio (1.0, 1.1, 1.2). Figure 10 (a) illustrates the 257
fitting quality at 𝑇 = 373 𝐾 in which the major differences are obtained for 0.2 MPa and 20% dilution and 0.5 258
MPa and 10% dilution. Beside these cases the error is limited to 6-7%. On the contrary, at 𝑇 = 423 𝐾, the average 259
error at low (10%) or zero dilution is lower except for pressure of 0.2 MPa (ϕ = 1.2) and 0.3 MPa (ϕ = 1.1 − 260
1.2). At 20% dilution, and pressure higher than atmospheric, error is still around 10%. Finally Figure 10 (c) reports 261
results at 𝑇 = 473 𝐾 (that is, reference temperature). In this case the error is generally low (less than 6%) except 262
for a case at 20% dilution and 0.1 MPa and all the considered equivalence ratios at 20% and 0.5 MPa (error around 263
12%). 264
6. Conclusions
265A deep investigation on the laminar burning velocities of two fuels was performed. In the present work, a wide 266
database is set up for a pure gasoline (B71 1188 ESSH EURO5 +20, RON 96.6 MON 86.2, Ethanol 5%vol) and its 267
four-components surrogate named TRF-E. Markstein lengths of the two fuels were also analyzed and compared. It 268
was found that the Markstein length trend is similar over an appreciable range of experimental conditions. The 269
comparison lacks in precision just at relatively high values of pressure. In fact, at 0.3 MPa, and for rich mixtures, 270
negative Markstein lengths can be observed for both fuels with large error bars. In addition, at 0.5 MPa the direct 271
comparison of the Markstein length is even more complex due to the uncertainties in the determination of the 272
gasoline Markstein length at 10% or 20% dilution. Despite this, dynamic behavior of the two fuels (i.e., propagation 273
speed dependence on stretch rate) is similar. Moreover, it was observed a good agreement of the laminar burning 274
velocity values. Over a wide range of pressure, dilution and temperature, the difference in laminar burning velocity 275
between gasoline and TRF-E is limited at ~ 15% for the worst case (0.5 MPa, 473 K, 20% EGR and 0.8 equivalence 276
ratio). In general, the major divergence between the behavior of the two fuels is caused by the pressure increase. 277
The effect of dilution is low, highlighting the fact that the TRF-E can replicate the gasoline properties at high 278
dilution rate. Temperature variation, as well, has a similar effect on both the fuels even if a dependence on the 279
equivalence ratio was observed. In fact, it was found out that for 𝜙 > 1 the TRF-E properly follows the gasoline 280
response to pressure, temperature and dilution variations. On the contrary, for lean mixtures the differences are 281
accentuated. As a consequence TRF-E is an acceptable surrogate for the exanimated gasoline. Anyway, it has to 282
be remarked that a further increase in pressure (with respect to the investigated 0.5 MPa) may lead to non-negligible 283
difference in laminar burning velocity, in particular for lean mixtures. 284
The gathered data permitted to determine the optimized coefficients of the well-known mathematical correlation 285
proposed by Metghalchi and Keck [34] and extended by Galmiche et al. [7] to include the dilution rate with an 286
acceptable precision even under experimental conditions far from the reference ones. A further step in this direction 287
is represented by the extended experimental grid for the TRF-E that allowed to additionally refine the optimized 288
coefficients. Moreover, the thoroughness of the investigated experimental points yields an optimal pool for the 289
future development of highly refined chemical kinetic mechanisms. In fact, the database includes not only a wide 290
range of each fundamental parameter (temperature, pressure, dilution rate and equivalence ratio) with respect to 291
the reference conditions, but also a total combination of all their different values within the investigated ranges. 292
The correlation error with respect to the experimental points was evaluated, leading to the conclusion that a good 293
agreement generally exists among the great part of the investigated conditions. 294
6.1 Next Future Work
295
Exploiting the huge amount of data gathered during this investigation, next steps will consist of developing of 296
the TRF-E kinetic mechanism. 297
c) d) a) b)
Figure 9: TRF-E laminar burning velocity comparison at different pressure values (Figures a, b, c, d), switching both temperature (T = 373 - 423 - 473 K) and dilution percentages (EGR = 0 - 10 - 20 %)
In addition to this path, the experimental conditions will be extended in terms of pressure, temperature and 298
dilution, using another experimental set-up, in order to extend the validity of the mathematical correlation. 299
300
ACKNOLEDGEMENTS 301
This work was supported by the Agence National de la Recherche (ANR) in the MACDIL (“Moteur à Allumage 302
Commandé à fort taux de DILution”) project. 303
304
c) d)
a) b)
Figure 10: TRF-E laminar burning velocity comparison between experimental points and correlation at three different temperatures (T = 373 (a) – 423 (b) – 473 (c) K). Each plot reports the absolute value of the percentage error between the experimental point and the correlation fitting for each combination of pressure and dilution. Both color and height of the bar are representative of the entity of the error. Moreover, for each points (X,Y) three bars are present: the one at the forefront correspond to an ER of 1.0, the intermediate to an ER of 1.1 and the last to an ER of 1.2. Where bar is missing no experimental point is available.
REFERENCES
[1] N. Peters, “Laminar flamelet concepts in turbulent combustion,” Symp. Combust., vol. 21, no. 1, pp. 1231–1250, 1988.
[2] C. Mounaïm-Rousselle, L. Landry, F. Halter, and F. Foucher, “Experimental characteristics of turbulent premixed flame in a boosted Spark-Ignition engine,” Proc. Combust. Inst., vol. 34, no. 2, pp. 2941–2949, 2013.
[3] S. Richard, O. Colin, O. Vermorel, A. Benkenida, C. Angelberger, and D. Veynante, “Towards large eddy simulation of combustion in spark ignition engines,” Proc. Combust. Inst., vol. 31 II, pp. 3059– 3066, 2007.
[4] O. Vermorel, S. Richard, O. Colin, C. Angelberger, A. Benkenida, and D. Veynante, “Towards the understanding of cyclic variability in a spark ignited engine using multi-cycle LES,” Combust. Flame, vol. 156, no. 8, pp. 1525–1541, 2009.
[5] P. Boudier, S. Henriot, T. Poinsot, and T. Baritaud, “A model for turbulent flame ignition and propagation in spark ignition engines,” Proc. Combust. Inst., vol. 24, no. 1, pp. 503–510, 1992.
[6] O. Colin and A. Benkenida, “3D Modelling of Mixing, Ignition and Combustion Phenomena in Highly Startified Gasoline Engines,” Ecfm, vol. 58, no. 1, pp. 47–62, 2003.
[7] B. Galmiche, F. Halter, and F. Foucher, “Effects of high pressure, high temperature and dilution on laminar burning velocities and Markstein lengths of iso-octane/air mixtures,” Combust. Flame, vol. 159, no. 11, pp. 3286–3299, 2012.
[8] C. Endouard, F. Halter, C. Chauveau, and F. Foucher, “Effects of CO2, H2O, and Exhaust Gas Recirculation Dilution on Laminar Burning Velocities and Markstein Lengths of Iso-Octane/Air Mixtures,” Combust. Sci. Technol., vol. 188, no. 4–5, pp. 516–528, 2016.
[9] X. Wu, Z. Huang, X. Wang, C. Jin, C. Tang, L. Wei, and C. K. Law, “Laminar Burning Velocities and Flame Instabilities of 2,5-Dimethylfuran-Air Mixtures at Elevated Pressures”, Combustion and flame, vol. 158, pp. 539-546. 2011.
[10] P. Brequigny, G. Dayma, F. Halter, C. Mounaïm-Rousselle, T. Dubois, and P. Dagaut, “Laminar burning velocities of premixed nitromethane/air flames: An experimental and kinetic modeling study,” Proc.
[11] O. Mannaa, M. S. Mansour, W. L. Roberts, and S. H. Chung, “Laminar burning velocities at elevated pressures for gasoline and gasoline surrogates associated with RON,” Combust. Flame, vol. 162, no. 6, pp. 2311–2321, 2015.
[12] W. J. Pitz, N. P. Cernansky, F. L. Dryer, F. N. Egolfopoulos, J. T. Farrell, and D. G. Friend, “Development of an Experimental Database and Chemical Kinetic Models for Surrogate Gasoline Fuels,” 2007.
[13] A. P. Cruz, C. Pera, J. Anderlohr, R. Bounaceur, A. P. Cruz, C. Pera, J. Anderlohr, R. Bounaceur, and F. B. A, “A complex chemical kinetic mechanism for the oxidation of gasoline surrogate fuels : n heptane , iso octane and toluene - Mechanism development and validation To cite this version : HAL Id : hal-00370855,” 2009.
[14] T. Edwards, M. Colket, N. Cernansky, F. Dryer, F. Egolfopoulos, D. Friend, E. Law, D. Lenhert, P. Lindstedt, H. Pitsch, A. Sarofim, K. Seshadri, M. Smooke, W. Tsang, and S. Williams, “Development of an Experimental Database and Kinetic Models for Surrogate Jet Fuels,” in 45th AIAA Aerospace
Sciences Meeting and Exhibit, American Institute of Aeronautics and Astronautics, 2007.
[15] R. H. Stanglmaier, C. E. Roberts, D. Mehta, C. Chadwell, J. Corwin Snyder, M. I. Watkins, and N. L. Avery, Measurement of Laminar Burning Velocity of Multi-Component Fuel Blends for Use in
High-Performance SI Engines. 2003.
[16] R. Bounaceur, O. Herbinet, R. Fournet, P.-A. Glaude, F. Battin-Leclerc, A. Pires da Cruz, M. Yahyaoui, K. Truffin, and G. Moreac, Modeling The Laminar Flame Speed of Natural Gas and Gasoline
Surrogates, vol. SAE. 2010.
[17] S. Jerzembeck, N. Peters, P. Pepiot-Desjardins, and H. Pitsch, “Laminar burning velocities at high pressure for primary reference fuels and gasoline: Experimental and numerical investigation,” Combust.
Flame, vol. 156, no. 2, pp. 292–301, 2009.
[18] J. P. J. Van Lipzig, E. J. K. Nilsson, L. P. H. De Goey, and A. A. Konnov, “Laminar burning velocities of n -heptane , iso-octane , ethanol and their binary and tertiary mixtures,” Fuel, vol. 90, no. 8, pp. 2773– 2781, 2011.
[19] D. Bradley, R. A. Hicks, M. Lawes, C. G. W. Sheppard, and R. Woolley, “The measurement of laminar burning velocities and Markstein numbers for iso-octane-air and iso-octane-n-heptane-air mixtures at
elevated temperatures and pressures in an explosion bomb,” Combust. Flame, vol. 115, no. 1–2, pp. 126– 144, 1998.
[20] J. T. Farrell, R. J. Johnston, and I. P. Androulakis, “Molecular Structure Effects On Laminar Burning Velocities At Elevated Temperature And Pressure,” 2004.
[21] L. Sileghem, V. A. Alekseev, J. Vancoillie, K. M. Van Geem, E. J. K. Nilsson, S. Verhelst, and A. A. Konnov, “Laminar burning velocity of gasoline and the gasoline surrogate components iso-octane, n-heptane and toluene,” Fuel, vol. 112, pp. 355–365, 2013.
[22] D. Bradley, M. Lawes, K. Liu, S. Verhelst, and R. Woolley, “Laminar burning velocities of lean hydrogen – air mixtures at pressures up to 1 . 0 MPa,” vol. 149, pp. 162–172, 2007.
[23] S. G. DAVIS and C. K. LAW, “Determination of and Fuel Structure Effects on Laminar Flame Speeds of C1 to C8 Hydrocarbons,” Combust. Sci. Technol., vol. 140, no. 1–6, pp. 427–449, Dec. 1998. [24] P. Dirrenberger, P. A. Glaude, R. Bounaceur, H. Le Gall, A. Pires, A. A. Konnov, and F. Battin-leclerc,
“Laminar burning velocity of gasolines with addition of ethanol,” Fuel, vol. 115, pp. 162–169, 2014. [25] A. A. Konnov, R. J. Meuwissen, and L. P. H. De Goey, “The temperature dependence of the laminar
burning velocity of ethanol flames,” Proc. Combust. Inst., vol. 33, no. 1, pp. 1011–1019, 2011.
[26] H. J. Curran, “Developing detailed chemical kinetic mechanisms for fuel combustion,” Proc. Combust.
Inst., vol. 37, no. 1, pp. 57–81, 2018.
[27] B. Galmiche, F. Halter, F. Foucher, and P. Dagaut, “Effects of Dilution on Laminar Burning Velocity of Premixed Methane / Air Flames,” Energy and Fuels, vol. 25(3), no(3), pp. 948–954, 2011.
[28] J. Santner, F. L. Dryer, and Y. Ju, “The effects of water dilution on hydrogen, syngas, and ethylene flames at elevated pressure,” Proc. Combust. Inst., vol. 34, no. 1, pp. 719–726, 2013.
[29] F. Halter, F. Foucher, L. Landry, and C. Mounaïm-Rousselle, “Effect of Dilution by Nitrogen and/or Carbon Dioxide on Methane and Iso-Octane Air Flames,” Combust. Sci. Technol., vol. 181, no. July 2014, pp. 813–827, 2009.
[30] T. Tahtouh, F. Halter, E. Samson, and C. Mouna??m-Rousselle, “Effects of hydrogen addition and nitrogen dilution on the laminar flame characteristics of premixed methane-air flames,” Int. J. Hydrogen
Energy, vol. 34, no. 19, pp. 8329–8338, 2009.
burning velocity of iso-octane in oxygen-enriched and CO2-diluted air,” Combust. Flame, vol. 158, no. 12, pp. 2375–2383, 2011.
[32] S. P. Marshall, S. Taylor, C. R. Stone, T. J. Davies, and R. F. Cracknell, “Laminar burning velocity measurements of liquid fuels at elevated pressures and temperatures with combustion residuals,”
Combust. Flame, vol. 158, no. 10, pp. 1920–1932, 2011.
[33] O. A. Mannaa, M. S. Mansour, W. L. Roberts, and S. H. Chung, “Influence of Ethanol and Exhaust Gas Recirculation on Laminar Burning Behaviors of Fuels for Advanced Combustion Engines (FACE-C) Gasoline and Its Surrogate,” Energy and Fuels, vol. 31, no. 12, pp. 14104–14115, 2017.
[34] M. Metghalchi and J. C. Keck, “Burning velocities of mixtures of air with methanol, isooctane, and indolene at high pressure and temperature,” Combust. Flame, vol. 48, no. C, pp. 191–210, 1982. [35] D. Bradley, P. H. Gaskell, and X. J. Gu, “The modeling of aerodynamic strain rate and flame curvature
effects in premixed turbulent combustion,” Symp. Combust., vol. 27, no. 1, pp. 849–856, 1998.
[36] S. M. CANDEL and T. J. POINSOT, “Flame Stretch and the Balance Equation for the Flame Area,”
Combust. Sci. Technol., vol. 70, no. 1–3, pp. 1–15, Mar. 1990.
[37] A. P. Kelley and C. K. Law, “Nonlinear effects in the extraction of laminar flame speeds from expanding spherical flames,” Combust. Flame, vol. 156, no. 9, pp. 1844–1851, 2009.
[38] F. Halter, T. Tahtouh, and C. Mounaïm-Rousselle, “Nonlinear effects of stretch on the flame front propagation,” Combust. Flame, vol. 157, no. 10, pp. 1825–1832, 2010.
[39] R. J. K. A.E. Lutz, F.M. Rupley, “Equil: A Chemkin Implementation of Stanjan for Computing Chemical Equilibria, Sandia National Laboratories Livermore, CA 94551.” 1992.
[40] E. Varea, V. Modica, B. Renou, and A. Boukhalfa, “Pressure effects on laminar burning velocities and
Markstein lengths for Isooctane–Ethanol–Air mixtures,” Proc. Combust. Inst., vol. 34. 2013.
[41] R. J. Moffat, “Describing the uncertainties in experimental results,” Exp. Therm. Fluid Sci., vol. 1, no. 1, pp. 3–17, 1988.