HAL Id: cea-02339776
https://hal-cea.archives-ouvertes.fr/cea-02339776
Submitted on 5 Nov 2019HAL is a multi-disciplinary open access
archive for the deposit and dissemination of sci-entific research documents, whether they are pub-lished or not. The documents may come from teaching and research institutions in France or abroad, or from public or private research centers.
L’archive ouverte pluridisciplinaire HAL, est destinée au dépôt et à la diffusion de documents scientifiques de niveau recherche, publiés ou non, émanant des établissements d’enseignement et de recherche français ou étrangers, des laboratoires publics ou privés.
The effect of magnesium on the local structure and
initial dissolution rate of simplified UK Magnox waste
glasses
R. Guo, C.T. Bridgen, S. Gin, S.W. Swanton, I. Farnan
To cite this version:
R. Guo, C.T. Bridgen, S. Gin, S.W. Swanton, I. Farnan. The effect of magnesium on the local structure and initial dissolution rate of simplified UK Magnox waste glasses. Journal of Non-Crystalline Solids, Elsevier, 2018, 497, pp.82-92. �10.1016/j.jnoncrysol.2018.03.002�. �cea-02339776�
The effect of magnesium on the local structure and initial
dissolution rate of simplified UK Magnox waste glasses
R. Guoa*, C.T. Brigdena†, S. Ginb, S.W. Swantonc and I. Farnana
a Department of Earth Sciences, University of Cambridge Downing Street, Cambridge, CB2 3EQ, UK
b CEA Marcoule, DE2D SEVT, F-30207 Bagnols-sur-Ceze, France
c Wood Group, B150 Harwell Campus Didcot, Oxon, OX11 0QB
*
Corresponding author.
E-mail address: rg472@cam.ac.uk
Key words
Radioactive waste immobilisation; Borosilicate glasses; Dissolution; Solid-state NMR; Magnesium
Figure colour
Colours should be used for Figure 2, Figure 3, Figure 4, Figure 5, Figure 6, Figure 7 and Figure 8
1. Introduction
The majority of radioactive waste glass produced in the UK contains magnesium (Mg). This arises for historical reasons from the Mg-containing alloy cladding used on the natural uranium fuel of the first generation UK Magnox reactors. This Mg is entrained in the fission product fraction following fuel re-processing operations and becomes incorporated into the glass wasteform on vitrification. At least two studies [1, 2] have shown that in long-term (up to 12.2 years), simulant UK Magnox waste glass containing Mg (and nominally no calcium (Ca)) have significantly poorer aqueous durability compared with Ca-based glasses such as the French benchmark SON68 inactive glass simulant. This paper describes a separate effect study of the influence of the substitution of Mg on the pristine structures and initial dissolution rate of simplified UK Magnox waste glasses.
The simulant Magnox waste glass with a 25 wt% waste loading (herein referred to as MW25) contains 23 oxide components (see supplementary materials), the aim of this work is to produce a simplified glass with 6-7 components that represents the main compositional features of the complex glass and allows the separate effect of Ca and Mg on glass structure to be established with all other parameters being equal. As the major structural probe will be NMR (nuclear magnetic resonance), paramagnetic lanthanides have been substituted by lanthanum (La) and iron (Fe) has been left out of the compositional mapping.
The similarity between MW25 and the simplified analogue needs to be verified for the use of simplified glass to study its full-component counterpart to be valid, especially from a Mg point of view. 25Mg MAS NMR provides a powerful tool to investigate the local Mg environments in glasses. The major cations present in the glass are boron (B) and silicon (Si), these act as the network formers which are linked via bridging oxygens to form the network of the glass structure. Si is primarily in four-fold coordination, this is the origin of the Qn
(quaternary) Si speciation. The number n, ranging from 1-4, denotes the number of bridging oxygens attached to a silicate tetrahedron. B is distributed in either three- or four-fold coordination depending on the nature and the availability of charge balancing cations. This was explored in the series of simplified glasses by 11B MAS (Magic Angle Spinning) NMR. Other structural changes due to Mg substitution, similarly, were examined by using 23Na and 27Al nuclei as NMR probes to elucidate the local coordination changes and overall charge balancing scheme.
In long-term experiments, B release is considered as the proxy for measuring overall glass dissolution in water owing to its almost complete leachability and absence from any secondary phases [1, 2, 3] although its slight retention in the alteration layer has been directly probed [4, 5]. 11B MAS NMR can also be used to compare the [3]B/[4]B ratio before and after leaching experiments to investigate whether there is preferential dissolution occurring from these glasses. This in turn would indicate whether the poorer aqueous durability of Mg-containing glasses is due to a change in B speciation. On the other hand, whether B speciation and other structural changes would fundamentally affect the aqueous durability of these glasses could be readily addressed by measuring the initial dissolution rate (r0) before secondary effects, such as solution saturation and altered layer formation, start to influence the dissolution process. Comparison of r0 with Ca/Mg ratio will help to discriminate the relative importance of structural and secondary effects on glass dissolution.
2. Materials and Methods
2.1. Glass preparation
The simplified glass was made according to the composition of the full-component MW25 glass (listed in Table S1). In order for the composition to represent the full-component glass
as closely as possible, the molar ratios of Si, B, Na, Al and Mg were fixed at the same ratios as in the full-component glass. Meanwhile, the REE (rare-earth element) load was represented by La on a charge for charge basis except cerium which was attributed its fully oxidised charge of (4+). Paramagnetic transition metals such as Fe and Ni were omitted to facilitate examination of the glass structure with NMR spectroscopy. The nominal composition is listed in Table 1. Mg was then successively substituted by Ca, on an atom-for-atom basis, to produce 0, 25, 50, 75 and 100 mol% Ca-substituted simplified glasses. The glasses are denoted as MgEM, Mg75Ca25, Mg50Ca50, Mg25Ca75 and CaEM respectively. The final glass-making process consisted of a controlled heating (10 /min) of weighed amounts of the precursors (SiO2, Na2B4O7, Al2O3, Na2CO3, MgO/CaCO3, La2O3) in a platinum90/rhodium10 crucible to 1500 . The melt was poured onto a steel block and allowed to cool to room temperature (RT). The glass was then broken up and re-melted using the same ramp rate to reach 1500 °C. The second melt was poured onto a heated steel block at 250 °C then left cooled to RT. Finally, the glass was annealed at 550 °C for two hours and subsequently cooled slowly in the furnace over a period of 16 hours. The compositions of these simplified glasses were analysed (Table 1) by a combination of acid digestion/solution ICP-MS and solid source LA-ICP-MS ((Laser Ablation) Inductively Coupled Plasma Mass Spectrometry) and EPMA (Electron probe microanalysis) techniques (Table S2 shows the original data presented in oxide wt%).
2.2. Leaching experiments
The glasses made as outlined in 2.1 were crushed and ground and then sieved to a size range between 75 m and 150 m. After the sieving procedure, the glass particles were washed in a controlled manner with Type I water and absolute ethanol according to the PCT-B (Product
Consistency Test Type B) protocol [6] in order to remove any adhering fines and contaminants. The theoretical median diameter of 112.5 μm was then used for determining the specific surface area (SA) of each glass sample.
For the initial dissolution rate experiments, a sample of each glass composition ranging from 0.05 to 0.1 g was leached in a sealed PFA (Perfluoroalkoxy alkane) vessel in 100 mL 18.2 MΩ deionised water at 90 1 °C and the whole system was agitated with a magnetic stirrer. This setup results in the SA/V (surface area to volume) ratios being no greater than 22 m-1 to ensure that the initial dissolution rate (r0) was measured in very dilute conditions i.e., the forward hydrolysis reactions are not hindered and the formation of effective barrier layers is precluded [7]. This should be the maximum dissolution rate of the glass for these (temperature, DI) conditions.
The values of r0 can be determined from the change in normalised release of Si (NLSi) within the first 7.2 hours of leaching, with the application of the shrinking core model [3] to correct for the change in SA/V ratio over time as dissolution proceeds, as follows:
AG (t) = AG (t-1) + 10-6 (1)
ET (t) = 103 (2)
r0 = = (3)
(AG – altered glass fraction; Ci– concentration of element i in leachate (mg/L); V – solution volume (mL); m0 – initial mass of glass sample (g); Xi– mass fraction of element i in glass; ET – equivalent thickness of dissolved glass (nm); SA – initial specific surface area (geometric in m2/g); – glass density (g/cm3); r0 – initial dissolution rate (g/m2/d); NLi – normalised release of element i (g/m2); t – time interval (d)). The rationale of using Si
concentration rather than that of Na is to bypass the initial ion-exchange stage and reflect the direct dissolution of the glass network.
For long-term 112-day leaching experiments, a glass sample of each composition (only 11B NMR data of 112-day leached MgEM and MW25 is presented in this paper) of 0.22-0.23 g was leached in a PTFE linear, which was sealed inside a stainless steel vessel, in 4.0 mL 18.2 MΩ deionised water at 90 1 °C. The resulting SA/V ratio for the experiments from this setup is accordingly 1200 m-1 across all compositions.
2.3.Solid-state NMR characterisation
11B, 27Al and 23Na are all non-zero spin nuclei and therefore their local environments can be detected by solid-state NMR techniques even without long-range atomic order. As presented in this paper, apart from 25Mg, their spectra were all obtained by single-pulse excitation. 11B MAS NMR spectra were collected on a Varian InfinityPlus 11.7 T spectrometer operating at 160.34 MHz for 11B using a 3.2 mm magic-angle spinning (MAS) probe. Samples of the unleached glass particles (size fraction 75-150 μm) were packed into 3.2 mm zirconia rotors and spun at 20 kHz. A short pulse of 0.6 and a recycle delay of 5 s were used to acquire the spectra. 27Al MAS NMR spectra were collected on the same instrument but using a 2.5 mm probe. Fine (< 75 μm) unleached glass particles were used and spun at 15 kHz. A pulse and a recycle delay of 0.3 s were applied with 8192 repetitions. 23Na MAS NMR spectra were collected on a Varian Infinity 400 MHz spectrometer using a 4 mm probe. The fines were packed into 4 mm rotors and spun at 12 kHz. A pulse length of 0.75 s ( ) and a recycle delay of 1.0 s were applied with 1024 repetitions. The above mentioned pulse lengths (at a given RF power) and recycle delay times were carefully adjusted to achieve selective
excitation of central transition and acquire quantitative spectra. The spectra presented in this paper are referenced to BF3 OEt2 in CDCl3 (via a secondary reference of -42 ppm for 11B in NaBH4) and 23Na in 1M NaNO3, 27Al in 1M Al(NO3)3 and 25Mg in 1M MgCl2 as 0 ppm, respectively.
25Mg shows very low NMR sensitivity due to its low natural abundance (10.0%), low resonance frequency (30.6 MHz at 11.7 T) and large quadrupole moment (199.4 mbarn). In addition, only 6.5 mol% of the total cations in the glass is Mg. To alleviate these difficulties, 25Mg spectra were obtained with a DFS (double-frequency sweep) assisted rotor-synchronised spin-echo pulse sequence on the UK 850 MHz solid-state NMR facility at the University of Warwick. DFS was applied to increase the spin population difference between and - energy levels. Glass particles of MW25 (75-150 μm) and MgEM (<75 μm) were packed in 4 mm zirconia rotors and spun at 14 kHz. Spin-echo and pulses of 2.33 and 4.66 μs were applied and the recycle delays were 0.1 and 1.5 s, respectively, as the MgEM glass, unlike MW25, did not contain paramagnetic cations that enhance spin-lattice relaxation.
DMFIT software [8] was used to fit the experimental 11B and 27Al NMR spectra to determine the relative proportion of different species in the glass samples.
3. Results
3.1.Glass density
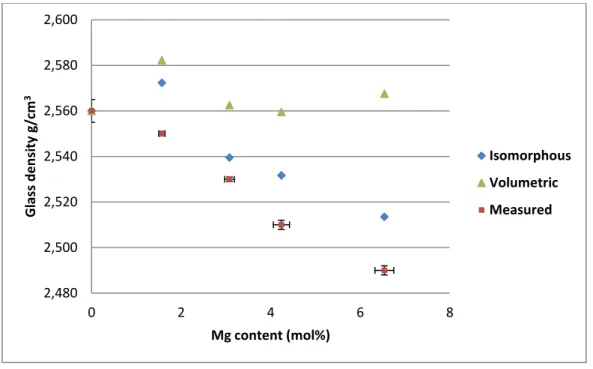
Density was determined for each simplified glass by an Archimedes principle measurement using room temperature DI as the immersion liquid. The density variation with composition is shown in Table 2. It decreases monotonically from 2.56 g/cm3 for CaEM to 2.49 g/cm3 for MgEM. The squared data points plotted in Figure 1 show that there is a clear systematic
decrease in density as Ca is substituted for Mg on a molar basis. The solid (black) and dashed (red) lines represent possible substitution models (see Section 4.1 for further details).
3.2.Glass local structures 3.2.1. Boron
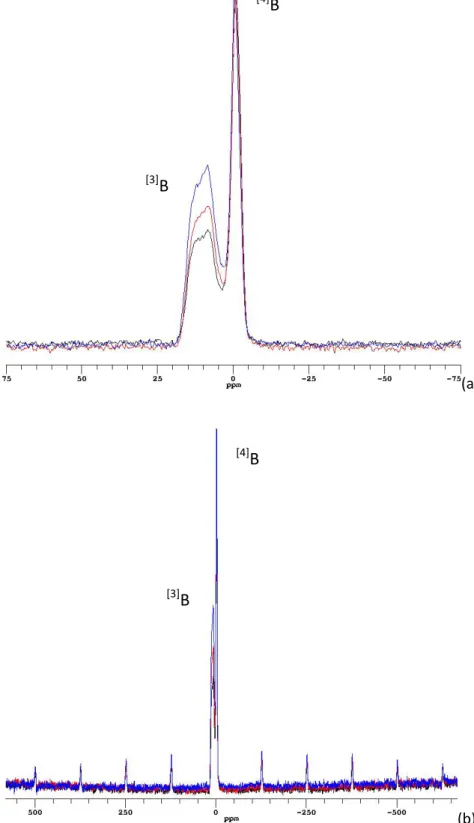
A stack plot of 11B MAS NMR central transition spectra of three of the simplified glasses is shown in Figure 2 (a). Each spectrum consists of a narrow Gaussian peak centred at around 0 ppm which is attributed to B in four-fold coordination and a broadened quadrupole doublet centred at around 10 ppm which is attributed to B in three-fold coordination [9]. The broader [3]B peaks arise from the asymmetric trigonal configuration of BO3 units, which have larger electric field gradients (EFGs) compared with more symmetric BO4 units with tetrahedral configuration. Each [3]B peak is made up of contributions from ring and non-ring BO3 units, both of which contain a distribution of isotropic chemical shifts ( iso) as well as EFGs. The spectra are shown normalised to [4]B intensities in order to compare the [3]B intensities. The relative intensity of the [3]B peak which is directly proportional to the [3]B fraction of total B in the glass, increases as more Mg is present. The intermediate glasses Mg75Ca25 and Mg25 Ca75 are consistent with this trend, but are omitted from the figure for clarity.
As shown, the central transition peaks of [3]B and [4]B signals are slightly overlapped. Additionally, due to the small EFG associated with [4]B units, the first-order satellite transition sidebands are present in the full spectrum as shown in Figure 2 (b). Quantification of either speciation therefore needs to take into account these two factors. It was achieved by curve fitting using DMFIT software by incorporating a quadrupole first-order spinning sideband manifold. One example of a fitting diagram is demonstrated in Figure S2 for MgEM glass. Table 3 shows the full fitting results reported as the relative percentage of B in three- and
four-fold coordination. Excess [3]B is the excess cation mole percentage of [3]B above that found in the CaEM glass.
Figure 3 illustrates the 11B MAS NMR spectra of unleached and 112-day leached MgEM as well as MW25 glasses. Drawn on an absolute scale adjusted for mass and number of scans in Figure 3 (a), it is observable that the total spectral intensity drops for both B speciations after leaching, which highlights the fact that B was indeed lost from the glass. On the other hand, the spectra in Figure 3 (b) and (c) have been normalised to make the [4]B intensities equal. The spectra of the glasses are identical before and after leaching for both simplified and full-component glasses. The much broader and poorly resolved lines of MW25 spectra are due to the presence of paramagnetic elements in the glass and the spinning sidebands are denoted by asterisks as usual.
3.2.2. Sodium
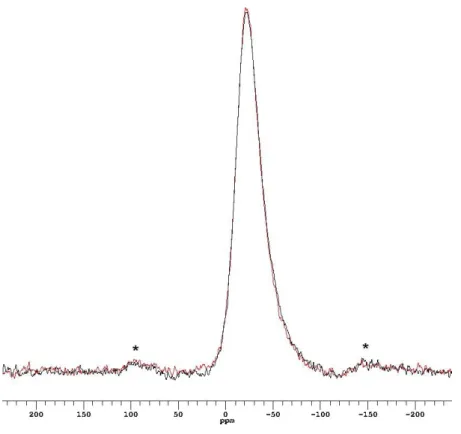
Figure 4 shows the overlaid plot of 23Na MAS NMR spectra of CaEM and MgEM glasses. The centre peaks are coincident and centred at around -20 ppm while δiso lies between 10~20 ppm (asterisks denote the spinning sidebands). A distribution of both isotropic chemical shifts and quadrupole interaction parameters contributes to the total linewidth, as expected in glass structures. The spectra of intermediate compositions are identical to the two endmembers shown here, but have been omitted for clarity. Despite the distributions, the identical peak position, linewidth and lineshape clearly suggest that local environments around Na are unchanged within the Ca/Mg compositional series of simplified glasses.
27Al MAS spectra of Mg50Ca50 and the two endmember glasses are shown in Figure 5. These consist of a predominant, well-defined four-coordinated ([4]Al) and much smaller six-coordinated ([6]Al) peaks. The presence of five-coordinated Al ([5]Al) is not obvious but also limited by the resolution at the magnetic field used (11.7 T). The spectra are presented with [4]Al peaks normalised to compare the minor changes in concentration of the higher coordinated [6]Al. The predominant Al speciation is [4]Al with in the range of 60~70 ppm and a tiny fraction of [6]Al with of around 5 ppm. The resonance position of [5]Al, if there is any, should lie between these two values. There is some evidence of a small coordination change for Al as Mg is added as shown in the inset of
with the relative fraction of [6]Al in these three glasses is CaEM > MgEM > Mg50Ca50 and the difference between MgEM and Mg50Ca50 being almost negligible. Since the two peaks are not completely resolved with slight overlapping at the low frequency side of the [4]Al peaks, the exact relative fractions of [4]Al and [6]Al in Mg50Ca50 and two endmembers were obtained by curve fitting using a model in DMFIT program that account for the distribution in δiso and EFGs (CzSimple). The results are summarized in Table 4. The amount of [6]Al reduces from 4.8 % of total Al or 0.2 % of total cations in the CaEM glass to 1.6 % and 0.7 % or 0.08 % and 0.03 %, respectively. An example of the fit for CaEM glass is shown in Figure 6 (see discussion) and the total fitting results are listed in Table S3.
In addition, for all three compositions, Ca/Mg substitutions almost do not cause shift in either resonance position.
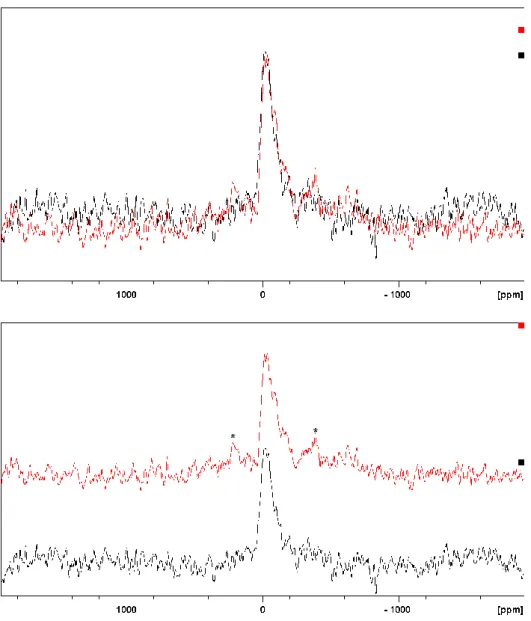
The similarity of the Mg local environment in both simplified and full-component glasses is confirmed by the spectra shown in Figure 7 (a): within the signal-to-noise (S/N) level obtained, the overlaid 25Mg MAS NMR spectra of full-component MW25 glass and its counterpart simulant MgEM glass assure a good representation of MW25 by the simplified glass from a Mg perspective. The δiso is almost the same for both glasses, at around 45~50 ppm indicating a similar coordination. In addition, the lineshape of both centre peaks, i.e., a sharp edge at the high frequency edge and tails towards the low frequency end, is characteristic of a distribution in quadrupolar interaction parameters (EFG and η) with similar δiso values [10, 11]. Spinning sidebands are just observable in the MgEM glass spectrum while not being observed for the MW25 glass (Figure 7 (b)).
3.3.Initial dissolution rates
As shown in Figure 3 there is no selective leaching of B associated with its coordination. However, it is not clear whether the ratio of [3]B/[4]B would affect the dissolution rate. To probe the effects of primary glass structure on its solubility, the initial dissolution rate (i.e. before any significant altered product has been formed on the glass surface) has been measured for all five glasses via short duration leaching experiments with a very low SA/V ratio (less than 22 m-1).
The full results for all five simplified glasses are illustrated in Figure 8: linear fits of the ET (effective thickness of glass dissolved) evolution with time yield the dissolution rates (see equation (3)). The dissolution rates based on Si concentration in the leachate all lie between 2.22~2.60 g/m2/d with no clear dependence on composition. The uncertainty of r0 values measured in this way is at the level of 10% calculated by the uncertainty propagation methods as presented by Gin et.al [12] so they are effectively the same within error. However, more
recent work by Fournier et al [13] suggested that the actual uncertainties are expected to be greater by taking additional uncertainties associated with the estimated glass surface area into account. This was demonstrated to be as high as 25% depending on the exact experimental conditions deployed. The complete initial dissolution data is listed in Table 5.
4. Discussion
4.1.Glass density and boron speciation
As a macroscopic property, density variations can reflect compositional and/or structural changes in glasses. Despite the lower atomic mass of Mg compared with Ca, predicting the effect of molar substitution of Ca for Mg on glass density is not trivial. Since the glass density deceases from CaEM to MgEM monotonically, a simple isomorphous model could be expected: one Ca in the glass is substituted by one Mg without causing any structural change, which would result in a density reduction due to the lower atomic mass of Mg (24.305 g/mol) compared to Ca (40.078 g/mol). On the other hand, because the substitution is on a molar basis and glasses are made from oxide precursors, another model based on the relative molar volume of both oxides (CaO and MgO) should also be considered. In this case, MgO has a lower molar volume of 11.196 cm3/mol than that of CaO (16.790 cm3/mol) [14]. Overall, the density reduction would be moderated depending on relative change of mass and volume associated with the Ca/Mg substitution in the volumetric model. The prediction of glass density variations based on these two very simple models and the measured densities are depicted in Figure 1. Neither of the models fully describes the decrease in glass density with Mg content, particularly for Mg75Ca25 and MgEM, which suggests that local structural changes that reduce the density, such as coordination change are taking place.
From the 11B NMR data, the observed local structural change associated with B coordination converting from four to three will influence the macroscopic density. One of the effects of converting the tetrahedral B to trigonal is a reduction in packing efficiency; trigonal B tends to form open ring-like structures i.e. boroxol rings [9]. This will reduce the glass density. As the measured density decreases more rapidly with increasing Mg content than the simple models predict, the results are consistent with the fundamental structural change observed in B coordination.
4.2.Glass local structures
The main purpose of making simplified glasses is to use them as surrogates for studying the full-component glasses without losing the key structural and compositional features. In comparison to other benchmark nuclear waste glasses such as SON68 and the ISG (International Simple Glass [15]), the presence of Mg in Magnox glass is a major compositional difference and is suspected to reduce the glass aqueous durability. A fundamental requirement for studying the effect of Mg on dissolution mechanisms with a simplified glass is to ensure a similar Mg chemical environment to that in the full-component MW25 glass. Due to the difficulties associated with solid-state 25Mg NMR spectra in general and low concentration of Mg in the MgEM glass (see Materials and Methods and Table 1), obtaining spectra of sufficient quality is very challenging. Indeed, as can be seen from Figure 7, even acquisitions carried out using a 20.0 T magnet (850 MHz 1H) at 52.3 MHz, yield spectra that are still quite noisy after a large number of scans. In addition, spectra with sufficient S/N and resolution to distinguish between Mg environments in different simplified glasses could not be obtained (the experimental setup and length of acquisition were limited by the access time to the UK 850 MHz facility). Nevertheless, the broadly similar 25Mg spectra of MgEM and MW25 indicate that the simplified glass provides a good representation of the Mg local
environment in the full-component glass. This indicates that local structural effects, which contribute to the average values and distributions of EFGs and δiso at the Mg site due to distributions of bond lengths and angles, are reasonably similar. This marks a good starting point for investigating the dissolution mechanisms of full-component glass. The δiso is about 45~55 ppm in both cases (see Figure 7), which is in the four-fold coordination regime as demonstrated in other studies on well-defined Mg containing crystalline silicates and glasses [10, 11, 16]. This suggests, at least, that some of the Mg acts as a network former in MgEM and MW25 glasses. On the other hand, some Mg may exist in higher coordination acting as a charge compensator. However, higher sensitivity and higher resolution spectra need to be obtained either at higher magnetic field or applying MQMAS (multiple-quantum MAS) pulse sequences to make the statement more convincing. Another point worth noting is the presence of spinning sidebands for the Mg site in MgEM and not in MW25, either this indicates that the average EFGs are greater at Mg sites due to higher distortion in MgEM glass than in MW25 glass or the paramagnetics in MW25 are preventing the observation of spinning sidebands. The latter explanation is more likely because the central lineshapes (as observed) appear similar, if there was a significant difference in the average EFGs then this would be apparent from the central lineshapes.
The local bonding requirements of Mg will also influence the local structure of other network-forming elements. As illustrated in Figure 2, the ratio of [3]B/[4]B increases as the Mg content of the glass increases. This monotonic increase in [3]B is consistent with other studies on aluminoborosilicate glasses [17, 18], in which B coordination is shown to be affected by the field strength of network modifiers (field strength is defined as the formal charge of a cation, Z, over the square of the average M-O distance, d, in its first coordination shell i.e. [19]): [4]B fraction decreases as the field strength of the added modifier increases. In this case, Mg
has a higher field strength value than Ca because the ionic radius of Mg is smaller than Ca (e.g. 86.0 pm compared to 114.0 pm in six-fold coordination [21]).
For singly charged Na ions, one [4]B needs to be charge compensated by one Na+ to achieve local charge neutrality. Such a charge compensator must be released into other structural roles, primarily as a network modifier which is linked to non-bridging oxygen (NBO), once a [4]B converts to [3]B. Both Xue and Stebbins [22] and Bunker et al. [23] have demonstrated that such a structural role change would be reflected in a noticeable shift in the 23Na MAS NMR spectrum even for peaks profoundly broadened due to local structural distributions in glasses. In contrast, no such local structural changes are evident from the 23Na spectra of CaEM and MgEM glass, as shown in Figure 4 (or in intermediate compositions). In other words, Na ions are not the sole charge compensators for [4]B speciation; both Ca ions in CaEM glass and Mg in MgEM glass contribute to charge compensating for [4]B.
Despite relatively high uncertainties exist due to compositional variation and instrument error, the linear fit in Figure 9 of excess [3]B to Mg content gives a gradient of approximately 0.8. If all Ca is charge compensating [4]B and Mg was replacing Ca but not replacing its charge balancing role at all, we would expect this gradient to be 2.0 i.e. one mole of [4]B is converted to [3]B per unit of charge. Unfortunately, the exact amount of Ca that is charge balancing [4]B is unknown since there is a surfeit of charge compensating cations for the overall charge deficit (see Table 6 column 1). Nevertheless, this suggests a poorer charge balancing capability of Mg compared with Ca, which is consistent with the presence of four-coordinated Mg inferred from the 25Mg NMR chemical shift measured in MgEM and MW25.
Samples of MgEM and MW25 leached for 112-days were examined to investigate whether the excess [3]B was responsible for the reported greater dissolution of Mg glasses compared with Ca glasses [2]. The 11B spectra of unleached and leached glasses (as shown in Figure 3)
show that the relative proportion of [3]B and [4]B remains the same after the leaching experiments. This behaviour is consistent between the simplified glass and full-component simulant MW25 glass despite the B coordination of the latter not being well resolved. This result illustrates that coordination does not affect the leachability of B and further confirms that B release is a good proxy for evaluating the dissolution of UK MW25 radioactive waste glasses.
In inorganic Al-O environments, tetrahedral and octahedral sites of Al can be well resolved by MAS NMR (e.g., at 11.7 T) owing to the noticeable difference in δiso as an indicator of coordination. Typically, the former locates at about 50~80 ppm and the latter at about -10~15 ppm while that of pentahedral sites are found to be between these two situations typically in the range of 30~40 ppm as found in well-defined crystalline compounds [9]. Using the fitted CaEM 27Al spectrum as an example (Figure 6), as discussed by Lacaillerie et al [24], the fact that the tentatively assigned [4]Al peak can be fitted reasonably well with only one CzSimple lineshape suggests that five-coordinated Al must either be absent in the glasses or be in very low concentrations. In fact, a slight mismatch at the high frequency end of the prominent peak might imply the existence of [5]Al species. However, curve fitting using two separate CzSimple lineshapes for the predominant peak does not improve the fit. In order to resolve a small fraction of [5]Al sites, a significantly higher magnetic field would be required. It has been reported elsewhere that, when higher field-strength modifiers are added to aluminoborosilicate glasses, a higher proportion of five-/six-coordinated Al would be present from the conversion of [4]Al [17, 18, 20]. The results we obtained here show a reversed trend: CaEM glass contains a higher fraction of [6]Al compared with that in MgEM glass. However, it should be kept in mind that Al constitutes less than 5% of the total cations and the vast majority are in tetrahedral sites. Based on the analysed compositions, the fitting results (see Table 4) yield that the [6]Al in CaEM glass constitutes about 4.8% of Al compared with 1.6%
in MgEM glass, these account for only 0.23% and 0.08% of the total amount of cations, respectively. Such a subtle change can easily be attributed to other factors like compositional uncertainties and thermal history. The dependence of Al coordination on Tg is complex especially when compositional effects are involved at the same time [17]. The subtle changes in Al coordination observed here and its low concentration means that it does not contribute significantly to the charge compensation scheme of network formers when compared to effects observed in the 11B MAS NMR spectra.
Table 6 lists the network formers that need to be charge compensated ([4]B and [4]Al ) and the available charge compensators/network modifiers (Na+, Ca2+ and La3+). The network forming role of Mg in the simplified MgEM and full-component MW25 glass is important in determining the local structure of the glass because Mg in four-fold coordination ([4]Mg) should be charge compensated due to its positive charge deficit. However, as mentioned above, despite the observation that Mg in the MgEM glass is primarily in four-fold coordination, the exact ratio of [4]Mg to higher-coordinated Mg is unknown.
The similar composition and density of the simplified glasses suggest a similar degree of network connectivity. It has been noted that an excess of network formers with positive charge deficits could be compensated by REEs acting as charge compensators [25]. Therefore, La3+ ions are able to charge compensate in glasses when there is a lack of charge provided by usual charge compensators such as Na+ and Ca2+. On the other hand, when not acting as charge compensators, REEs in aluminosilicate and aluminoborosilicate glasses normally have a coordination number of around 6-8 [25, 26] and they have been assumed to be charge compensated by cations such as Na+ and Ca2+ through sharing of NBOs with the latter due to over-coordination [27, 28]. As Table 6 indicates, Lain the CaEM glass needs to be charge compensated due to a surfeit in available charge, this leads to an excessive charge of 3.8 moles per 100 moles cations. If all Mg is acting as network former in four-fold coordination,
MgEM would end up with a charge deficit of 4.5 moles per 100 moles cations even with all La3+ ions being charge compensator. Since excessive positive charge lowers glass network connectivity by creating NBOs, on balance, the contrast in charge balancing schemes between CaEM and MgEM suggests that part of Mg is charge compensating, which is in agreement with the role of Mg in partly converting [4]B to [3]B.
4.3.Initial dissolution rate
Iwalewa et al [29] measured the initial dissolution rate of full-component simulant MW25 glass in deionised water at 90 °C in SPFT (Single-Pass Flow-Through) mode and found it to be 1.84 0.35 g/m2/d. This agrees within measurement uncertainty to that measured on the MgEM simplified glass (see Table 5), which again suggests a good representation of the simplified glass for the full-component complex glass. As we discovered in this study, the initial dissolution rates (see Figure 8) as a function of Mg content in these glasses are the same within error. This is in contrast to the data reported in literature for experiments conducted at much longer time scales (up to 12.2 years) [2], where it was found that the long-term dissolution rates, which are generally 3-4 orders of magnitude lower than the initial dissolution rates in these glasses, differ by about one order of magnitude between a Magnox glass (similar in composition to MW25) and SON68. Despite other compositional differences between these two complex glasses, the primary difference is that Magnox glass contains Mg and no Ca and Mg is absent from SON68, which contains Ca in more or less the same proportion as MW25 contains Mg.
The residual glass dissolution rates in the long-term situation are generally believed to be due to a combination of kinetic and thermodynamic effects where transport is hindered by the presence of an altered layer of reconstructed and re-precipitated material on the glass surface, and thermodynamic driving force for dissolution is inhibited by solution chemistry (Si
saturation) [7, 15]. In experiments where fresh glass was put into Si saturated leachate i.e. altered layer barrier removed in saturated condition, a similar dissolution rate was observed as with fresh glass in fresh (unsaturated) water [30]. This suggests that the mechanism of glass dissolution is similar in the long-term and in the initial phase. The dissolution rate differences associated with the presence or absence of Mg are determined primarily by secondary effects related to the effectiveness of the alteration layer in hindering transport to the pristine glass surface. Any fundamental change in the pristine glass, such as B coordination, induced by the presence of Mg appears to have no effect on the solubility of the glass.
5. Conclusion
A key question for this study was to identify the structural changes arising from the substitution of Ca for Mg in simplified UK radioactive waste glasses and determine whether this is the reason for dissolution differences observed previously for full-component radioactive waste glasses [1, 2]. We conclude that the primary effect of substituting Mg is to produce a glass of lower density with more three-coordinated B. This change is not the result of competition for Na, the dominant charge balancing cation, but the result of the poorer charge balancing capability of Mg. Some Mg is in four-fold (network-forming) coordination, but the amount of [4]B to [3]B conversion and overall charge balancing scheme is consistent with Mg also being present in higher (five-/six-fold) coordination. These compositional and structural changes do not impose a noticeable change on the primary (initial) dissolution rate of the glass. Therefore, the significantly different long-term dissolution rates between Mg and Ca based radioactive waste glasses, based on this separate effects study, should be attributed to secondary effects related to the efficacy of surface layers in retarding dissolution.
R. Guo acknowledges the EPSRC and the University of Cambridge for an International Doctoral Scholarship. A portion of this work was funded by Radioactive Waste Management Limited (C.T. Brigden, S.W. Swanton and I. Farnan). The UK 850 MHz solid-state NMR Facility used in this research was funded by EPSRC and BBSRC (contract reference PR140003), as well as the University of Warwick including via part funding through Birmingham Science City Advanced Materials Projects 1 and 2 supported by Advantage West Midlands (AWM) and the European Regional Development Fund (ERDF). Collaborative assistance from the 850 MHz Facility Manager (Dinu Iuga, University of Warwick) is acknowledged. We also appreciate the insightful comments from the diligent reviewers on the original manuscript. Their effort helped make this work more complete.
References
[1] P. K. Abraitis et al. Appl. Geochem. 15 (2000) 1399-1416. [2] E. Curti et al. Appl. Geochem. 21 (2006) 1152-1168.
[3] C. Jégou, S. Gin, F. Larché J. Nucl. Mater. 280 (2000) 216-229. [4 Geochim. Cosmochim. Acta 202 (2017) 57-76. [5] S. Gin et al. Nat. Commun. 6 (2015) 6360.
[6] ASTM C1285-14. ASTM International, West Conshohocken, PA, 2014. [7] S. Gin et al. Geochimica et Cosmochimica Acta 151 (2015) 68–85. [8] D. Massiot et al. Magn. Reson. Chem. 40 (2002) 70-76.
[9] K. J. D. Mackenzie, M. E. Smith, Multinuclear Solid-State NMR of Inorganic Materials, Pergamon, Oxford, 2002.
[10] K. Shimoda, T. Nemoto, K. Saito J. Phys. Chem. B 112 (2008) 6747–6752. [11] K. Shimoda et al. American Mineralogist 92 (2007) 695-698.
[13] M. Fournier et al. J. Nucl. Mater. 476 (2016) 140-154.
[14] J. R. Rumble, ed. CRC Handbook of Chemistry and Physics, 98th Edition (Internet Version 2018), CRC Press/Taylor & Francis, Boca Raton, FL.
[15] S. Gin et al. Mater. Today 16 (2013) 243-248.
[16] K.J.D. MacKenzie, R. H. Meinhold American Mineralogist 79 (1994) 250-260. [17] E. I. Morin, J. Wu, J. F. Stebbins Appl. Phys. A 116 (2014) 479–490.
[18] J. Wu and J. F. Stebbins J. Non. Cryst. Solids 335 (2009) 556-562.
[19] R. D. Shannon and C. T. Prewitt Acta Crystallographica B25(1969) 925-946. [20] J. Wu and J. F. Stebbins J. Non. Cryst. Solids 362 (2013) 73-81.
[21] R. D. Shannon Acta Crystallographica A32 (1976) 751-767.
[22] X. Xue and J. F. Stebbins Phys. Chem. Minerals 20 (1993) 297-307. [23] B. C. Bunker et al. Phys. Chem. Glasses 31 (1990) 30-41.
[24] J. B. Lacaillerie et al. J. Magn. Reson. 192 (2008) 244-251.
[25] G.Cormier, J.A.Capobianco and A.Monteil J. Non. Cryst. Solids 152 (1993) 225-236. [26] T. Schaller and J.F. Stebbins J. Phys. Chem. B 102 (1998) 10690–10697.
[27] F. Angeli et al. J. Non. Cryst. Solids 376 (2013) 189–198. [28] E. Molières et al. J. Lumin. 145 (2014) 213-218.
[29] T. M. Iwalewa et al. Appl. Geochem. 82 (2017) 177-190. [30] E. Vernaz et al. J. Nucl. Mater. 298 (2001) 27-36.
Figures
Figure 1 The measured glass densities as a function of Mg content and predicted densities based on: (i) an isomorphous substitution of Ca for Mg according to the molar mass of CaO and MgO; and (ii) a volumetric
substitution which also takes the molar volumes of CaO and MgO into account; see Section 4.1 for details
2,480 2,500 2,520 2,540 2,560 2,580 2,600 0 2 4 6 8 Gl ass d e n si ty g/c m 3 Mg content (mol%) Isomorphous Volumetric Measured
(a)
(b)
Figure 2 11B MAS NMR spectra of the simplified glasses CaEM (black), Mg50Ca50 (red) and MgEM (blue) obtained at 160.34 MHz. (a) The central transition lineshape of [4]B and [3]B peaks; (b) The full spectra that manifest the
sidebands of 11B satellite transitions. The intensities of the [4]B peaks are normalised for comparison of the relative proportion of trigonal [3]B [3] B [4]B [3]B [4] B
Figure 3 11B MAS NMR spectra of MgEM glass before (red) and after (black) a 112-day leaching experiments, (a) on an absolute scale and (b) normalised to make the [4]B peak intensities equal, obtained with the same experiment setup
as in Figure 2; (c) 11B MAS NMR spectra of MW25 glass before (red) and after (black) a 112-day leaching experiments normalised to make the [4]B intensities equal
(a) (b)
Figure 4 23Na MAS NMR spectra of simplified CaEM (red) and MgEM (black) glasses obtained at 105.82 MHz with 8192 π/18 pulse and 1.0 s pulse delay. Spinning speed was 12 kHz in both cases and the spinning sidebands are
Figure 5 27Al MAS NMR spectra of simplified CaEM (black), Mg50Ca50 (blue) and MgEM (red) glasses obtained at 130.22 MHz with 8192 π/18 solid pulse and 0.3 s pulse delay. The four-coordinated Al peaks are normalised for comparison of the relative proportion of six-coordinated Al. Spinning speed is 15 kHz in all cases and the spinning
Figure 6 Curve fitting of the CaEM 27Al MAS NMR spectrum with 2 CzSimple lines: [4]Al in green and [6]Al in purple. The blue line represents the experimental spectrum while the superimposed overall fit is displayed in red
Figure 7 (a) Overlaid 25Mg MAS NMR spectra of unleached MW25 (black) and MgEM (red) glasses obtained at 52.05 MHz with 54200 π/18 pulse and 0.1 s pulse delay and 102400 π/18 pulses and 1.5 s pulse delay, respectively. The spinning speed is the same at 14 kHz. Spectra are referenced to 1M MgCl2 solution as 0 ppm; (b) The same spectra as
Figure 8 Effective dissolved thickness (ET) of simplified glasses as a function of time in the initial dissolution rate experiments based on Si concentration in the leachate
Figure 9 The linear fit (dashed line) of the amount of boron that transform from four-fold coordination to three-fold coordination on substitution of Mg for Ca per 100 moles of cations (filled square)
0 50 100 150 200 250 300 350 400 0 0,1 0,2 0,3 0,4 ET ( n m) Time (day) Mg25/Ca75 CaEM Mg50/Ca50 Mg75/Ca25 MgEM -1 0 1 2 3 4 5 6 7 0 1 2 3 4 5 6 7 8 Exce ss th re e -c o o rd in ate d B m o l % mol % of Mg
Figure Captions
Figure 1 The measured glass densities as a function of Mg content and predicted densities based on: (i) an isomorphous substitution of Ca for Mg according to the molar mass of CaO and MgO; and (ii) a volumetric substitution which also takes the molar volumes of CaO and MgO into account; see Section 4.1 for details
Figure 2 11B MAS NMR spectra of the simplified glasses CaEM (black), Mg50Ca50 (red) and MgEM (blue) obtained at 160.34 MHz. (a) The central transition lineshape of [4]B and [3]B peaks; (b) The full spectra that manifest the sidebands of 11B satellite transitions. The intensities of the [4]B peaks are normalised for comparison of the relative proportion of trigonal [3]B
Figure 3 11B MAS NMR spectra of MgEM glass before (red) and after (black) a 112-day leaching experiments, (a) on an absolute scale and (b) normalised to make the [4]B peak intensities equal, obtained with the same experiment setup as in Figure 2; (c) 11B MAS NMR spectra of MW25 glass before (red) and after (black) a 112-day leaching experiments normalised to make the [4]B intensities equal
Figure 4 23Na MAS NMR spectra of simplified CaEM (red) and MgEM (black) glasses obtained at 105.82 MHz w h 8192 π/18 pu s d 1 0 s pu s d y p g sp d w s 12 kHz bo h c s s d the spinning sidebands are denoted by asterisks. Spectra are referenced to 1M NaNO3 solution
Figure 5 27Al MAS NMR spectra of simplified CaEM (black), Mg50Ca50 (blue) and MgEM (red) glasses obtained at 130.22 MHz w h 8192 π/18 solid pulse and 0.3 s pulse delay. The four-coordinated Al peaks are normalised for comparison of the relative proportion of six-four-coordinated Al. Spinning speed is 15 kHz in all cases and the spinning sidebands are denoted by asterisks. Spectra are referenced to 1M Al(NO3)3 solution
Figure 6 Curve fitting of the CaEM 27Al MAS NMR spectrum with 2 CzSimple lines: [4]Al in green and [6]Al in purple. The blue line represents the experimental spectrum while the superimposed overall
fit is displayed in red
Figure 7 (a) Overlaid 25Mg MAS NMR spectra of unleached MW25 (black) and MgEM (red) glasses ob d 52 05 MHz w h 54200 π/18 pu s d 0 1 s pu s d y d 102400 π/18 pu s s d 1 5 s pulse delay, respectively. The spinning speed is the same at 14 kHz. Spectra are referenced to 1M MgCl2 solution as 0 ppm; (b) The same spectra as shown in (a) stacked so that the spinning sidebands on MgEM spectrum can be seen (denoted by asterisks)
Figure 8 Effective dissolved thickness (ET) of simplified glasses as a function of time in the initial dissolution rate experiments based on Si concentration in the leachate
Figure 9 The linear fit (dashed line) of the amount of boron that transform from four-fold coordination to three-fold coordination on substitution of Mg for Ca per 100 moles of cations (filled square)
Tables
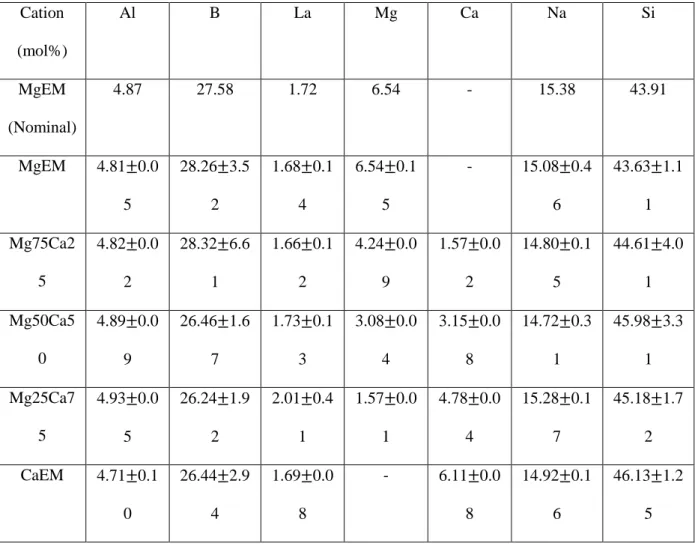
Table 1 Nominal composition of the simplified MW25 glass (MgEM) and analysed compositions of the simplified glass series (cation mol%)
Cation (mol%) Al B La Mg Ca Na Si MgEM (Nominal) 4.87 27.58 1.72 6.54 - 15.38 43.91 MgEM 4.81 0.0 5 28.26 3.5 2 1.68 0.1 4 6.54 0.1 5 - 15.08 0.4 6 43.63 1.1 1 Mg75Ca2 5 4.82 0.0 2 28.32 6.6 1 1.66 0.1 2 4.24 0.0 9 1.57 0.0 2 14.80 0.1 5 44.61 4.0 1 Mg50Ca5 0 4.89 0.0 9 26.46 1.6 7 1.73 0.1 3 3.08 0.0 4 3.15 0.0 8 14.72 0.3 1 45.98 3.3 1 Mg25Ca7 5 4.93 0.0 5 26.24 1.9 2 2.01 0.4 1 1.57 0.0 1 4.78 0.0 4 15.28 0.1 7 45.18 1.7 2 CaEM 4.71 0.1 0 26.44 2.9 4 1.69 0.0 8 - 6.11 0.0 8 14.92 0.1 6 46.13 1.2 5
Table 2 The measured glass density from CaEM to MgEM by Archimedes principle
CaEM Mg25Ca75 Mg50Ca50 Mg75Ca25 MgEM
Density g/cm3
Table 3 [3]B and [4]B proportions in the simplified glass series: ‘fraction’-the proportion of [3]B or [4]B with respect to the total amount of boron; ‘mole’-the molar amount of [3]
B or [4]B with respect to 100 moles of cations in the glass as presented in Erreur ! Source du renvoi introuvable. (analysed composition)
CaEM Mg25Ca75 Mg50Ca50 Mg75Ca25 MgEM
[3]B fraction 48.3% 50.0% 55.0% 57.8% 61.7% [3]B mole 12.8 13.1 14.6 16.4 17.4 [4]B fraction 51.7% 50.0% 45.0% 42.2% 38.3% [4]B mole 13.7 13.1 11.9 11.9 10.8 Excess [3]B mole 0 0.3 1.8 3.6 4.6
Table 4 The fraction of four- and/or five-coordinated aluminium and six-coordinated aluminium of MgEM, Mg50Ca50 and CaEM glasses
[4]Al [6]Al
CaEM 95.2% 4.8%
MgEM 98.4% 1.6%
Table 5 Initial dissolution rate of the simplified glass series as determined from the rate of change in the effective thickness of dissolved glass based on Si concentration
CaEM Mg25Ca75 Mg50Ca50 Mg75Ca25 MgEM
Initial dissolution rate
(g/m2/d)
2.33 0.23 2.60 0.26 2.54 0.25 2.42 0.24 2.22 0.22
Table 6 Total charge balancing scheme for the simplified glass series. Note: [4]Al data is only available for CaEM, MgEM and Mg50Ca50 glasses
Species (mol%) CaEM Mg25Ca75 Mg50Ca50 Mg75Ca25 MgEM
Four-coordinated network former
[4]B 13.7 13.1 11.9 11.9 10.8
[4]Al 4.5 - 4.9 - 4.7
Charge compensator/network modifier
Na+ 14.9 15.3 14.7 14.8 15.1
Ca2+ 6.1 4.8 3.2 1.6 -
La3+ 1.7 2.0 1.7 1.7 1.7
Four-coordinated network former and Charge compensator/network modifier
Mg - 1.6 3.1 4.2 6.5
Excessive positive charges
3.8 - - - “-4.5”*
![Figure 3 11 B MAS NMR spectra of MgEM glass before (red) and after (black) a 112-day leaching experiments, (a) on an absolute scale and (b) normalised to make the [4] B peak intensities equal, obtained with the same experiment setup](https://thumb-eu.123doks.com/thumbv2/123doknet/12934992.374455/26.892.105.785.105.692/figure-leaching-experiments-absolute-normalised-intensities-obtained-experiment.webp)

![Figure 6 Curve fitting of the CaEM 27 Al MAS NMR spectrum with 2 CzSimple lines: [4] Al in green and [6] Al in purple](https://thumb-eu.123doks.com/thumbv2/123doknet/12934992.374455/29.892.137.756.103.393/figure-curve-fitting-caem-spectrum-czsimple-lines-purple.webp)

![Table 3 [3] B and [4] B proportions in the simplified glass series: ‘fraction’-the proportion of [3] B or [4] B with respect to the total amount of boron; ‘mole’-the molar amount of [3] B or [4] B with respect to 100 moles of cations in the glass as](https://thumb-eu.123doks.com/thumbv2/123doknet/12934992.374455/35.892.101.795.211.487/table-proportions-simplified-fraction-proportion-respect-respect-cations.webp)
