HAL Id: hal-01675305
https://hal.sorbonne-universite.fr/hal-01675305
Submitted on 4 Jan 2018
HAL is a multi-disciplinary open access
archive for the deposit and dissemination of
sci-entific research documents, whether they are
pub-lished or not. The documents may come from
teaching and research institutions in France or
abroad, or from public or private research centers.
L’archive ouverte pluridisciplinaire HAL, est
destinée au dépôt et à la diffusion de documents
scientifiques de niveau recherche, publiés ou non,
émanant des établissements d’enseignement et de
recherche français ou étrangers, des laboratoires
publics ou privés.
Sustaining the sequestration efficiency of the European
forest sector
Aude Valade, Valentin Bellassen, Claire Magand, Sebastiaan Luyssaert
To cite this version:
Aude Valade, Valentin Bellassen, Claire Magand, Sebastiaan Luyssaert. Sustaining the sequestration
efficiency of the European forest sector. Forest Ecology and Management, Elsevier, 2017, 405,
pp.44-55. �10.1016/j.foreco.2017.09.009�. �hal-01675305�
Sustaining the sequestration e
fficiency of the European forest sector
Aude Valade
a,⁎, Valentin Bellassen
b, Claire Magand
a, Sebastiaan Luyssaert
caInstitut Pierre Simon Laplace (IPSL), CNRS-UPMC, Paris, France
bCESAER, AgroSup Dijon, INRA, Univ. Bourgogne Franche-Comté, F-21000 Dijon, France cDepartment of Ecological Sciences, VU University Amsterdam, Amsterdam, The Netherlands
A R T I C L E I N F O
Keywords: Forest Wood Sequestration efficiency Climate change Substitution Residues Sensitivity Uncertainty Model Carbon balanceA B S T R A C T
The optimal forest management strategies for mitigating climate change are hotly debated during political ne-gotiations, because afforestation and forest management can increase atmospheric CO2removal, and the wood
produced can provide a substitute for fossil fuel. Studies quantifying the carbon balance of the forest sector apply a wide variety of management and wood-use scenarios. Some model studies include future climate change effects on forest growth, but others ignore them. Here, a conceptual empirical model of sequestration efficiency, the fraction of net primary production stored in the biosphere and anthroposhere, simulates European forest carbon pools andfluxes. The sensitivity of the sequestration efficiency of European forests was quantified by varying model parameters along the forest growth and wood transformation chain: environment and climate change, harvest intensity, rotation length, fraction of harvest residues left on site and substitution efficiency. Irrespective of the evolution of the sink, the forest sector as a whole remains a net carbon absorber in 99% of the simulations at a time horizon of 100 years, even if in 25% of the simulations the forests themselves become sources. However, if the goal is to enhance the current sequestration efficiency to mitigate emissions, only in 25% of the simulations the sink efficiency was found to be enhanced. If the current sink were to reverse to a source, no management action or change in wood use would result in an increase in the current forest sequestration effi-ciency. In all other cases, increasing harvest levels would lead to an increase in forest sector carbon emissions, highlighting the pivotal role of the baseline used to set the emission reduction targets. Our results show that the uncertainty on the response of European forest to climate change undermines the quest for a carbon-optimal management strategy. The uncertainty in whether climate change will maintain the current forest sink or turn it into a carbon source is largely overlooked in the debate over the best forest management strategy to reduce the growth of atmospheric CO2concentration, yet it is large enough to change the merit order of different
alter-natives.
1. Introduction
Expectations of forests and forest management are high, especially in the context of climate change mitigation (UNFCCC, 2015). These expectations are based on the potential of: (a) afforestation, reduction of deforestation emissions and forest management to remove atmo-spheric CO2through photosynthesis, (b) carbon stored in wood
pro-ducts to delay the release of harvested carbon into the atmosphere, and (c) substitution of fossil fuel by wood in energy production or by the replacement of energy-intensive materials. With 64% of the world’s forests being managed (FAO, 2010) and an estimated global forest carbon sink of 2 Pg C yr−1 (Pan et al., 2011), excluding tropical de-forestation (Le Quéré et al., 2009), forests appear to live up to these expectations. As a result, the Paris agreement places forests at the heart of the carbon emissions mitigation initiatives with its articles 4 and 5
respectively stating the need to “reach a balance of anthropogenic emissions and removals in the 2nd half of the century” and to “conserve and enhance the sink” (UNFCCC, 2015).
A large body of research has been published focusing on evaluating and managing the potential of the forest sector to offset CO2emission
from fossil fuel burning. This work shows that increasing wood re-moval, while keeping all other parameters constant, whether realized through shorter rotation length (Kaipainen et al., 2004; Liski et al., 2001) or removal of stumps and slash (Strömgren et al., 2013), would increase the carbon emission of the forest sector in thefirst years fol-lowing the treatment. Where wood products are used in place of more fossil-intensive energy or materials, wood usage leads to a (relative) reduction in carbon emission quantified through so-called substitution or displacement coefficients (Sathre and O’Connor, 2010). Even though the substitution effect was found to have a large impact on the wood-⁎Corresponding author.
E-mail address:[email protected](A. Valade).
products carbon balance (Fortin et al., 2012; Lundmark et al., 2014), the definition and use of substitution coefficients is subject to large uncertainties due to their dependence on methodological choices to define the characteristics of the industries, and the reference scenario (Hellweg and i Canals, 2014). Consequently, increased wood removals were reported either to reduce, at least in the long term (Lundmark et al., 2014; Marland and Schlamadinger, 1997; Perez-Garcia et al., 2007; Vanhala et al., 2013), or not reduce (Fortin et al., 2012; Hudiburg et al., 2011; Kallio et al., 2013; Sievänen et al., 2014) atmospheric CO2
concentration as substitution effects accumulate over time.
Wood removal, product use and energy substitution are all ac-counted for in recent studies on carbon management in the forest sector, however, the uncertainty surrounding the future evolution of the forest sink under climate change—changes in allocation of carbon to the short- and long-lived soil and biomass pools of the forest—and its interaction with management practices have mostly been ignored. It is often implicitly assumed that the forest sink tends towards zero when forest stands grow older than 100 years leading to carbon-neutral forest (Lippke et al., 2011), even though observational evidence does not lean in that direction (Lewis et al., 2009; Luyssaert et al., 2008). Some other studies assume that the current sink strength is maintained indefinitely, either implemented as a single average sink over the study area or, more refined, as a function of age (Hudiburg et al., 2011; Kallio et al., 2013; Lundmark et al., 2014; Pilli et al., 2017; Smyth et al., 2014) .
The recent forest sink has been attributed to changes in environ-mental conditions, with CO2concentration, temperature patterns and
nitrogen deposition all contributing to the observed acceleration in tree growth (Lewis et al., 2009; Magnani et al., 2007; McMahon et al., 2010; Solberg et al., 2009). For the European forests, changes in age structure and management practice (Nabuurs et al., 2003) were also found to play a role. Nevertheless, the importance of the drivers of the current sink likely differs for different regions in Europe (Bellassen et al., 2011). While CO2 fertilization has been projected to overtake nitrogen
de-position as the main driver of the forest carbon sink in the future (Milne and Van Oijen, 2005), these projections are controversial because they disregard physiological constraints (de Boer et al., 2011), overlook the indirect effect of decreased tree longevity (Bugmann and Bigler, 2011) and do not account for the saturation of the CO2effect due to nitrogen
(Hungate et al., 2003; Norby et al., 2010) or phosphorus limitation. Much of the controversy stems from the knowledge gap in how the different components of heterotrophic respiration will respond to cli-mate change (Cox et al., 2000; Cramer et al., 2001; Subke and Bahn, 2010). Also, it is currently suspected that interannual variability and the role of disturbance will become major future players in driving the sink strength of temperate and boreal forest (Anderegg et al., 2013; Beck et al., 2011; Kurz et al., 2008; Lindroth et al., 2009; Zeng et al., 2009). As a result of this inadequate process understanding, an en-semble of state-of-the-art process-based models disagrees on the mag-nitude of the terrestrial carbon sink by 2100, and even on its sign (Friedlingstein et al., 2014). Under the same emission scenarios some models predict the European forest will absorb up to 0.5 Pg C yr−1, while others conclude it will become a source of 0.5 Pg C yr−1 (Friedlingstein et al., 2014). Despite being the most advanced tools to integrate ecological and physical knowledge into a consistent numerical framework, the capability of process-based models is still limited in tackling the aforementioned issues because these models are rarely designed to explicitly simulate forest management, nitrogen dynamics, pest and disease hazards and extreme events all at the same time (Naudts et al., 2015). Regional-scale empirical models, for their part, include all the complexity of management strategies and forest types and structures but are constrained to short time horizons and often limited in their capacity to simulate the effects and feedbacks of climate change on forest growth and dynamics (Pilli et al., 2017).
Although all of the controls listed above have been extensively studied separately in almost two decades of carbon management re-search, it remains difficult to integrate the results of this research into a
consistent framework (Bellassen and Luyssaert, 2014). The problem is that different studies make different assumptions and this hampers the comparison and generalization of the results. In this study, the main uncertainties in European forestry carbon management are analysed with the goal of quantifying their contributions to the overall carbon balance of the sector and of delimiting a“safe operational space” for carbon management. This safe operational space is defined as a com-bination of forest management and wood-use measures that should result in maintaining or increasing the overall forest sector carbon se-questration potential compared to today.
2. Methods
2.1. Carbon sequestration efficiency
The net carbon budget of the forest sector consists of the carbon sequestered in both the forest ecosystems and in wood-use chains either through storage or substitution. In ecosystems, the net carbon input is referred to as net primary production (NPP); here we assume NPP is equal to biomass production and focus on sequestration efficiency, which is defined as the ability of the ecosystem and wood use chain together to retain part of the incoming NPP. In Europe, temperate and boreal forests lose carbon through two major pathways: timber har-vesting, and heterotrophic respiration (Rh) (Luyssaert et al., 2010). The
balance between carbon inputs and outputs is called the net biome production (NBP; (Chapin et al., 2006)). A positive NBP indicates the forest is a sink and thus accumulates carbon in the soil, litter and/or biomass, whereas a negative NBP indicates the ecosystem is a carbon source. Contrary to Rh, the carbon contained in the harvested wood is
not immediately released back into the atmosphere—it can be stored in wood products. If it is stored in wood products, carbon is released at a decay rate that depends on the products’ longevity. Furthermore, if the harvested wood is used to replace a more fossil fuel-intensive material or energy source, the substitution effect may come into play. Sub-stitution may result in avoided emissions, which, for bookkeeping purposes, can be considered as a sink that should be included in the carbon budget of the forest sector. The carbon balance of the forest sector ( CΔ forest sector) can thus be formalized as:
= + +
C NBP HWP S
Δ forest sector t t t (1)
whereNBPt, HWPt,andSt are the carbon input at time t, into the
eco-system, into the wood-product pool, and the avoided emissions through substitution respectively, all expressed in g C m−2 yr−1. Likewise
C
Δ forest sectorcan be written as a function of the overall NPP at time t:
= = + +
(
)
ΔC NPP C NPP SE . Δ . forest sector t NBP NPPHWP S forest sector t t t t t t (2) whereSEtis the unitless sequestration efficiency of the forest sector andis calculated as: = + + SE NBP HWP S NPP t t t t t (3)
As shown in Eq.(2), the carbon balance of the total European forest sector can be calculated as the product of the total forest NPP over Europe and the sequestration efficiency for European forests. The se-questration efficiency of the forest sector represents the share of carbon sequestered in the forest sector per unit of NPP. In other words, if the sequestration efficiency equals 0.23 this implies that for each gram of carbon that has been used for biomass production in the forest eco-system, 0.23 g C will be sequestered in the forest sector and thus did not end up in the atmosphere. This study focuses on quantifying the main drivers of the sequestration efficiency.
The advantage of this approach is that it separates the production, i.e., net primary production, from the efficiency of the production, i.e., sequestration efficiency. Such an approach stresses the fundamentally
different effect of processes such as afforestation, deforestation, die-back, and changes in age-class structure that mainly affect the net primary production and processes such as rotation length, wood-use, substitution, heterotrophic respiration that mainly affect the seques-tration efficiency.
2.2. Carbon balance model
Combining the carbon pools and fluxes of the forest sector in a simple empirical mass balance model enabled us to project the dy-namics of the carbon budget (Fig. S1). FollowingChapin et al. (2011), the annual carbon budget of an ecosystem for year t was written as:
= + + +
NPPt Dt Ht Rh,t NBPt (4)
Showing that NPP is consumed by stand-replacing natural dis-turbances (Dt), appropriated by humans through harvest (Ht), or leaves
the ecosystem through annual total of heterotrophic respiration (Rh,t).
The remaining carbon is sequestered as NBP in the ecosystem: in the soil, the litter, the coarse woody debris and the living biomass (Chapin et al., 2006). The present study does not distinguish between the above-and belowground components of NBP.
At each yearly time step (t), the harvest and disturbancefluxes were first assigned their prescribed values. Total Rhwas then partitioned into
its three main components: respiration from harvest debris decom-position, respiration from root and leaf decomdecom-position, and respiration from free-living microbes (Bowden et al., 1993; Tang et al., 2005). Harvests and disturbances leave woody debris on site, of which a part will remain in the ecosystem as the recalcitrant fraction in the soil, its chemical and/or physical properties hampering decomposition by micro-organisms (De Deyn et al., 2008). The remainder of the debris is readily decomposed through heterotrophic respiration (rdebris). Plant
growth indirectly contributes to heterotrophic respiration through the production and subsequent decomposition of leaf and root litter (Raich and Nadelhoffer, 1989). This respiration component (rroot-leaves) was
assumed to be a constant fraction of NPP. Finally, the remaining part of Rh(renv) accounts for the respiration of the soil microbial community
and depends upon many environmental factors (Tang et al., 2005). This renvcomponent is particularly poorly understood (Jones et al., 2003;
Subke and Bahn, 2010) and is the root cause of the uncertainty in the evolution of the future forest sink as it contains the effects of soil temperature and moisture, nutrient availability and soil microbiology on soil respiration (Mack et al., 2004; Singh et al., 2010). This en-vironment-related fraction of Rhis interpreted as the key driver of the
uncertainty in the evolution of the forest carbon sink (NBP). The NBP was calculated as the carbon remaining after H, D and Rhfluxes had
been evaluated. Changes in sink strength only affect other components of the carbon balance when respiration is too high to be sustained with the prescribed harvest level. In those cases harvest is reduced to a level that satisfies the respiration flux.
In the model, the forest sink is formalized through Eq.(4)and was completed by accounting for the carbon contained in the wood harvest. Disturbances were assumed to be salvage-logged (Lindenmayer and Noss, 2006; McIver et al., 2000). Therefore, both harvest (H) and post-disturbance salvage-logging (D) end-up in one of four wood-product pools each with a different lifetime and substitution potential (Eggers, 2002) (Table 2). The carbon contained in these wood-product pools follows an exponential decay function, where the decay rate depends on the expected lifetime of the pool:
= − −⎛ ⎝ − − ⎞ ⎠ WPt WPt .e t t τ 1 ( 1) (5) where WPtdenotes the carbon contained in the pool at time t, andτis
the expected lifetime of the wood products. Furthermore, emissions avoided through replacement of fossil-fuel-intensive products by wood were calculated for each time step (Table 2) and contributed to the sequestration efficiency given by Eq.(3).
= − − = − S E E Q Q .gHWP s gHWP. t ff w ff w t t (6)
where the Effand Ew refer to the emissions due to the provision of
equivalent services respectively in fossil fuel-based and wood-based production systems, and Qffand Qwrefer to the quantity of wood used
for the provision of equivalent services in a fossil fuel-based and wood-based production system, respectively, gHWPtis the gross number of
units produced from harvest at time t. The term −
− − E E Q Q ff w ff wis the so-called
substitution coefficient, s, reported in the literature for each category of wood product (long-lived, medium-lived, and biofuel wood products). All other parameters being equal, changes in the fraction of residues left on site after harvest or salvage logging affect the amount of wood available for wood products, hence the storage of carbon and the sub-stitution potential. A feedback on tree growth due to fertility losses or gains was not implemented because of a lack of empirical data on this process.
Increasing harvest levels by shortening rotation periods is often justified by an expected increase in biological production resulting from a shift of the age structure toward younger and potentially more pro-ductive forests. Although knowledge gaps persist in the mechanistic understanding of the driving processes, observations across a variety of forests confirms an age-dependency of NPP: stand-level NPP increases in the early stages, reaches a peak and then decreases as forests age (Ryan et al., 1997; Tang et al., 2014). In the model, the total NPP ac-counted for the age-effect by modulating total NPP as a response to harvest rate:
=
NPP α NPPT· (7)
where NPP is the observed average biomass production for European forests, NPP is the average biomass production adjusted for rotation length and αT is the correction factor determined from the age-NPP
relationships and extracted for rotation length T, or age-effect coeffi-cient. If the imposed rotation length was not optimal for forest pro-duction, i.e., harvest before or after the culmination of the annual mean increment, the total NPP was reduced by an age-effect coefficient.
Note that the model design implies that all other parameters being equal, changes in harvest levels affect the amount of residue left on site (parameterized as a fraction of wood removal), of long-lived, medium-lived and short-medium-lived harvested wood products (fixed fractions of the harvested wood for each category), and of substitution potential (di-rectly calculated from wood-product pools).
Furthermore, the model assumes that disturbance-related wood re-movals (D) are uncorrelated to rotation length (T). This assumption is thought to be justified by reports in the literature that the susceptibility of forests to disturbances such as droughts, pests, diseases,fires and storms differ from one disturbance to another and appear to be more strongly driven by the interaction between local climatic and edaphic conditions, tree species, homogeneity of the stand structure, skewness of age distribution, root and canopy architectures, and density of the stands rather than rotation length itself (Jactel et al., 2009; Lévesque et al., 2013; Martin and Ogden, 2006; Mitchell, 2012; Pretzsch et al., 2013; Schütz et al., 2006; Seidl et al., 2011; Valinger and Fridman, 2011).
2.3. Parameterization
Projection of the future carbon balance of the forest sector requires that the mass balance model be parameterized with observations of the partitioning of NPP. This information was compiled from the literature (Table 1). NBP, harvest, disturbances and respiration observations for the EU (including both temperate and boreal forests) were normalized by NPP. Although most of thefluxes have been observed, our approach required decomposing Rhinto Rhgrowth,Rhdebrisand Rhenv, also normalized
by NPP as rroot-leaves, rdebrisand renv, which have not been reported as
heterotrophic respiration from the decomposition of leaf and root litter and estimated as:
= + − r NPP NPP NPP root leaves leaf root total (8)
where the components of NPP allocated to leaf (NPPleaf) and root
(NPProot) were based on a literature compilation [Luyssaert et al.,
2007]. The rdebris component is the heterotrophic respiration from
woody debris left on site following harvest and/or disturbance and can be formalized as:
= ∗ + ∗ −
rdebris flitter (H D) (1 RF) (9)
where flitter, the fraction of wood harvest left on site, was taken from
Penman et al. (2003) and Lippke et al. (2011)and RF, the recalcitrant fraction of such wood residuals, fromTrømborg et al. (2011) and Profft (2009). Finally, as the most uncertain component of Rh, renvwas
esti-mated for the period 2000–2010 such that it closes the mass balance for the observed values when Rhis formalized as the sum of three
com-ponents, rroot-leaves, renvand rdebris:
= − − −
renv Rh rroot leaves rdebris (10)
Parameters for describing and projecting the carbon storage in wood products and carbon substitution through displacement of wood uses are presented inTable 2, along with the references. These parameters
include the fraction of residue left on site after harvest and for each wood-products pool (long-lived timber, medium-lived timber, pulp and energy) its amount in terms of fraction of the total biomass export, i.e., harvested biomass minus the residue, its expected lifetime, and sub-stitution coefficient.
This study includes an age-effect of harvest intensity by building on an ensemble of reported age-NPP relationships for a variety of tempe-rate and boreal forest types (He et al., 2012; Wang et al., 2011). First, each age-NPP relationship was converted into an age-MAI (mean an-nual increment) relationship and normalized by its maximum MAI. For each rotation length (i.e., harvest level) simulated by the model, the ensemble of normalized MAI curves thus provides a statistical dis-tribution of NPP reduction factors,αTin Eq.(7), represented by a mean
and standard deviation (Fig. S2).
Subsequently, the model was used for testing the sensitivity of the sequestration efficiency of the forest sector to the uncertainty in the key processes of carbon management. The parameter ranges applied in the sensitivity analysis are listed in Table 1 for parameters representing physical processes and in Table 2 for parameters representing sub-stitution and displacement.
Table 1
Observed carbon pools andfluxes of European forests reported in observations for the period 2000–2010. Observations were used to parameterize the carbon balance model. Pools and fluxes were expressed as absolute values and fractions of the observed annual NPP (also called normalized values) under the observed conditions. More details including disaggregated data and/or data covering more regions can be found in the respective referenced studies.
Pool orflux Symbol in text
Absolute value
Units Normalized value Range in the sensitivity analysis
Source
C-stock in biomass and soil B 17490 g C m−2 32.2 Pan et al. (2011)
C-stock in living biomass Bl 6351 g C m−2 19.6
Net primary production NPP 544 g C m−2yr−1 1.00 Luyssaert et al., (2007)) Net biome production NBP 89 g C m−2yr−1 0.14 Pan et al. (2011)
Harvest H 70 g C m−2yr−1 0.13 [0.07–0.28] Luyssaert et al. (2010), FAO (2009),Dolman et al. (2012)
Disturbance D 5 g C m−2yr−1 0.01 Dolman et al. (2012), Luyssaert et al. (2007), Van der Werf et al. (2009)
Average rotation period ?? 85 years – [42–170] ?? = Bl/(H + D)
Recalcitrant fraction RF 0.1 Observed heterotrophic respiration Rh 387 g C m−2yr−1 0.71 Luyssaert et al. (2007) Adjusted heterotrophic respiration Rh′ 383 g C m−2yr−1 0.7 Rh′ = NPP – H – D – L – NBP
rroot-leaves 0.3 (NPPleaf + NPProot)/(NPPtotal) where the
estimates of the NPP components are based on
Luyssaert et al. (2007)
rdebris 0.1 f_litter * (H + D) * (1-RF)
renv 0.3 [−0.15 to 0.45] Rh′-rroot-leaves-rdebris
Table 2
Observed parameter values reported in the literature and used to estimate the carbon budget of wood transformation and use chains between 2000 and 2010. Values and their variations are listed as used in the carbon balance model and the sensitivity analysis.
Wood pool Parameter Default value Sensitivity Unit Source
Range Distribution Residuals Fraction of harvested wood left on site 0.5 [0.4–0.6] Uniform –
Long-lived timber Fraction of removed wood 0.12 – Eggers (2002)
Expected lifetime 50 Years
Substitution coefficient 1.1 [0.28–2.1] Log-normal – Table S1
Medium-lived timber Fraction of removed wood 0.20 – Eggers (2002)
Expected lifetime 16 Years
Substitution coefficient 0.55 [0.09–3.3] Normal – Table S1
Pulp Fraction of removed wood 0.33 – Eggers (2002)
Expected lifetime 4 Years
Substitution coefficient 0 – Table S1
Energy Fraction of removed wood 0.35 – Eggers (2002)
Expected lifetime 1.7 Years
2.4. Sensitivity analysis
Five key parameters, i.e., (1) harvest intensity, (2) fraction of wood left on site as residue, (3) substitution efficiency, (4) intensity of the age-related decline in NPP and (5) the environment-related fraction of Rh(renv) were subjected to a sensitivity analysis to reveal how their
uncertainties affect the carbon balance of the forest sector. The range of the parameter values were based on a literature study so as to reflect current uncertainty (renv, flitter, S,αT) and/or credible options of
man-agement strategies (H, S) (Tables 1 and 2) and propagated to the se-questration efficiency of the forest sector using Eq. (4)by means of ensemble Monte Carlo simulations consisting of 3000 simulations with randomized sampling of thefive parameters. Statistical analysis of the ensemble of Monte Carlo simulations enabled us to disentangle the effects of each parameter on the sequestration efficiency. Similarly, the ensemble Monte Carlo simulations allowed us to delimit a safe opera-tional space for forest management and subsequent wood use or in other words, identify the parameter values for forest management and wood use that would reduce the growth rate of atmospheric CO2
con-centration.
2.4.1. Harvest levels
Today’s harvest level could be reduced: thereby restoring biodi-versity and thus satisfying ecological concerns (Christensen et al., 2005; Vandekerkhove et al., 2009). Halving harvest levels, for example, im-plies that about half of Europe’s currently managed forest would have to be taken out of production. Without a parallel halving of wood consumption in Europe, such a measure would result in a considerable displacement of the forest sector‘s carbon emissions to other regions in the world. On the other hand, today’s harvest levels could be increased to satisfy economic demands and concerns. Given that the present day harvest levels of 12 out of 34 Pan-European countries is below 50% of the annual increment, (Forest Europe et al., 2015), doubling today’s harvest level could still be within or close to the biological limits con-sidered to be sustainable from a production point of view in these re-gions. In this study, it was considered that European society has the choice of managing its forest anywhere along this gradient, hence, harvest levels were uniformly varied between the extensive option, where future harvest and disturbances are half of today's level and the intensive option, where future harvest and disturbances are double those of today (Table 1). Current policies are leaning towards in-creasing rather than dein-creasing harvest, which was represented in this study by applying a non-symmetrical uniform distribution around to-day’s level.
2.4.2. Residue left on site
A considerable amount of forest biomass is stored belowground in components such as the roots; harvesting will therefore always leave some residue on site, i.e., at least thefine root biomass. Concern that harvesting may export valuable nutrients from the forest and limit fu-ture tree growth, has resulted in the common practice of leaving leaves, roots, branches and bark on site and only removing the stem wood (Evans et al., 2013). At present about 50% (Lippke et al., 2011; Penman et al., 2003) of the biomass is left as residue and in extreme cases this value could increase to 60% (Eggers, 2002; Landmann and Nivet, 2014). Under more intensive practices, an estimated 40% of the bio-mass is left on site (Nabuurs et al., 2001). In this study, the observed range of 40–60% residue left on site was assumed to be uniformly distributed given the lack of data to justify any other type of statistical distribution (Table 2).
2.4.3. Substitution efficiency
Substitution coefficients have been reported for a large variety of wood uses and it was therefore possible to derive separate coefficients for each of the three categories of wood products, i.e., biofuel, medium-lived timber and long-medium-lived timber (Table 2 and Supplementary
Materials). Despite the relative wealth of data, the definition and use of substitution coefficients is subject to large uncertainties due to their dependence on methodological choices to define the characteristics of the industries, and the reference fossil-intensive scenario used (Hellweg and i Canals, 2014). At present the range of observed substitution coefficients is so large that it contains efficiencies for which wood use is a net benefit to the atmosphere or a net loss of carbon compared to alternative solutions. Given this large uncertainty, substitution was reported to have a large impact on the wood-products carbon balance (Fortin et al., 2012; Lundmark et al., 2014).
Based on the distribution of the compiled literature values, log-normal, normal and uniform probability density functions werefitted to the energy, medium-lived and long-lived timber uses respectively. Individual substitution coefficients reported in the literature represent specific products constructed by making use of specific processes and technologies, and compared to specific reference scenarios for a given alternative product or energy source. Therefore, it seems unlikely that the most/least efficient substitution that relates to use of one specific wood product, would become the overall substitution efficiency for all wood uses in Europe, because this would imply that the total European harvest had been used to produce this single product. For this reason, the uncertainty range assigned to the substitution coefficients was taken from the calculated range, restricting values to no more than two standard deviations away from the mean.
From a socioeconomic point of view, the three wood-product pools can be regarded as interdependent. Hence, it seems reasonable to ex-pect that societies with high substitution efficiencies for one pool are more likely to have high substitution efficiencies for the other wood-product pools. This reasoning is partly justified by the definition of the substitution coefficients: indeed, substitution potential is driven by the extent to which the current technology depends on fossil energy and on the efficiency of the wood transformation chain. The inter-dependency of the substitution coefficient between wood-use pools was im-plemented in the Monte Carlo approach byfirst sampling the observed distributions of the substitution coefficients, then sorting the sampled values andfinally randomly selecting substitution efficiency for one wood use and using the efficiency coefficients with the same rank for the other wood uses.
Substitution efficiencies are in principle estimated for the marginal production between a fossil-based and wood-based scenarios (Smyth et al., 2014; Werner et al., 2006). This study followed this definition and substitution coefficients were, therefore, applied to the marginal production, in other words, the production of wood products relative to the wood products in the reference simulation where all parameters were set to current values. As such, substitution accounted for the in-crease or dein-crease in wood-product production resulting from both changes in harvest level and in sink strength. As a consequence, an increase in wood production compared to the reference simulation will reduce the total CO2emissions through substitution or avoidance of
emissions within or outside the forest sector. Conversely, a decrease in wood-product production compared to the reference simulation will give rise to additional carbon emissions due to the need for more fossil-fuel intensive alternatives to provide products and energy currently provided by wood.
2.4.4. Sink strength
The causes of today's carbon sink are still under debate (see Introduction for details)), making it difficult to predict its future be-haviour within a meaningful confidence interval (Friedlingstein et al., 2014). Projections of the evolution of the European carbon sink as a response to environmental changes -under constant management practice between now and 2100-cover the whole range from main-taining the current sink for several more decades (Nabuurs et al., 2003), to sink saturation (Nabuurs et al., 2013), which could progressively become neutral or change sign to become a source, if extreme events such as the 2003 European drought were to become more frequent
(Ciais et al., 2005; Lindner et al., 2014). Simulated trends in the NBP to NPP ratio were obtained from the CMIP5 model intercomparison ex-ercise and. When projected onto the observed value, the sink strength by the end of the 21st century may vary by−0.3 to 1.3 times its current strength (Fig. S3). In this study, sink strength evolutions were varied between−0.5 and 1.5 times the current sink strength in 2100 by ad-justing the environmentally driven soil heterotrophic respiration com-ponent, renv. Varying the value of this parameter in the sensitivity
analysis represents present-day uncertainty of the effects of the en-vironmental conditions, e.g., CO2atmospheric concentration, nitrogen
fertilization, and temperature change, on the functioning of forest ecosystems. The model parameter renvwas adjusted to make the model
simulate an NBP that matched the prescribed sink strength. Hence, the simulations spanned eventualities of an enhanced sink, neutral sink behaviour and the conversion from today’s sink to a source. All simu-lations in the ensemble started from the same sink strength and varied linearly to their value for the year 2100.
2.4.5. Age-related decline of NPP
Although an age-related decline of NPP has been widely observed, the underlying mechanisms are still being debated (Ryan et al., 1997; Tang et al., 2014). The variation found in literature compilations of age-NPP relationships for boreal and temperate forests (He et al., 2012; Wang et al., 2011) was used as a proxy of the uncertainty of the timing and strength of the age-related decline of NPP. For each rotation length (i.e., harvest level) simulated by the model, the compilation of age-NPP relationships thus provided a mean and standard deviation of NPP re-ductions factors (αT). We assumed a normal distribution, mean and
standard deviation could be used to derive a statistical distribution of NPP reductions factors (Fig. S2), which could then be sampled as part of the sensitivity analysis while constrained to remain within two standard deviations of the distribution.
For example, an extensive harvest scenario involving a halving of the reference harvest rate corresponds to a doubling of the rotation length, which according to the composite growth relationships gives a reduction of the average NPP by a factor normally distributed around 0.88 with standard deviation ± 0.1 and constrained between 0.65 and 1.
2.4.6. Analysis of variance (ANOVA)
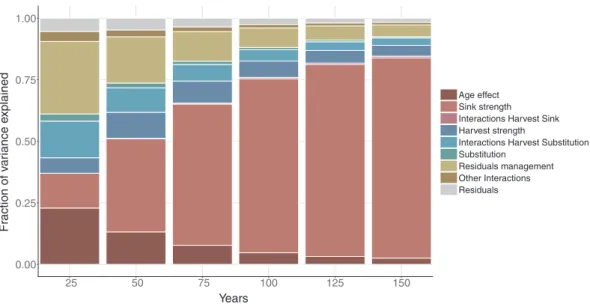
Analysis of variance (ANOVA Type-I) of the sequestration efficiency for a given time horizon (i.e., 25, 50, 75, 100, 125 and 150 years) was used to disentangle the uncertainty attributable to one of the five parameters included in the sensitivity analysis: namely, harvest level, residuals left on site, substitution efficiency, age-effect and sink strength. The total variance can then be decomposed as the sum of the variance explained by the effect of the five key parameters and their interactions. The Type-I ANOVA was repeated successively changing the order of the terms so that each parameter was tried atfirst and last position in the regression equation on which ANOVA is based. No change in the order of magnitude or in the ranking of the contributions was found. Only interaction terms of first degree (two parameter in-teractions) were taken into account. The variance (sum of squares) calculated for each factor is divided by the total variance (total sum of squares) yielding the fraction of the total variance explained by a given factor (Von Storch and Zwiers, 2001).
3. Results
The dominant drivers of the carbon sequestration efficiency of for-ests vary with time (Fig. 1). For time horizons of 25 years, 29% of the variation in carbon sequestration efficiency depends on the amount of harvest residue left on site and 24% on the harvest levels, substitution potential and their interaction. The assumed shape of the age-NPP re-lationship and the sink strength explain respectively 23% and 14% of the sequestration efficiency. The three management and wood-use
parameters with their interactions thus together explain 53% of the simulation variances. The physiological components of the carbon balance (age-effect or the effect on NPP of varying the rotation length, and sink strength or the response of forest to environmental and climate change) contribute another 37% to the variation of the sequestration efficiency displaying a balance in driving factors between forest eco-system and wood-use sector factors.
The dependency of the carbon sequestration efficiency on the parameters describing wood removal and use through harvesting, substitution and residue management decreases with time (Fig. 1) such that after 50 years, the sink strength is with 38%, already the single largest contributor to the total variance. For time horizons exceeding 75 years, more than half (57%) of the variation in sequestration e ffi-ciency is explained by the strength of the sink. Since all scenarios start from the same initial value of the sink and then linearly reach their target value over 100 years, the increase in the contribution of the sink strength to the total variance contribution is correlated (R2=0.98) to
the increase in the total variance with time.
Sequestration efficiency was found to be driven primarily by the sink strength (R2= 0.8 at 100 years) with larger sink values resulting
in larger forestry carbon sequestration (shown for a 100-year time horizon inFig. 2a). Despite the dominance of the evolution of the sink on the sequestration efficiency at this time horizon, human interference in the forest sector still has a role to play (Fig. 2b–e). For a given evolution of the sink, leaving more or less residue on site will respec-tively decrease or increase the sequestration efficiency by 0.03 on average with little variation from one sink strength to another (standard deviation 0.004 across sink strengths). These variations in sequestration efficiency are a response to a shift in carbon allocation, from left to decompose through respiratory fluxes under extensive residue man-agement to allocated to substitution-generating wood products under intensive residue management (Fig. 2c). Given the present-day net primary production of 544 g C m−2yr−1 and harvest intensity of 2.6 m3ha−1yr−1(Table 1), this change in sequestration efficiency re-presents a carbon sequestration of 16 g C m−2yr−1 or 61 kg C per harvested m3.
Similarly, aiming for wood usage with high or low substitution ef-ficiency will respectively increase or decrease the sequestration effi-ciency of the forest sector by 0.01 on average (standard deviation 0.003 across sink strengths) (Fig. 2d), a small effect of substitution alone consistent with the variance decomposition analysis showing that substitution is only a major driver of sequestration efficiency in its in-teraction with harvest (Fig. 1).
Harvest levels, however, display a somewhat different relation to sequestration efficiency. The effect of management strategy on se-questration efficiency will depend on the sink evolution, which owing to a lack of process understanding cannot be intentionally managed yet (Fig. 2b). Under an increased sink scenario, sequestration efficiency of the forest sector will be 0.15 with current harvest levels. Doubling the harvest volume will reduce the sequestration efficiency by 0.05 (equivalent to a loss of sequestration of 27 g C m−2yr−1at European scale), whereas halving the harvest volume will increase it by 0.02 (equivalent to a gain in sequestration of 11 g C m−2yr−1at European scale) showing the benefit of reducing the harvest under this scenario. The benefits of reducing the harvest volume would, however, be lost if over the course of the twenty-first century forests were to revert to carbon sources. Sequestration efficiency would then be 0.04, 0.04 and 0.02, for decreased, current and increased harvest levels alike. If cli-mate change leads to a stronger biospheric sink, forest management could enhance the carbon sequestration efficiency by reducing harvest levels. If however, forests responded to climate change by increasing their carbon respiration, forest management would lose its potential to increase the sequestration efficiency of the forest sector.
The safe operational space is defined by the parameter combinations that result in an increase in the sequestration efficiency compared to current practices. In Fig. 2 the safe operational space for the time
horizon of 100 years is delineated with a dashed line and simulations falling within the safe space are identified with hatching and dashed whiskers in Fig. 2. At 100 years, 69% of the strong sink simulations (13% of the simulations when all time horizons were combinedFig. 3) fall within the safe space. This number drops to 63% for the current sink strength, 24% with a weakened sink and less than 1% when the carbon sink in forests becomes neutral. If the forest sink were to reverse to neutral or become a source, the forest sector as a whole would still remove atmospheric CO2and thus act as a net carbon absorber but
there is no combination of management practices and wood use that would allow the sector to maintain or increase its current sequestration efficiency.
Threshold values resulting in a safe space under a given sink evo-lution and for a given time horizon are listed inTable 3for substitution efficiency, residue management and harvest levels. If the sink reverses into a source by the year 2100, no parameter combination will result in a carbon balance equal or better than today’s sequestration efficiency (Fig. 3andTable 3).
4. Discussion
4.1. A safe operational space
Our results show that when testing for realistic future wood uses and harvest practices, the forest sector as a whole will in 98% of the simulations over all time horizons remove atmospheric CO2and thus
act as a carbon absorber, even if the forests themselves become a carbon source as a response to environmental changes (Fig. 2).
If however, the aim is not to simply keep sequestering carbon but is to sequester more carbon than at present, a rather limited operational space was found for future wood-use and harvest practices (Fig. 3and Table 3). The key determinant of this safe operational space is the in-teraction between the planning horizon and the future evolution of the forest sink. Under the current growing conditions, the safe operational space depends on the ability of the forest sector to realize an efficient and effective substitution of wood for more fossil fuel-intensive mate-rials. Our results (Fig. 2) show, however, that for planning horizons exceeding 50 years, the capacity of the forest sector increasingly de-pends on the response of the forest to climate and environmental changes rather than on forest management (Hirsch et al., 2001) and technical advances in wood use (Ragauskas et al., 2006).
Within a single sink strength scenario, the large overlap between different management strategies (Fig. 2b–d) demonstrates that, except for the extreme cases, a similar sequestration efficiency can be realized
through different combinations of residue management, harvest in-tensity and substitution efficiencies. By changing the specifics of wood use and substitution (Fig. 2b), the sequestration efficiency of the forest sector can be altered by more than 100% for a given harvest level and sink strength. This would be the case when switching from harvest practices that leave 60% of the harvest as residue and use the harvested biomass to substitute for a low-emitting energy alternative such as nuclear electricity (low substitution potential) to harvest practices that leave 40% residues and use the wood to substitute concrete in long-lived buildings (high substitution potential).
If in 50 years from now, forest turns into a weaker (reduced by up to 60% in 2060), similar or stronger sink than today, there is a safe op-erational space where the present sequestration efficiency of the forest sector can be sustained or even improved. If the current sink weakens, then an increase in carbon sequestration efficiency at a 100-year hor-izon is only possible for substitution efficiencies exceeding 0.72 for long-lived wood products and 0.45 for energy substitution, irrespective of the harvest level and residual management. Such substitution effi-ciencies could be realized, for example, in Austria by replacing con-struction materials such as concrete, steel and aluminium by sawnwood (Bird, 2013) or in France by displacing oil-based heating by wood pellets (Fortin et al., 2012).
If in 50 years from now the forest sink becomes neutral or a carbon source, and wood transformation and use technology has not con-siderably advanced, a decrease in sequestration efficiency is to be ex-pected compared to today. If the sink were to become neutral, then substitution efficiencies of at least 1.68 for long-lived timber and 1.02 for energy are required for the forest sector to enhance its current se-questration efficiency over a 100-year time horizon. Such efficiencies could be realized through the substitution of steel joists by wooden beams in the construction industry (Bergman et al., 2014) or substitu-tion of fossil fuelfired electricity by wood-based electricity in the en-ergy industry (Cannell, 2003; Lippke et al., 2011).
Harvesting more wood may increase the sequestration efficiency if environmental changes start reversing the carbon sink (Fig. 2b), but it is not sufficient: channelling this additional wood to uses where the substitution effect is highest is crucial if Europe is to maintain the se-questration efficiency at or above today’s level. If the forests have turned into carbon sources, sequestration efficiencies could still be in-creased for time horizons of 25, 50 or 75 years. Substitution efficiencies will then need to exceed 1.63 for long-lived products, and 1.00 for energy production. In addition, less than 46% of the harvest should be left on site and the current harvest level will have to be increased by 45% (Table 3). 0.00 0.25 0.50 0.75 1.00 25 50 75 100 125 150 Years Fr action of v a ri ance e x plained Age effect Sink strength Interactions Harvest Sink Harvest strength
Interactions Harvest Substitution Substitution
Residuals management Other Interactions Residuals
Despite the current uncertainty in how the sink strength of forest will evolve in the future, financial incentives already exist for stimu-lating biomass energy production. The carbon neutrality argument for biomass energy has been used to justify the development of the wood sector (Johnson, 2009), to support the construction of biomass-burning energy plants (Beaton et al., 2011) or subsidize households to switch from fossil-based to wood-based energy systems (Cansino et al., 2011). Our results and others (Fortin et al., 2012; Holtsmark, 2012; Hudiburg et al., 2011; Kaipainen et al., 2004; Sievänen et al., 2014) show that such initiatives are at best only partly backed by scientific evidence.
Irrespective of the future evolution of the sink strength, our results caution against putting too much weight on forest management for planning horizons of 50 years or more. Even if the current sink strength
is maintained in Europe, completely different forest management stra-tegies such as halving or doubling harvest levels only affect the se-questration efficiency, which accounts for the forest sink, products pool and substitution, by +9 to−20% on average (+11 g C m−2yr−1to
−23 g C m−2yr−1). For scenarios with a decreasing carbon sink, the
impact of the management strategy on the sequestration efficiency is even lower (Fig. 2). Although the sink scenarios applied in this study imply a 25% chance that the current sink reverts to a source, 98% of the simulations predict that the forest sector as a whole will remain a net carbon absorber thanks to substitution and carbon storage in wood products. The possibilities for further increasing the carbon sequestra-tion efficiency of the forest sector appears, however, to be rather lim-ited with only 13% of the simulations leading to an increased
Fig. 2. Distribution of the sequestration efficiencies (vertical-axis) for a 100-year time horizon as a function of (a) the sink strength (horizontal-axis). The results shown in subplot (a) were further disaggregated for, (b) extensive, current and intensive harvest levels, (c) intensive, medium and extensive residue management, (d) high, medium and low substitution effi-ciencies, and (e) strong, medium, weak age effect. Diamonds represent the reference simulation and the hatched areas are the ‘safe space’ corresponding to simulations with sequestration efficiency above the reference simulation.
sequestration efficiency in 100 years. Increased sequestration effi-ciencies can only be reached if the sink is maintained or increased and if the wood is used in applications that come with a substitution potential well above unity.
4.2. Setting the level of ambition
In the previous paragraphs, the safe space was defined by using present-day sequestration efficiency as the baseline efficiency. A similar analysis could have been carried out defining the safe space from a dynamic baseline as the projected sequestration efficiency that would result from forests response to climate change without any change in management and wood-use practices. Our choice for this setting reflects the ambition of the forest sector towards mitigating fossil fuel emissions by sequestering carbon. In a context of still increasing emission from burning fossil fuel, the strict setting by choosing present-day seques-tration efficiency as the baseline is consistent with the attempt to avoid a future in which the forest sector sequesters less carbon than today, requiring other sectors to reduce their emissions even more.
The wording in the Paris agreement (UNFCCC, 2015), Article 5 “Parties should take action to enhance the sink“, leaves room for dif-ferent interpretations because it is not stated which baseline should be used. Any reference could be used, including the sink under future climate assuming current management practices will continue in the future. Which is the baseline used in some countries’ intended nation-ally determined contributions. Using such a baseline means that if the future sink turns out to be a source, forest management that decreases the source compared to the source under BAU would satisfy Article 5. Given that the forest sector would then act as a source, it would have become part of the problem rather than contributing to the solutio-n—yet still in line with international agreement on climate change mitigation.
Whether today’s sequestration efficiency or any other reference is used as the baseline thus reflects the ambition of the forest sector. Using today’s sequestration efficiencies would show a sound commitment of the sector to reducing the increase of atmospheric CO2concentration.
Using other baselines, especially dynamic baselines, could lead to the forest sector being accused of‘greenwashing’, i.e., of complying with the letters of the Paris Agreement but not its spirit.
4.3. Compensating for losses in sequestration efficiency
If current sequestration efficiencies cannot be sustained, the abso-lute amount of carbon sequestrated in the forest sector could be maintained by compensating the loss of efficiency by an increase of the NPP of European forests (see Eq.(2)). Total NPP could be increased by expanding the forest area, managing the age distribution towards younger forests, and/or using agricultural practices such as irrigation and/or fertilization. Fertilization and irrigation, however, have also been reported to act on sequestration efficiency: fertilization may in-crease the sequestration efficiency by reducing heterotrophic respira-tion (Janssens et al., 2010), while irrigation, on the other hand, may decrease sequestration efficiency by increasing soil respiration (Hartmann et al., 2016). Afforestation, managing the age structure, fertilization and irrigation may also have adverse direct and indirect effects on biodiversity (Burrascano et al., 2016), surface and ground-water quality and quantity (Jackson et al., 2005; Vörösmarty et al., 2013), and other greenhouse gas emissions (Aber, 1992). If the Eur-opean forest sector should fail to sustain or enhance its current level of carbon sequestration, reducing the growth rate of atmospheric CO2
concentration will require other sectors to compensate with additional emission reductions or alternatively rely on negative emission tech-nologies that are, however, not operational yet (Smith et al., 2016).
4.4. Reconciling carbon management studies
Previously, the conditions for carbon-optimal forest management strategies were studied under a variety of assumptions about the evo-lution of the forest sink. Some authors implicitly assumed that the current sink in mature forests would be sustained over the time-horizon of their studies (Fortin et al., 2012; Hudiburg et al., 2011; Liu and Han, 2009; Perez-Garcia et al., 2007; Trømborg et al., 2011). Other studies implicitly followed Odum’s framework (Odum, 1969) by assuming mature forests are carbon neutral (Lippke et al., 2011). Yet others based their analysis on explicit variations in the sink whether as a response to age structure changes or with an increasing productivity as a result of temperature and environmental changes (Poudel et al., 2012; Zubizarreta-Gerendiain et al., 2016). Given that the future sink strength is a key driver of the sequestration efficiency of the forest sector, it is not surprising that studies covering the whole range of scenarios came to apparently conflicting conclusions. Fig. 2 shows how apparently
Fig. 3. Fraction of all simulations falling in the carbon management safe space, i.e., resulting in a carbon sequestration efficiency equal to or above the current sequestration efficiency calculated with best-guess parameters for time horizons between 25 and 150 years.
conflicting results can be sourced to differences in the assumptions, rather than differences in the process understanding.
Although our approach can reconcile apparently conflicting results by varying key assumptions, a comprehensive reconciliation would require more detailed information on the assumptions made by other studies. The current lack of such information calls for future studies on the carbon balance of the forest sector to explicitly report their as-sumptions in terms of: (1) evolution of the sink, (2) harvest practices, and (3) fully documented substitution potential.
Although our analysis treated Europe as a uniform entity, the dif-ferent scenarios allow us to account for regional differences. All wood-use parameters being equal and harvest levels being comparable,
harvest levels could be increased in regions where the sink is weak to support a well-designed chain of wood uses. When making such deci-sions, one needs to consider the long-term legacy of management strategies on the forest structure and by extension the forest sector. Maximizing the sequestration efficiency over a 25–50 year period calls for reducing harvest levels, which will result in higher standing bio-masses. Although higher standing biomasses would increase the CO2
emissions from stand-replacing disturbances and decrease the net pri-mary production (Lundmark et al., 2014; Luyssaert et al., 2008) it would maintain the full range of future management options.
4.5. Limitations of the study
Our approach has the advantage that it is informed by recent ob-servation-based assessments (Luyssaert et al., 2010; Pan et al., 2011), addresses the complete carbon cycle of the forest sector, accounts for the major uncertainties, and separates net primary production from sequestration efficiency (see Eq(2)). Nevertheless, it comes with its own assumptions and limitations:
– The model developed for this study was one dimension by design. Spatially explicit analyses are out of reach for such an approach. The study itself focuses on the sensitivity of sequestration efficiency, the results of the study are therefore limited to sequestration efficiency and do not necessarily apply to the total carbon sink.
– The time-dependent partitioning of the variance depends on the ranges of parameter values considered in this analysis. As a pre-caution, care was taken to represent the current uncertainty of each factor across the timeframe of our analysis when defining the parameter ranges.
– Except for the sink strength, all other parameters are kept constant over time within a single simulation, which is thought to be ac-ceptable for residue management and harvest practices. However, the use of a constant substitution efficiency could be questioned for two opposing reasons: the substitution efficiency is expected to in-crease with the advancement of technology and better resource (re) use; but at the same time, the substitution efficiency is expected to decrease over time due to a decrease in GHG emissions of the re-ference product and energy mix used as a rere-ference in the life cycle analysis.
– Harvest levels, residue management, and substitution efficiencies are partly driven by the same economic, industrial and political processes and are therefore expected to be correlated with each other. Neither the present nor the future relationships between harvest levels, residue management, and substitution efficiencies could be determined and were therefore not accounted for in the simulations.
– The quantitative approach does not account for losses or gains in site fertility as could be expected from long-term changes in residue management. The observed benefits in carbon sequestration re-sulting from increased residue removal therefore only reflect the increase in wood available for products and carbon substitution but ignores the long-term feedback effect on the sink.
Despite the aforementioned limitations on the parameter ranges, relationships between parameters and temporal dynamics of site-ferti-lity, the dominance of the future sink strength is believed to be a robust feature because it correctly reflects the large uncertainty of the sink strength compared to the uncertainty of the other drivers of the se-questration efficiency of the forest sector.
Acknowledgements
This work has in part been funded through the French Environment and Energy Management Agency (ADEME, Bilan Carbone de la Forêt Française programme), the European Research Council (starting grant
Table 3
Safe space thresholds for substitution, residue management and harvest intensity. If the forest sector operates at parameter values below (residue left on site and harvest) or above (substitution efficiency) these thresholds, current sequestration efficiency can be maintained or increased for the given time-horizon. A minus (−) indicates that no parameter value permits a maintenance of the current sequestration efficiency, a plus (+) indicates that all parameter values are consistent with the maintenance of the current sequestration efficiency.
Mimimum substitution efficiency for long-lived timber allowing a safe space
Time (years) 25 50 75 100 125 150 Strong_sink + + + + + + Current_sink + + + + + + Weak_sink 0.17 0.17 0.17 0.17 0.22 0.22 Neutral + 0.33 0.36 0.55 – – Weak_source 0.23 0.23 0.23 – – – Strong_source + + – – – –
Mimimum substitution efficiency for medium-lived timber allowing a safe space
Time (years) 25 50 75 100 125 150 Strong_sink + + + + + + Current_sink + + + + + + Weak_sink −1.13 −1.13 −1.13 −1.13 −0.95 −0.95 Neutral + −0.54 −0.35 0.16 – – Weak_source −0.87 −0.87 −0.87 – – – Strong_source + + – – – –
Mimimum substitution efficiency for energy allowing a safe space
Time (years) 25 50 75 100 125 150 Strong_sink + + + + + + Current_sink + + + + + + Weak_sink + + + + + + Neutral + 0.29 0.30 0.36 – – Weak_source + + + – – – Strong_source + + – – – –
Maximum residue left on site to have a safe space (0.6 means that 60% of the harvest is left on site as litter)
Time (years) 25 50 75 100 125 150 Strong_sink 0.59 + + + + + Current_sink 0.59 0.59 0.59 + + + Weak_sink + + + 0.59 0.59 0.59 Neutral + 0.53 0.47 0.43 – – Weak_source + 0.56 0.43 – – – Strong_source 0.55 0.46 – – – – Maximum harvest intensity change (0.5 means a reduction by 2 of the average rotation
length) Time (years) 25 50 75 100 125 150 Strong_sink 0.55 0.55 0.55 0.55 0.55 0.55 Current_sink 0.54 0.55 0.55 0.55 0.55 0.55 Weak_sink + + 0.58 0.58 0.58 0.58 Neutral 0.53 0.84 1.64 1.99 – – Weak_source 0.52 1.43 1.47 – – – Strong_source + 1.61 – – – –