Zoological Journal of the Linnean Society, 2004, 140, 63–102. With 23 figures
E. MEIJAARD and C. P. GROVESA REVISION OF TRAGULUS
*Corresponding author. E-mail: [email protected]
A taxonomic revision of the Tragulus mouse-deer
(Artiodactyla)
E. MEIJAARD* and C. P. GROVES
School of Archaeology and Anthropology, Faculty of Arts, A.D. Hope Building, Australian National
University, 0200 ACT, Australia
Received October 2002; accepted for publication July 2003
The taxonomy of South-East Asian mouse-deer (Tragulus) is complex, and after some 120 years of considerable tax-onomic revisions of the genus a clear key is still lacking for the determination of species and subspecies. Through craniometrical analysis of 338 skulls of Tragulus and some study of coat coloration patterns we have come to a better understanding of mouse-deer taxonomy. Our results show that there are three species groups: the T. javanicus-group, the T. napu-javanicus-group, and T. versicolor. Within the T. javanicus-group we recognize three species: T. javanicus (from Java), T. williamsoni (from northern Thailand and possibly southern China), and T. kanchil (from the rest of the range), and within these species we provisionally recognize 16 subspecies. Within the T. napu-group we recognize two species: T. nigricans (from Balabac), and T. napu (from the rest of the range); within these species we provi-sionally recognize eight subspecies. T. versicolor from Nhatrang, south-east Vietnam, is distinct from the two pre-vious groups; it is, however, unclear whether this species is still extant. © 2004 The Linnean Society of London,
Zoological Journal of the Linnean Society, 2004, 140, 63–102.
ADDITIONAL KEYWORDS: chevrotain – coat colours – craniometrics – island fauna – South-East Asia – taxonomy – Tragulidae.
INTRODUCTION
The chevrotains or mouse-deer (Tragulidae) are an ancient group of ungulates, with a shared history dat-ing back to the Miocene. They are considered the sister-group of the remaining living Ruminantia (Groves & Grubb, 1982). In southern Asia, they are found in fossil assemblages dated at 18 million years before present (Myr), although they reached their highest diversity with five named and 52 unnamed species at around 11.5 Myr (Barry et al., 1991). Between 16 and 14 Myr, they were also common in the area that is now northern Thailand, although species diversity may have been low (Ducrocq et al., 1994). After 9 Myr, the tragulid family declined significantly in diversity in southern Asia (Barry et al., 1991), which may have been caused by the evolution of more open vegetation types. Presently there are three gen-era left, of which two, Moschiola and Tragulus, occur in the South and South-East Asian region.
Smit-van Dort (1989) studied the morphological dif-ferences between the four conventionally recognized species of tragulids, i.e. the African Hyemoschus
aquaticus, Moschiola meminna, Tragulus javanicus,
and T. napu. She could separate the two Tragulus spe-cies only by using metrical characters in the skeleton, i.e. the greater mouse-deer T. napu has stronger and broader feet than the lesser mouse-deer T. javanicus. Skull dimensions of T. napu and T. javanicus, espe-cially in specimens from small islands, converged to such an extent that the two species could not be reli-ably separated using skull characters (also see van Dort, 1988). Skin patterns do differ between the two species, with T. napu having mottled fur and light superciliary lines on the head, whereas T. javanicus normally has three strong white lines on the throat and has uniformly coloured upperparts (Smit-van Dort, 1989). There is, however, considerable variation within each species in the coloration and striping pat-terns, especially on the many islands where the spe-cies occur, and in several instances it is nearly impossible to determine whether a taxon is more closely related to T. napu or to T. javanicus. In fact,
Groves (1989) considered the two to be sibling species. Based on this geographical variation, Chasen (1940), the first major reviser of Tragulus, recorded 27 sub-species for T. napu and 26 for T. javanicus (some of which he had reallocated from one to the other) for the Malayan region, and at least ten more subspecies, pri-marily from mainland Asia, have been described in other publications. The determination of this plethora of subspecies has been based primarily on variation in skin patterns, but when, during preliminary research, we investigated skins of Tragulus we realized that the characteristics of the subspecies reported by Chasen (1940) and others were not always consistent, and there appeared to be considerable morphological over-lap between subspecies. Also, some taxa that Chasen had assigned to subspecies appeared to be distinct enough to qualify as species. We therefore decided to focus on a craniometrical analysis, because the taxon-omists who worked on the genus had paid relatively little attention to skull form.
In this research we investigated skulls of Tragulus to obtain a more transparent and consistent taxonomy for the genus. In addition we studied some skins, but because many type specimens especially of small island taxa are located in the Smithsonian Museum, which we did not visit, we were unable to assess the validity of all taxa. We intend to address the variation between these island taxa, and also variation within
M. meminna in future publications.
TAXONOMIC HISTORY OF THE TRAGULIDAE
The earliest scientific name generally considered applicable to a tragulid is Cervus javanicus Osbeck (1757), described from Nieu Bay, Ujung Kulon, Java. We are not convinced that this name actually applies to a tragulid at all; he may have been describing a juvenile cervid, perhaps Muntiacus muntjak. As this will be the subject of a future application to the Inter-national Commission on Zoological Nomenclature, we will not argue the case here.Pallas (1777) gave what we consider to be the first description of a specimen of a mouse-deer that he had obtained from Java; he did not name it, but Gmelin (1788) considered it a new species of musk-deer
(Mos-chus), and on the basis of Pallas’ description named it Moschus javanicus (see Appendix 1). Pallas’
descrip-tion not only clearly refers to a mouse-deer, but his mention of a grey nape confirms that the specimen was from Java, as no other mouse-deer species has this characteristic (e.g. Miller, 1903a). Pallas also cited Brisson’s (1762) generic name Tragulus, which had been substituted for Linnaeus’ Moschus; as Gentry (1994) showed, the type of this genus is pygmaea, but she proposed, following Ellerman & Morrison-Scott (1951), to designate Cervus javanicus Osbeck as type.
We propose instead to designate Gmelin’s Moschus
javanicus as type, which, with Pallas’ Tragulus, would
fix the name of the Javan mouse-deer as Tragulus
jav-anicus (this will be part of our submission to the
Commission).
Opinions as to the identity of javanicus, whether dated from Osbeck or Gmelin, have fluctuated between authors, from the large (napu group) to the small (kanchil group) and back. Raffles (1822), the first to mention the existence of two (or even three) species of South-East Asian mouse-deer, called the larger species Moschus javanicus Pallas and named the smaller M. kanchil, mentioning in addition a potential third species, ‘the Pelandok’, based on anec-dotal information. His specimens were from the Bengkulu district of Sumatra. His descriptions of the two named species are accurate, and recognizably those of the two that occur today sympatrically on Sumatra. Hamilton-Smith (1827) named Raffles’ Pelandok Moschus pelandoc, although his rather confused description suggests that he thought his specimen to be the same as Raffles’ ‘Napu’. Miller (1903b) finally rejected all descriptions of
M. javanicus, T. javanicus, and T. pelandoc, and
instead proposed a new species, T. focalinus, to desig-nate the species from Java.
Gray (1836) recognized Moschus javanicus Gmelin (with M. napu F.Cuvier a synonym), Moschus kanchil Raffles, and two new species: Moschus fulviventer (which he thought is probably Raffles’ ‘pelandok’) and
Moschus stanleyanus. After these initial descriptions
several intermediate revisions appeared. In a later publication, Gray (1843) dropped the genus Moschus, included it in the Bovidae, and referred the South-East Asian mouse-deer to Tragulus; he also introduced the name Tragulus affinis from Malacca. Blyth (1858) suggested that four (if not five) species of Tragulus were distinguishable. Milne-Edwards (1864) wrote a long review of the Tragulidae, recognizing Tragulus
javanicus, T. napu, T. kanchil and T. stanleyanus
(as well as South Asian T. meminna). Gray (1872) changed his species listing yet again and recognized
T. stanleyanus, T. javanicus (of which he maintained
that T. napu of Milne-Edwards was the adult, and his
T. javanicus the young), T. fulviventer (= Tragulus kanchil Milne-Edwards, 1864), and Tragulus pyg-maeus. One year later, Gray (1873) dropped the last
species again.
The late 19th and early 20th centuries were a time of prolixity in the taxonomy of Tragulus, when zoolo-gists such as Miller, Lyon, Lydekker, Kloss, Sody, Bon-hote and Chasen described numerous species and subspecies. They differed in their opinions on how spe-cies and subspespe-cies should be defined. For instance, Miller (1911) referred his new taxa to subspecies when there was some overlap in skin characteristics
between the specimens from two geographical groups, but when there was complete distinction he referred them to species; he was, however, not always consis-tent in this, and on occasion would nonetheless name a new form as a species despite acknowledging that there was some overlap with a closely related form. His approach resulted in naming a large number of taxa. Bonhote (1903) disagreed and suggested that most mouse-deer forms should be considered subspe-cies, especially the insular races.
Finally, in the 1930s and 1940s, Chasen, in collabo-ration with his colleague Kloss, revised the genus and reunited all taxa of Tragulus under the two species
T. javanicus (greater mouse-deer) and T. kanchil
(lesser mouse-deer). Since then most authors have fol-lowed this two-species plan, except that the nomencla-ture has had to be changed: van Bemmel (1949) pointed out that the greater mouse-deer does not occur on Java, so the name T. javanicus actually applies to the lesser mouse-deer, the next available name for the greater mouse-deer being T. napu.
MATERIAL AND METHODS
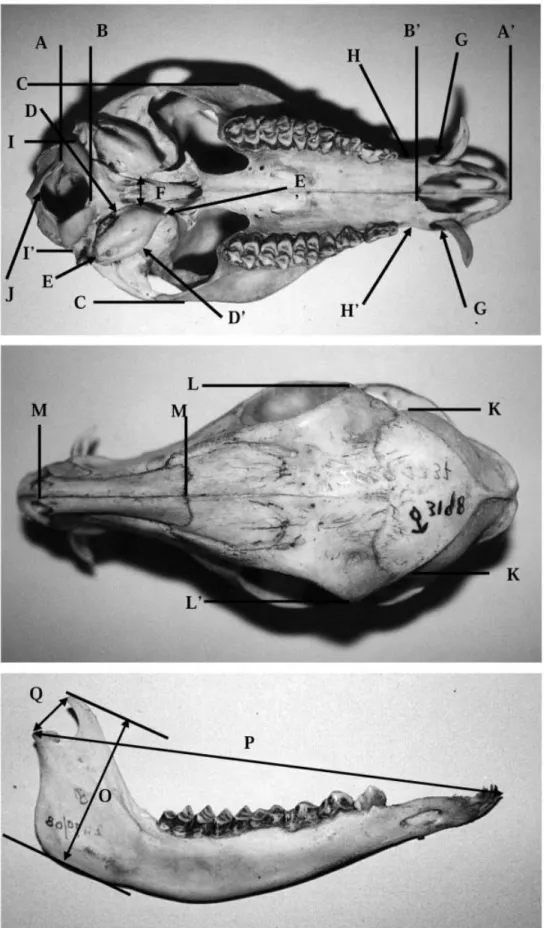
SKULLSOne of us (E.M.) measured 338 skulls of Tragulus in the following museums: Zoological Museum Cibinong (ZMC), Indonesia; Sarawak Museum (SM), Kuching, Malaysia; Zoological Reference Collection (ZRC), Singapore; National Museum of Natural History (NMHM), Leiden, the Netherlands; Zoological Museum Amsterdam (ZMA), the Netherlands; the Field Museum (FMNH), Chicago, USA; and the Brit-ish Natural History Museum (BNHM), London, UK (see Appendix 2 for the specimens list). Initially, E.M. measured 45 different dental and cranial characters on 17 Tragulus skulls in the Zoological Museum in Cibinong, Indonesia (formally Museum Zoologicum Bogoriense). These measurements were analysed to see which showed the most inter-, and intraspecific variation, and from the original 45 we selected 18 for detailed analysis (see Fig. 1 for measurement details). These were (letters refer to those in Fig. 1): condylo-basal length (CBL) = A–A′; basal–palatal length (BPL) = B–B′; zygomatic width (ZW) = C–C′; width of auditory bullae (BW) = D–D′; length of auditory bullae (BL) = E–E′; interbullae distance (IB) = F; canine width (CAW) = G–G′; least width across maxilla (LWM) = H–H′; condylar width (CW) = I–I′; width of braincase (WB) = K–K′; width across orbits (WAO) = L–L′; nasal length (NL) = M–M′; occipital height from basion (OHB) = B–N; occipital height
from opisthion (OHO) = J–N; mandible height
(MH) = O; mandible length (ML) = P; distance man-dibular condyle – coronoid process = Q; width across
paraocciptal processes (PPW) (not shown in Fig. 1); and shape coronoid process (the only observational character, not shown in Fig. 1).
All measurements were made with an accuracy of 0.1 mm with a pair of Vernier callipers (precision 0.05 mm). Because of the often poor quality of the bone material (e.g. skulls shattered or fractured by lead shot), and/or the difficulty of measuring repeatedly between exactly the same two spots on a skull, there was potential for considerable inaccuracy in some of the measurements. To investigate this, ten skulls were measured twice, with at least one day between the measurements. Measuring error within characters varied from 0.1 mm to 3.8 mm, or when averaged over all measurements of one character, between 0.09 mm and 1.06 mm. This equals between 1% and 66% of the standard error. Based on this, the following measure-ments were omitted from the analysis: distance man-dibular condyle – coronoid process (in which the average error was 66% of the standard error of the measurement); width across orbits (32%); and nasal length (25%). Also, the shape of the coronoid process was omitted from the analysis as it had not been con-sistently characterized.
For all skulls, we determined the age-class as follows: Adult = M3 erupted and basilar suture
(= spheno-occipital synchondrosis, which fuses with increasing age) fused; Young Adult–Adult = M3
erupted and basilar suture fusing; Young Adult = M3
erupted and basilar suture open; Juvenile 2 = M2
erupted, but not M3; Juvenile 1 = M1 erupted, but not
M2 or M3; and Infant = no permanent teeth erupted.
Additional skull measurements of 160 individuals were obtained from the literature. These measure-ments included ZW, and the maxillary tooth row. Lyon’s ‘maxillary tooth row’ measurements were found to be the same as measurements for upper molar tooth row, not tooth row as such.
SKINS
E.M. described 36 selected skins from the Zoological Reference Collection in Singapore, two from the Field Museum, and three from the British Natural History Museum, took photographs of the ventral and dorsal sides of the studied skins, and described the following characteristics: mottling of upperparts; colour code of upperparts; colour code of the side of the neck; visibil-ity of the neck line; the number of visible light throat lines; the degree to which the underparts were clearly separated in dark and light areas; colour code of the light underparts; colour code of the dark underparts; colour code of the throat–neck line; and colour code of the median flanking lines.
Colour codes of parts of photographed skins were described using the charts and codes in Ridgway
(1912). After ascribing colour codes to the various skin parts, the codes were transformed into ranked catego-ries. This was done because the total number of colours used was 44, which was too high in relation to the number of specimens and the number of variables. Also, the colour codes did not indicate any ranking. We developed a system to rank the codes across a spec-trum from dark and red to light and yellow. For this, we weighted the primary Ridgway colours (in this case R-O, OR-O, Orange, OY-O, Y-O, and O-Y) by 6, 5, 4, 3, 2, and 1, respectively. These we multiplied by a factor between 1 and 4.5 depending on the percentage white and black in the colour, according to the scale of tints and shades in Ridgway (1912). This number was mul-tiplied by a factor between 1 and 3 depending on the dullness of the colour (see Ridgway, 1912: 18). This numerical system provided a satisfactory classifica-tion of the skin parts in terms of levels of melanism, albinism, and erythrism. The resulting transformed, numerical colour codes were grouped into four groups per variable on an equal percentage basis (25% of the specimens in each group). For the statistical analysis both grouped and ungrouped transformed colour codes were used. The coat variables other than colour were scored either as binary data (absent/present), for instance in mottling of upperparts, or as counts, for instance in number of necklines.
In order to test the consistency of the skin descrip-tions, we described six skins twice, and transformed their descriptions as described above. Based on that assessment we omitted from the further analysis the descriptions for colour code of the median flanking lines, and the colour code of the side of the neck. In addition to the museum specimens, we used skin descriptions from the literature.
STATISTICALANDBIOGEOGRAPHICALANALYSIS We analysed the skull measurements and skin descriptions with SSPS 11.0 software (Data Theory Scaling System Group (DTSS), 1999). Firstly, we determined for each species whether there was a sig-nificant difference between measurements for males and females within each age class, using an analysis of variance (ANOVA) test. Secondly, we determined whether there were significant differences between the age classes, again using an ANOVA. Subsequently, we made classifications between and within the spe-cies using the following multivariate techniques: prin-cipal component analysis (PCA), categorical prinprin-cipal component analysis (CATPCA), and discriminant analysis (DA). The goal of principal components anal-ysis is to reduce an original set of variables into a smaller set of uncorrelated components that represent most of the information found in the original vari-ables. The technique is most useful when a large
num-ber of variables prohibits effective interpretation of the relationships between objects. Discriminant anal-ysis is useful for situations in which we want to build a predictive model of group membership based on observed characteristics of each case. The procedure generates a set of discriminant functions based on lin-ear combinations of the predictor variables that pro-vide the best discrimination between the groups. These techniques allowed us to analyse our large data set.
For the biogeographical analysis and mapping we plotted the specimens’ localities on maps using Arc-View GIS 3.2a software. We also added species pres-ence records from other literature sources.
TAXONOMICDEFINITIONSANDCONCEPTS To resolve the confused taxonomy within the genus
Tragulus an objective understanding is needed of what
constitutes a species and what a subspecies. To achieve this we use the phylogenetic species concept: a species is a diagnosable entity, meaning that it differs abso-lutely from all other species, implying fixed heritable differences (Cracraft, 1983, 1997). This species concept is similar to the one used, if not entirely consistently, by Miller (1901b, 1902b, 1903a, 1903c, 1911) in his description of mouse-deer taxa. The more generally used ‘biological species concept’, whereby species are reproductively isolated, is impossible to apply in the case of mouse-deer, in which most of the described taxa are totally allopatric. We therefore assign taxa to dis-tinct species if all specimens can at once be referred to one sample or the other (Groves, 1989).
We will follow the 75% rule rules for naming a species: 75% of the individuals classified in one sub-species are distinguishable from 100% of the individuals belonging to the other subspecies of the same species, which is statistically equivalent to 90% joint non-overlap (Mayr, Linsley & Usinger, 1953).
RESULTS
DIFFERENCESBETWEENREPUTED T. NAPUAND
T. JAVANICUS/KANCHIL
An ANOVA revealed that there were no significant differences between the males and females of
T. javanicus/kanchil and T. napu, apart from the
canine width and least width across maxilla (which are wider in males because of the larger canine teeth). Also, there were no significant differences between the three age classes of mature mouse-deer, but the juve-nile specimens were significantly smaller than the mature specimens. We therefore decided to analyse mature males and females simultaneously and omit the juvenile specimens from the analysis.
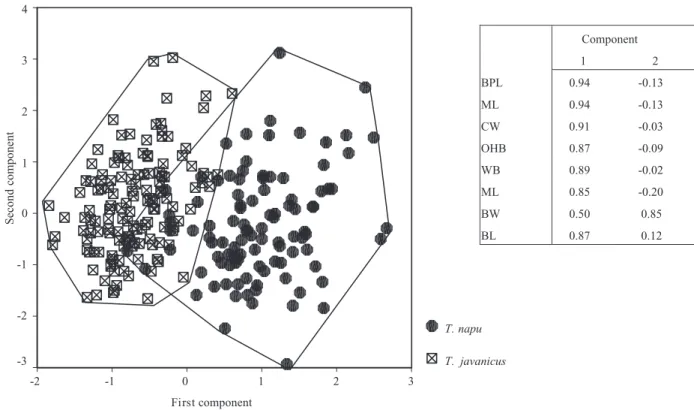
A principal component analysis of skull measure-ments of mature specimens indicated that there were two groups that largely coincided with the convention-ally recognized taxa T. napu and T. javanicus/kanchil, as indeed was indicated on the specimen labels (Fig. 2). Correlations between the variables and the components (see component matrix) showed that the difference between T. javanicus/kanchil and T. napu was primarily caused by size, as all the correlation coefficients of the first component, which accounted for 73% of the total variance, were very strongly positive, only bullae width having a correlation value of less than 87% (also see Table 1). We had initially left out
the OHO measurement because it was not available for a large number of skulls. When we added it to the analysis the separation between the groups increased (data not shown), but it was unclear whether the increased separation between the groups was real or caused only by the decreased number of specimens in the analysis.
A Categorical Principal Component Analysis of skin coloration patterns did not manage to group specimens within each of the species meaningfully. This may have been because determining colour codes of photographed skin parts was difficult, and it was even harder to compare these data reliably with
Figure 2. Principal component analysis of T. napu and T. javanicus, and corresponding component matrix. Component 1 2 BPL 0.94 -0.13 ML 0.94 -0.13 CW 0.91 -0.03 OHB 0.87 -0.09 WB 0.89 -0.02 ML 0.85 -0.20 BW 0.50 0.85 BL 0.87 0.12 First component 3 2 1 0 -1 -2 Second component 4 3 2 1 0 -1 -2 -3 T. napu T. javanicus
Table 1. Means and standard deviations of T. javanicus and T. napu. CL = canine length; C-C is the distance between the tips of the canines. For other abbreviations see Methods
CBL BPL ML ZW CW OHB WB MH OHO BW BL IB CL C-C T. javanicus Mean 88.5 65.5 73.6 42.1 19.8 26.9 31.3 28.4 19.4 8.8 17.9 5.1 16.0 29.0 N 233 167 165 277 168 171 172 164 91 167 161 161 10 8 SD 4.3 3.1 3.4 1.8 0.9 1.0 1.3 2.1 1.4 0.7 1.1 0.7 4.2 2.5 T. napu Mean 102.6 75.0 85.0 48.1 22.4 29.3 34.3 33.2 20.5 9.1 20.2 6.4 23.1 35.2 N 128 121 119 169 115 120 121 114 47 116 115 105 5 4 SD 5.3 4.4 5.1 2.5 1.3 1.5 1.4 2.4 1.9 0.8 1.4 0.8 5.9 2.4
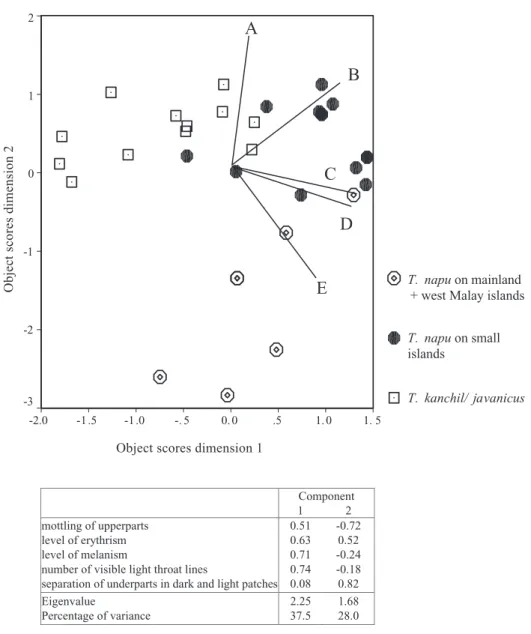
descriptive data from the literature, even though some authors used the same Ridgway colour charts as in this analysis. When we omitted the literature data from the analysis, we found more interesting patterns (see Fig. 3). One group contained all
T. javanicus (note, however, that no Javan and
Sumatran specimens were in the analysis), a second group contained T. napu from the small Sundaland islands, and a third group contained T. napu from Borneo, the Malay Peninsula, west Malay islands, and Indochina (but no specimens from Sumatra were available for this analysis; for locations see Fig. 4). An analysis of the component loadings of each of the factors showed that T. javanicus/kanchil is separated
from T. napu primarily by the number of throat stripes, the visibility of the nape line, and the mot-tling of the upperparts, thereby confirming what has been reported in the literature by many authors. The
T. napu group was split into two groups primarily on
the level of melanism and erythrism. Specimens from the larger islands (Borneo and Sumatra) and the Asian mainland and Malay Peninsula are generally dull, yellowish brown, whereas specimens from the small Sundaland islands show a varying amount of black and/or red in parts of their fur. This melanism was also present in the T. javanicus/kanchil group, but the geographical variation of this was less consis-tent than in T. napu.
Figure 3. Categorical Principal Component Analysis of mouse-deer skin coloration patterns, showing three groups. The lines A–E indicate the component loadings for the variables included in this analysis: A = separation of underparts in dark and light patches; B = level of erythrism; C = number of throat lines; D = level of melanism; and E = mottling of upperparts.
Component
1 2
mottling of upperparts 0.51 -0.72
level of erythrism 0.63 0.52
level of melanism 0.71 -0.24
number of visible light throat lines 0.74 -0.18 separation of underparts in dark and light patches 0.08 0.82
Eigenvalue 2.25 1.68
Percentage of variance 37.5 28.0 Object scores dimension 1
1. 5 1. 0 .5 0. 0 -. 5 -1 .0 -1 .5 -2.0
Object scores dimension 2
2 1 0 -1 -2 -3 T. napu on mainland T. napu on small islands T. kanchil/ javanicus
A
B
C
D
DIFFERENCESWITHIN T. NAPU
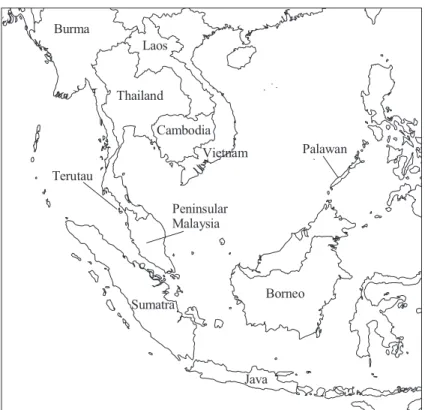
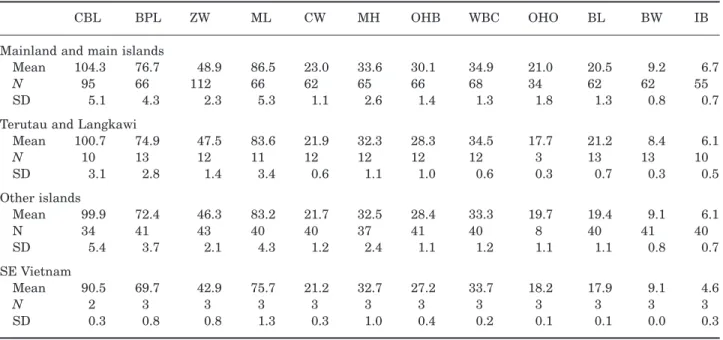
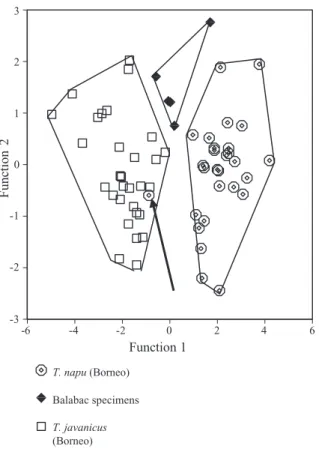
Based on the outcome of a principal component anal-ysis of the T. napu skull measurements, we grouped the specimens into four geographical units: (1) Teru-tau and Langkawi Islands; (2) Borneo, Sumatra, the Malay peninsula, and mainland Asia; (3) islands off-shore from the areas in group 2 but excluding those in group 1; and (4) the isolated T. napu versicolor popu-lation in SE Vietnam (note that T. napu does not occur on Java). A discriminant analysis of the adult speci-mens in these groups resulted in a 90% correct classi-fication of the originally grouped cases. When young adult–adult specimens were added, the classification accuracy dropped to 85.9%, but there was still a clear separation between the four groups (Fig. 5). The SE Vietnam group is distinct from the others as no spec-imens from this group were embedded in any of the other groups. In addition to this, it was noted that specimens from Balabac, an island south-west of the Philippine island of Palawan, grouped closely together, although they were still embedded in the group of Borneo, Sumatra, and Malaya specimens.
The skulls from Borneo, Sumatra, the Malay penin-sula, and mainland Asia have the highest mean values for all the measurements (‘Mainland and main islands’ in Table 2). The SE Vietnam specimens were primarily distinguished by their overall small size, and a high value for function 3 (not shown here),
which correlated with a relatively wide braincase and condyles. The Terutau and Langkawi specimens were characterized by a low value for function 2, which mostly correlates with relatively long, narrow audi-tory bullae, a relatively wide skull, i.e. high values for ZW, CW, and WB, and relatively high values for OHO and OHB (see Table 2). The two groups consisting of specimens from Borneo, Sumatra, and Malaya, and small Sundashelf islands specimens partly overlap.
Variation within the Borneo, Sumatra, Malay penin-sula, and Asian mainland groups
A discriminant analysis within the Borneo, Sumatra, Malay peninsula, and Asian mainland geographical groups could not meaningfully distinguish between them. Furthermore, an ANOVA between the nomi-nate form from Sumatra and specimens from Borneo did not result in statistically significant differences between the groups, nor did the same test between Sumatran and Malayan/Thai/Burmese specimens. The means and standard deviations for these groups are provided in Table 3. There was some differentia-tion between skin patterns from the different regions (we were unable to study any skins from Sumatra), but because the series from each of the regions were too small it remained unclear how the interregional variation related to the observed intraregional variation.
One specimen (ZRC 4.4731), a juvenile from Pangkor Island (2 km off the west coast of the Malay peninsula), had skin coloration patterns similar to
T. napu from the Malay peninsula, with black
streaked, yellowish-brown upperparts, dark nape streak, and a normal throat pattern.
Borneo and adjacent islands. An initial analysis of
the means of T. napu measurements of specimens from Borneo and nearby islands showed that speci-mens of T. n. nigricans (N = 7) from the Philippine island of Balabac, north of Borneo, were significantly smaller than any of the other specimens. This raised the possibility that the classification of this subspecies
as T. napu was wrong, and that it should have been classified as a member of the T. javanicus/kanchil group instead. A discriminant analysis using five skull measurements of young adult, young adult–adult, and adult specimens from Balabac, and of specimens of the
T. javanicus/kanchil and T. napu groups from Borneo,
however, showed that the three groups are completely separated (Fig. 6). Balabac specimens were of inter-mediate length and they were differentiated from the two other groups by low values for WB, CW, OHB, BW, and BL (low BL also translated into a relatively high IB) (see Table 4). Because there were few differences within the Borneo/Sumatra/Malaya group of T. napu specimens (see above), and they will probably form
Figure 5. Discriminant analysis of mature specimens of T. napu and corresponding component matrix.
Function
1
2
3
ZW
0.45
0.32 0.29
BL 0.44
0.11 0.07
ML
0.28
0.47 0.27
IB
0.3 0.45
0.2
BW
-0.15 0.35 0.29
OHB 0.32
0.38 0.71
CW 0.24
0.29 0.63
WB
0.31 -0.06 0.55
BP
0.3 0.22 0.42
MH 0.07
0.14
0.4
Function 1 4 2 0 -2 -4 -6 Function 2 3 2 1 0 -1 -2 -3 -4 Southeast Vietnam Small Sundashelf islands Terutau + Langkawi islands Borneo, Sumatra, Malaya, Asiaone subspecies, we also compared the Balabac speci-mens to all specispeci-mens from this larger group. The two groups were separated in a discriminant analysis with 95% accuracy using the measurements for BPL, ML, ZW, CW, and OHB. An ANOVA showed that the Bal-abac specimens were significantly smaller (P < 0.01) for CBL, BPL, ML, ZW, CW, OHB, and WB. We found similar results for a comparison between the Balabac specimens and the joined groups of Borneo, Sumatra,
and Malaya, and the small Sundashelf islands (minus Bunguran) specimens.
Specimens from Banggi, another island off northern Borneo, also differed from the rest of the Bornean spec-imens. We only measured two specimens from this island, of which one was juvenile, and we were unable to study any skins. The measurements of the adult specimen suggested that the island taxon is consider-ably smaller than that from the mainland, but clearly
Table 2. Means and standard deviations (SD) for mature T. napu skulls (mm)
CBL BPL ZW ML CW MH OHB WBC OHO BL BW IB
Mainland and main islands
Mean 104.3 76.7 48.9 86.5 23.0 33.6 30.1 34.9 21.0 20.5 9.2 6.7
N 95 66 112 66 62 65 66 68 34 62 62 55
SD 5.1 4.3 2.3 5.3 1.1 2.6 1.4 1.3 1.8 1.3 0.8 0.7
Terutau and Langkawi
Mean 100.7 74.9 47.5 83.6 21.9 32.3 28.3 34.5 17.7 21.2 8.4 6.1 N 10 13 12 11 12 12 12 12 3 13 13 10 SD 3.1 2.8 1.4 3.4 0.6 1.1 1.0 0.6 0.3 0.7 0.3 0.5 Other islands Mean 99.9 72.4 46.3 83.2 21.7 32.5 28.4 33.3 19.7 19.4 9.1 6.1 N 34 41 43 40 40 37 41 40 8 40 41 40 SD 5.4 3.7 2.1 4.3 1.2 2.4 1.1 1.2 1.1 1.1 0.8 0.7 SE Vietnam Mean 90.5 69.7 42.9 75.7 21.2 32.7 27.2 33.7 18.2 17.9 9.1 4.6 N 2 3 3 3 3 3 3 3 3 3 3 3 SD 0.3 0.8 0.8 1.3 0.3 1.0 0.4 0.2 0.1 0.1 0.0 0.3
Table 3. Means and standard deviations (SD) of measurements on mature T. napu specimens from Borneo, Malaya, and Sumatra (mm) CBL BPL ML ZW CW OHB WB MH OHO BW BL IB Sumatra Mean 107.0 79.1 87.4 49.4 22.8 30.6 34.7 33.7 21.8 9.1 20.5 6.5 N 19 13 14 25 13 13 13 13 9 13 13 12 SD 6.1 4.8 7.5 3.1 1.4 1.7 1.4 3.7 1.9 1.0 1.5 0.8
Malaya, Thailand south of Isthmus of Kra
Mean 106.7 75.3 85.2 49.4 23.7 30.0 34.8 35.3 20.6 9.6 20.5 7.4
N 3 5 5 5 5 5 5 5 4 5 5 5
SD 0.5 3.7 5.8 2.5 1.0 0.8 1.9 2.4 2.5 0.8 0.5 0.4
Thailand/Burma, north of Isthmus of Kra
Mean 105.8 78.1 89.0 49.5 23.0 30.7 35.8 33.7 9.8 21.8 6.9 N 5 6 6 6 6 6 6 6 6 6 5 SD 8.7 6.6 7.3 3.2 1.1 1.8 1.6 3.0 0.6 1.2 0.7 Borneo Mean 104.1 76.4 86.5 48.8 23.2 30.0 34.9 33.5 21.0 9.2 20.5 6.7 N 52 36 35 60 32 36 38 35 16 32 32 27 SD 3.6 3.1 3.0 1.8 0.7 1.1 1.2 2.0 1.7 0.7 1.1 0.7
our sample size was very small. Because Chasen & Kloss (1931) suggested that the Banggi Island speci-mens were very near to both T. nigricans from Balabac and T. napu borneanus, we compared the Balabac and Banggi specimens with the nominate subspecies
T. n. napu to investigate the relationships further. The
results were inconclusive, largely because we only measured one Banggi specimen, with additional mea-surements for two specimens from the literature.
When we compared the Banggi specimen with
T. n. nigricans, T. napu from Borneo, and the T. javanicus/kanchil group from Borneo, it grouped
with the latter (Fig. 6), which suggests that it may ini-tially have been misclassified, and that it should instead be classified as belonging to the T. javanicus/
kanchil group.
Within Borneo the size of T. napu skulls varied considerably. The smallest specimens originated from Sarawak, the largest from Sabah and East Kalimantan, and intermediately sized specimens from West and Central Kalimantan (Table 5). There were no skin descriptions or photographs available to check whether these differences in skull dimen-sion translated into similar groupings of skin patterns.
Sumatra and west Sumatran islands. Two subspecies
of T. napu have been described for mainland Sumatra, the nominate subspecies T. napu napu E. Geoffrey & F. Cuvier, 1822, which Sody (1931) restricted to South Sumatra, and T. n. neubronneri Sody, 1931, from Aceh, northern Sumatra. Furthermore, several sub-species were described for islands off the west coast of Sumatra, including amœnus and jugularis (Miller, 1903b) from Mansalar (= Musala) Island, batuanus (Miller, 1903c) from Tana Bala Island, and niasis (Lyon, 1916) from Nias Island. The subspecies from the islands off the east coast of Sumatra are analysed in the next section.
Within Sumatra, we compared specimens from north (N = 7) and south (N = 6) of Lake Toba, the main faunal break in Sumatra (Whitten et al., 2000). Simi-lar to what Sody (1931) reported, the northern speci-mens were larger than those from the south, although none of the differences was significant when tested in an ANOVA. The one specimen from Nias in this research, an adult female, was slightly smaller than the mean values for the northern mainland popula-tion, and had a relatively narrow skull (low values for ZW, CW, and WB). Neither a principal component analysis nor a bivariate analysis could significantly
Table 4. Means and standard deviations (SD) of measurements for mature mouse-deer from Borneo and Balabac (mm)
BPL ML ZW CW OHB WB OHO BW BL IB Balabac Mean 69.2 80.2 44.2 19.9 27.5 32.0 20.2 8.4 19.9 6.0 N 6 6 6 6 6 5 5 6 5 6 SD 4.1 3.3 1.4 0.8 0.8 0.7 0.7 0.5 0.8 0.8 T. javanicus (Borneo) Mean 66.6 74.3 42.4 20.3 27.6 32.6 20.8 9.6 18.7 4.9 N 35 35 65 35 36 36 22 36 33 34 SD 2.9 3.5 1.8 0.9 1.1 1.3 1.2 0.6 0.9 0.6
Figure 6. Discriminant analysis of T. javanicus and T. napu specimens from Borneo and specimens from Bala-bac. The arrow points to a probably misclassified T. napu banguei specimen (see text).
Function 1 6 4 2 0 -2 -4 -6 Function 2 3 2 1 0 -1 -2 -3 T. napu (Borneo) Balabac specimens T. javanicus (Borneo)
separate the Nias specimen from the nominate
T. napu from Sumatra. Miller (1903b) provided
mea-surements for two specimens from Musala (which he assigned to different species); again these were slightly smaller than those from the mainland although larger than the Nias specimen.
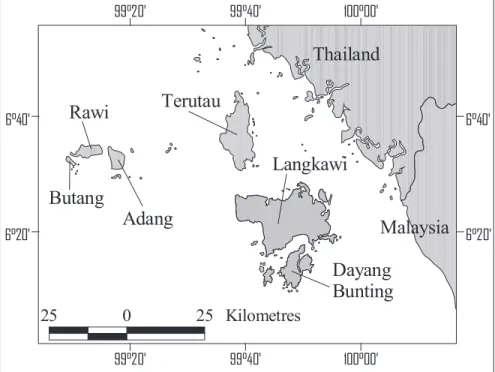
Variation within the Terutau/Langkawi group
To explore the difference between the Terutau speci-mens and the adjacent group from Borneo, Sumatra, Malay Peninsula, and Asian mainland we compared these without the inclusion of the small Sundaland islands specimens. The two groups were classified with 92.5% accuracy in a discriminant analysis, which means that in that analysis 92.5% of the cases were classified to belong to their original group, the rest having a higher probability of belong-ing to another group. Furthermore, we conducted three ANOVAs: Terutau/Langkawi vs. the combined Borneo, Sumatra, Malaya, and small Sundaland islands groups (minus Bunguran); Terutau/Langkawi vs. the Borneo, Sumatra, and Malaya group; and Terutau/Langkawi vs. specimens from the adjacent Malay peninsula. All three ANOVAs resulted in sig-nificant differences (P < 0.01) for CW, OHB, OHO (only the first two tests), BW, and IB (only for the last two tests).
Two subspecies of T. napu have been described from these islands, T. canescens terutus Thomas & Wrough-ton, 1909, from Terutau, and T. canescens umbrinus Miller, 1900, from Langkawi. The main difference between the two subspecies, according to Thomas & Wroughton (1909), was the dark-coloured nape, con-sidered characteristic of umbrinus, which was com-pletely absent in the seven specimens of terutus that they investigated. The two terutus skins studied in
this research (ZRC 4.4724, 4.4784), however, both had a black stripe in the neck, which connected to a black patch on top of the head. We did not study any skins from Langkawi. We measured one adult skull from Langkawi (BNHM 9.11.1.166) and 12 from Terutau (11 adults, one young adult), and a comparison of skull dimensions showed a major difference. For five of the seven measurements, values for the Langkawi speci-men were completely outside the range of the maxima for the Terutau specimens. For instance, CBL for the Langkawi specimen was 108.4 mm, whereas that for the Terutau specimens (N = 9) ranged from 97.1 to 102.1. The Terutau specimens were overall consider-ably smaller than the Langkawi specimen, apart for the relatively high values of ZW, CW, WB, OHO, and OHB, which are exactly those that separated the Ter-utau/Langkawi group from the Borneo, Sumatra, and Malaya specimens (see above).
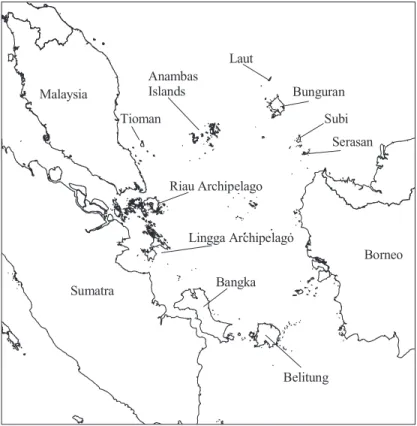
Variation among the small Sundaland islands
An ANOVA of all skulls of specimens from the Lingga, Riau, and Anambas island groups, and from the islands of Tioman and Bunguran (see Fig. 7) sug-gested that the specimens from Bunguran were dis-tinct, primarily because they are much larger than the other skulls (Table 6). Measurements for BPL, CBL, WB, CW, ML, and MH differed significantly (P < 0.01). Compared with those from Borneo, the Bunguran skulls are larger, but significantly so only for CBL (ANOVA, N = 55, P < 0.05). The Anambas skulls are smaller than the other Sunda Shelf island specimens, although there is some overlap with the lower end of the Riau, Lingga, Tioman group; in an ANOVA of the two groups only the interbullar distance differed sig-nificantly (P < 0.01). We further investigated speci-mens from the small Sundaland islands using
bi-Table 5. Means and standard deviations (SD) of measurements (in mm) for mature specimens of T. napu from different parts of Borneo
CBL BPL ML ZW CW OHB WB MH OHO BW BL IB
Sabah andEast Kalimantan (north of the Mahakam River)
Mean 104.6 76.1 85.8 48.9 22.9 29.9 35.0 33.6 20.8 9.0 20.0 6.8
N 33 19 17 34 18 19 19 18 10 17 17 15
SD 4.5 4.0 5.1 2.2 1.0 1.5 1.2 2.5 1.9 0.6 1.5 0.7
Sarawak and NW Kalimantan (north of the Kapuas River)
Mean 100.5 76.4 86.3 48.7 23.1 30.4 35.7 33.4 20.5 9.1 21.0 6.5
N 6 5 6 8 5 5 6 6 3 4 4 3
SD 3.2 3.7 3.6 1.2 0.6 0.5 0.5 2.2 2.4 1.0 1.0 0.6
West and Central Kalimantan (south of the Kapuas River)
Mean 103.0 73.5 85.2 48.8 23.4 29.6 35.3 31.2 21.1 8.7 20.3 6.8
N 8 4 4 8 4 4 4 3 3 4 4 3
variate analyses. Three combinations, ML vs. MH, ZW vs. WB, and BPL vs. WB, resulted in a distinct differ-entiation of the three Bunguran specimens from the rest. One of the three Bunguran specimens was a young adult, and when we restricted the analysis to adult specimens the picture was even clearer (see two examples in Fig. 8).
According to Miller (1900) the middle upper premo-lar (= PM3) in the only specimen of T. rufulus (from
Tioman Island) that he investigated differed from
oth-ers by its nearly equilateral triangular shape, as opposed to the normally square shape of this tooth. All other teeth were similar to those of T. n. napu. We found similarly shaped premolars in skulls of both the
T. javanicus/kanchil and T. napu groups, from Laos,
Borneo, Peninsular Malaysia, and Vietnam (note that we only noticed this aberration late in our research and may have overlooked further examples of it), which suggests that this dental character has no tax-onomic value.
Figure 7. Overview of the main islands and island groups of the Sundashelf.
Table 6. Means and standard deviation (SD) of measurements for mature specimens of T. napu from the small Sundaland islands (mm) CBL BPL ML ZW CW OHB WB BW BL IB Anambas islands Mean 96.9 72.7 81.1 45.9 21.2 27.4 32.9 8.9 19.5 5.1 N 4 3 3 4 3 3 3 3 3 3 SD 4.9 2.0 4.2 2.2 1.0 0.8 1.0 0.5 1.0 1.2 Bunguran Island Mean 108.5 80.8 91.0 49.1 24.2 29.0 36.3 9.8 20.9 6.3 N 4 2 2 4 2 2 2 2 2 2 SD 7.8 4.9 6.9 2.0 1.8 2.7 1.1 1.6 1.1 0.8
Lingga, Riau, and Tioman islands
Mean 100.0 72.9 84.2 46.7 22.1 28.7 33.3 9.4 19.4 6.2
N 18 23 22 22 22 23 23 23 23 22
DIFFERENCESWITHINTHE
T. JAVANICUS/KANCHILGROUP
Experimentation with different geographical samples of the T. javanicus/kanchil group in a discriminant analysis revealed that there were considerable differ-ences between skulls of adult specimens from Borneo, Java, the islands west of the Malay Peninsula (Langkawi, Butang, Rawi, and Pipidon, see Fig. 9), and a combined group of specimens from Sumatra, the Malay peninsula, mainland Asia, and all islands on the Sunda Shelf (Fig. 10). In particular, the west
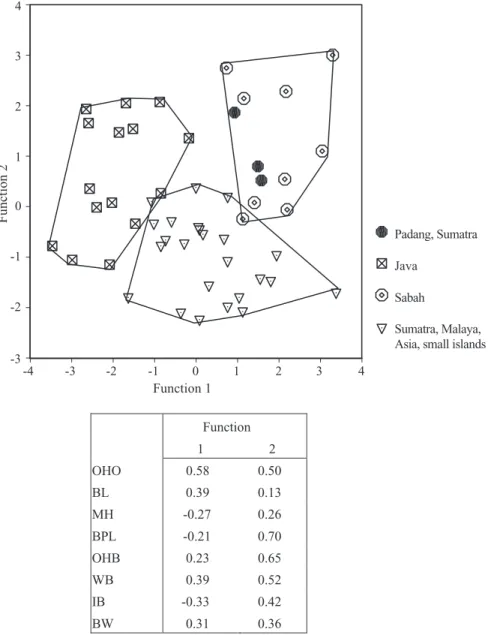
Malay islands specimens were well separated from the others. They were primarily distinguished from the other skulls by their narrow auditory bullae, and nar-row, short skulls (low value for ZW, CW, and BPL in function 2, see correlation matrix and Fig. 10). The Javan skulls were also distinguished by their narrow auditory bullae and narrow braincase, and they also have longer and higher mandibles, a character they shared to some extent with the Langkawi, Rawi, and Adang skulls. Bornean skulls had wider auditory bul-lae, a wider braincase and smaller mandibles, espe-cially those from Sabah. The specimens from Sumatra, the Malay peninsula, mainland Asia, and the small Sundaland islands were intermediate in these charac-ters (see Table 7 for an overview of the mean values). Interestingly, when we added the measurements for OHO to the analysis, and treated the Sabah specimens as a distinct group, the separation between the remaining groups increased significantly to a 94% accurate classification (N = 50), and in particular the group of specimens from Java stood out for their lack of overlap with other groups (Fig. 11). This character was only available for one of the Terutau/Langkawi specimens, and therefore it could not be used to inves-tigate the relation of T. javanicus/kanchil from these islands to others. Regardless, OHO and to a lesser extent OHB were important characters that differen-tiated between Bornean and Javan T.
javanicus/kan-chil (Fig. 11, and corresponding correlation matrix). In
Figure 11, we also show that three specimens (RML 3774, 4600, 4601) from Padang, Sumatra, consistently grouped with the Sabah specimens. When all young adult and young adult–adult specimens were added to this analysis, the three groups were still separated with an accuracy of 87.7% (N = 73).
The full implications of these results will be addressed in more detail in the Discussion section, but it is appropriate to note at this point that it would be difficult to continue to associate the Java and Sumatra/Borneo/Malay peninsula smaller mouse-deer in a single species. For the latter group, the name
T. kanchil has priority. Variation within Java
Dobroruka (1967) reported the existence of two dis-tinct subspecies of mouse-deer on Java, which he called T. j. pelandoc (from the north coast of West Java Province) and T. j. focalinus (from the western part of Java and to the southern coast). A principal component analysis of the Javan skulls revealed some grouping of specimens from the two same geo-graphical areas, especially those from central West Java and to a lesser extent those from the south coast (Fig. 12). The three specimens from the north coast, including the type locality of T. j. pelandoc as fixed by Dobroruka (1967), appeared to group with
Figure 8. Bivariate plots for reputed T. napu specimens from the small Sundaland islands.
54 52 50 48 46 44 42 40 38 36 34 32 30 28 Subi Anambas Serasan Bunguran Tioman Riau/ Lingga Bizygomatic width (mm) Width of braincase (mm) 120 11 0 100 90 80 54 52 50 48 46 44 42 Bizygomatic width (mm) Condylo-basal length (mm)
those from the south coast, where T. j. focalinus should occur. Because we had only photographed three of the 26 corresponding skins it was impossible to determine whether these two groups coincided with the subspecific characteristics of the taxa described by Dobruruka.
Variation within the Borneo, Sumatra, Malaya, Asian mainland and small Sundaland islands group
Borneo and adjacent islands. There were clear size
differences between skulls of T. kanchil from different regions of Borneo, with larger specimens occurring in
Figure 9. Map of the Terutau and Langkawi island groups west of the Malay and Thai peninsula.
Table 7. Means and standard deviations (SD) for skull measurements on adult T. javanicus and T. kanchil specimens (mm) BP ML ZW CW OHB WB MH OHO BW BL IB Borneo Mean 67.2 75.1 42.6 20.3 27.6 32.6 28.3 20.7 9.7 19.0 4.9 N 20 20 22 21 21 21 20 14 21 19 20 SD 2.5 2.7 1.7 0.9 1.1 1.3 1.8 1.0 0.6 0.8 0.7
Sumatra, Malaya, mainland, Sunda islands
Mean 65.2 73.5 42.3 19.6 26.5 31.1 28.4 19.2 8.7 18.1 4.9
N 55 54 116 55 56 56 52 29 54 54 51
SD 2.8 3.1 1.8 0.7 0.9 0.9 1.6 1.2 0.6 1.0 0.5
Langkawi, Adang and Rawi
Mean 64.6 76.4 42.8 19.1 27.3 30.6 30.1 20.0 8.4 17.8 4.9 N 8 8 9 8 8 9 9 1 8 8 8 SD 1.1 1.4 0.7 0.7 0.4 1.0 1.3 0. 0.4 1.0 0.5 Java Mean 68.1 75.8 42.3 19.9 27.2 31.2 30.0 18.8 8.6 17.5 5.7 N 21 21 21 21 21 21 19 18 19 17 19 SD 3.0 3.0 1.9 0.8 1.0 1.4 2.0 1.0 0.6 1.1 0.6
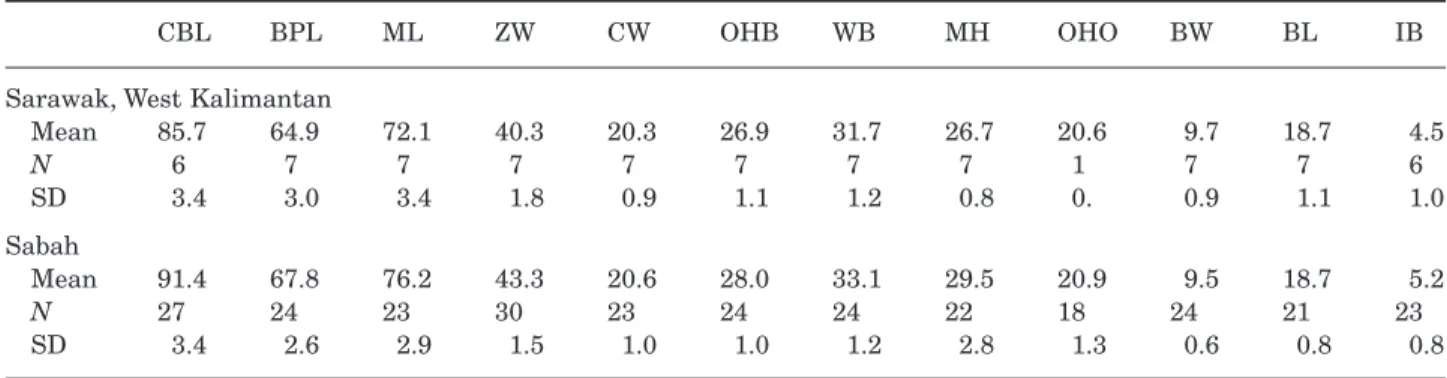
Sabah and smaller specimens in West Kalimantan and Sarawak (Table 8). In particular, the relatively wide skulls and large bullae of the Sabah specimens differentiated them from Sarawak and West Kaliman-tan specimens.
In a principal component analysis, these Sabah and Sarawak/West Kalimantan groups completely sepa-rated (Fig. 13). We used this analysis to allocate three specimens from East Kalimantan to the two different groups: one specimen (ZMA 22.824) from the area between the Sebuku and Sembakung Rivers, just south of the Sabah–East Kalimantan border, clearly grouped with the Sabah specimens, whereas two spec-imens (ZMC 08198; 08200) from the Bengen River in central East Kalimantan (0°31N, 115°53′E) grouped with the Sarawak/West Kalimantan group. In the ear-lier mentioned discriminant analysis of all Javan
T. javanicus specimens, T. kanchil from Sabah, and all
other T. kanchil specimens, the Sabah group almost completely separated from a group combining all other
T. kanchil specimens, except for three specimens from
Padang, West Sumatra (RML 3774, 4600, 4601), that consistently grouped with the Sabah specimens.
One specimen (FMNH 85912) was omitted from the analysis because it was very unusual. This specimen from Kalabakan, Tawau, Sabah, was labelled as a male, and its age determined as young adult; but it had very small (2–3 mm) canines that looked more robust than normal female canines, and its body weight was only 1500 g, as indicated on the label. Pos-sibly this was a sick animal. We were unable to study the skin and it is unclear whether this is an aberrant
specimen or something taxonomically different from the normal Sabah form.
Sumatra, Asian mainland and the Malay/Thai pen-insula. Above we have shown that T. versicolor is
dis-tinct from all T. napu taxa. When we compared all
T. kanchil subspecies of Indochina and the Malay
Peninsula with T. versicolor, it became clear that
T. versicolor was also distinct from them (Fig. 14). T. versicolor was primarily distinguished from the
oth-ers by the high value for BPL and ZW (see correlation matrix in Fig. 14).
Within T. javanicus of the Malay Peninsula and Asian mainland there was little variation in skull dimensions (Table 9). Only the type specimen of
T. k. williamsoni, from northern Thailand, stood out
by its large size. This specimen was larger than the means of all other mouse-deer from the Asian main-land and Malaya (except T. napu), whereas for most of the individual measurements it was also larger than the maximum values for the Malayan and mainland Asia T. kanchil subspecies. Neither a principal compo-nent analysis nor a discriminant analysis could mean-ingfully separate the other specimens from mainland Asia and the Malay/Thai peninsula into geographical groups. There was some differentiation between skulls assigned to T. k. fulviventer and T. k. ravus, from the south and centre of the Malay peninsula, respectively, but the two groups did not separate well in a principal component analysis. In a discriminant analysis that included specimens of T. k. fulviventer, T. k. ravus/
T. k. angustiae (grouped together because of geograph-Figure 10. Discriminant analysis of adult T. javanicus-like specimens, with corresponding correlation matrix.
Function 1 2 3 BW 0.47 0.44 0.43 BL 0.36 0.21 0.11 WB 0.34 0.37 0.36 CW 0.15 0.28 0.28 IB -0.36 0.03 0.58 BPL -0.08 0.25 0.58 OHB 0.27 -0.04 0.57 ML 0.02 -0.11 0.55 MH -0.26 -0.21 0.45 ZW 0.09 -0.10 0.44 Function 1 6 4 2 0 -2 -4 Function 2 3 2 1 0 -1 -2 -3 -4 -5
West Malay islands Sumatra, Malaya, Asia, Sunda islands Borneo
ical proximity and low number of specimens for more northerly T. k. angustiae), T. k. affinis from Indochina, and specimens from the west Malay islands (Langkawi and Rawi), the T. k. ravus specimens grouped closely with those from the west Malay islands (Fig. 15). Also, the T. k. fulviventer and T. k. affinis specimens grouped closely together. Classification accuracy was 79%. When we added the Sumatra specimens to this analysis they largely overlapped with T. k. fulviventer and T. k. ravus/T. k. angustiae.
The skins of the Malayan and mainland Asian sub-species differed to some extent. In the northern Malay/ Thai peninsula and on the Asian mainland, the upper parts were generally duller (less reddish) and less suf-fused with black than those from the southern Malay
Peninsula, which tended to be more reddish brown. Most mainland Asia specimens had vague nape streaks (or lacked them completely as in the
T. k. williamsoni specimen), whereas they were clear
in most specimens from the Malay Peninsula. The most northern specimens of the darker form origi-nated from Bang Nora, Siam (ZRC 4.4850 and 4.4851) at 6°25′60″N, but we could not identify the locality of a dark specimen from Lam Ra Trang, northern Malay peninsula (ZRC 4.4881). The most southern specimen of the lighter form probably originated from the Krabi area, assuming that this is what the label localities ‘Grahi’ and ‘Grabi’ refer to. None of the means of all measurements of the northern and southern form are significantly different.
Figure 11. Discriminant analysis of T. javanicus-like specimens, which includes the measurements for the occipital height from opisthion. Function 1 2 OHO 0.58 0.50 BL 0.39 0.13 MH -0.27 0.26 BPL -0.21 0.70 OHB 0.23 0.65 WB 0.39 0.52 IB -0.33 0.42 BW 0.31 0.36 Function 1 4 3 2 1 0 -1 -2 -3 -4 Function 2 4 3 2 1 0 -1 -2 -3 Padang, Sumatra Java Sabah Sumatra, Malaya, Asia, small islands
A principal component analysis of the Sumatran specimens did not reveal much geographical structure in the data, but this may have been because there was only one specimen from South Sumatra in the analy-sis, whereas the majority were from north Sumatra, and three specimens from west Sumatra. The one south Sumatran specimen stood out because of its wide auditory bullae and related small interbullae dis-tance, but it is unclear whether this result is of any significance.
DISCUSSION
PATTERNSOFMORPHOLOGICALVARIATIONIN MOUSE-DEER
Colour variation in mouse-deer
The subspecies of T. napu on small islands are com-monly subject to melanism. The dark lines on the
throat become darker and also broader, often leav-ing only small white spots. Also in the T. javanicus/
kanchil group there is some degree of melanism in
specimens on small islands, leading to the develop-ment of extra dark, transverse lines, which make the throat pattern hard to distinguish from that of
T. napu. Melanism is not restricted to the throat,
but the head, neck and back may also be mixed with additional black hairs. The whole neck may be black, so that a nape-stripe cannot be seen (van Dort, 1986). Often this increased blackness appears to be the result of changed banding patterns on individ-ual hairs. Whereas in the mainland type the black hair segment is located in the middle, it is located at the hair tip in some of the blacker island taxa. Also, an increased density of all-black hairs leads to greater overall blackness of the coat (see also Miller, 1903a).
Figure 12. Principal component analysis of young adult–adult and adult skulls from Java. The polygon indicates all spec-imens from central West Java.
First component 2 1 0 -1 -2 -3 Se cond component 3 2 1 0 -1 -2 c. W. Java c. W. Ja va c. W. Java c. W. Java north coast c. W. Java c. W. Java W. Java ? W. Java ? W. Java ? C. Java C. Java south coast southwest coast C. Java C. Java north coast south coast south coast south coast north coast
Table 8. Means and standard deviations (SD) for mature specimens of the Bornean T. kanchil subspecies
CBL BPL ML ZW CW OHB WB MH OHO BW BL IB
Sarawak, West Kalimantan
Mean 85.7 64.9 72.1 40.3 20.3 26.9 31.7 26.7 20.6 9.7 18.7 4.5 N 6 7 7 7 7 7 7 7 1 7 7 6 SD 3.4 3.0 3.4 1.8 0.9 1.1 1.2 0.8 0. 0.9 1.1 1.0 Sabah Mean 91.4 67.8 76.2 43.3 20.6 28.0 33.1 29.5 20.9 9.5 18.7 5.2 N 27 24 23 30 23 24 24 22 18 24 21 23 SD 3.4 2.6 2.9 1.5 1.0 1.0 1.2 2.8 1.3 0.6 0.8 0.8
On several islands, T. napu typically has a red colour (erythrism). Even the nape-stripe is red, some-what darker than the orange–red neck. The lines from the eye to nose are deep black, and the red back is mixed with black (van Dort, 1986). From studies of hair and skins and from information in the literature it appears that increased redness is the combined results of fewer all-black and black-tipped hairs in the coat, and possibly also an actual increased redness in the hair pigment.
Miller (1910) summarized these colour changes as follows. The primitive type of T. napu on the main-land has: (1) a mixed brown and black neck, the black concentrating along the nape to form an evi-dent nape stripe; (2) a normal throat pattern with a
median white longitudinal stripe, on each side of which is a similar stripe, the three meeting in a broad white mass; the space between median and lateral stripes is brown as in the side of the neck or somewhat darker; a brown transverse band or col-lar separates the stripes from the white of the chest. The two lines of variation are (1) toward nance of yellowish brown and (2) toward predomi-nance of black. As mentioned above, the colour variations in T. javanicus are less striking. Hershko-vitz (1967) provided a hypothetical explanation for these changes from the banded hair pattern to all black or all red in his theory of metachromism, and mouse-deer seem to provide a very suitable group to test this model.
Figure 13. Principal component analysis of mature T. kanchil specimens from Sabah and East Kalimantan, Sarawak and west Kalimantan, and all other mature T. kanchil specimens.
Component 1 2 BPL 0.87 -0.16 ML 0.85 -0.22 ZW 0.84 -0.23 OHB 0.75 -0.12 CW 0.70 0.09 WB 0.72 0.21 MH 0.58 -0.44 BW 0.52 0.73 BL 0.67 0.40
First component
3 2 1 0 -1 -2 -3 Second component 3 2 1 0 -1 -2 -3 -4 Sumatra, Malaya, Asia, small islandsSarawak, West Kalimantan
Sabah, East Kalimantan
Colour variation in relation to taxonomy
The melanistic and erythristic island forms have in the past been assigned to many species and some to subspecies, as it was maintained that the characteris-tic coloration was often consistent within specimens from one island. The following example indicates that colour morphs should be used with reservation in mouse-deer taxonomy. Miller (1903b) described two species on Musala, a 65-km2 island, some 15 km off
the west Sumatran coast, T. amœnus and T. jugularis. These differed mainly in their colours. T. amœnus, of which Miller saw two specimens, was yellowish, with a dark neck, closely resembling T. nigricollis from Singkep Island on the east coast of Sumatra, but with
normal throat markings, including clear white stripes. Miller (1903b) described T. jugularis as being the same size and same colours as T. amœnus, except for some differences in the underparts. T. jugularis lacked the white stripes on the throat, and there were some differences in the amount of speckling in the neck and on the cheeks. Miller especially regarded the lack of white on the throat, which he found in 17 specimens, as evidence for a distinct species. Chasen (1940) sug-gested that these two taxa represent two phases of one subspecies and assigned them both to T. j. amoenus. We agree with his conclusion, but add to this that it should be noted that many island taxa have been assigned to species level based on variation in colours
Figure 14. Principal component analysis of T. kanchil subspecies from Malaya and the Asian mainland and T. versicolor, and corresponding correlation matrix.
Component 1 2 BPL 0.88 0.06 ML 0.79 0.04 ZW 0.84 -0.21 CW 0.73 -0.26 OHB 0.58 -0.50 WB 0.73 -0.08 BW 0.47 0.74 BL 0.70 0.40 First component 3 2 1 0 -1 -2 -3 Second component 3 2 1 0 -1 -2 -3 T. versicolor T. k. fulviventer T. k. ravus T. k. angustiae T. k. williamsoni T. k. pierrei T. k. affinis
of the same type and magnitude as in the above colour morphs.
The above example raises the suggestion that colour variation in mouse-deer is regulated by relatively sim-ple genetic changes. These could express themselves in small populations that, as a result of inbreeding and genetic drift, have low levels of heterozygosity so that homozygous genotypes coding for the red/yellow and black could increase in frequency. We hypothesize that as island mouse-deer populations became iso-lated in the period following the last of the Pleistocene glacials, they experienced genetic bottlenecks. This effect would have been exacerbated by the further sea-level rises to 5 m above present day sea-sea-levels in the mid-Holocene (e.g. Tjia, 1976; Geyh, Kudrass & Streif, 1979; Thomas, Thorp & McAlister, 1999), which would especially have affected the low-lying islands by decreasing the habitable area.
An analysis of colour patterns in relation to island size supports the above hypothesis. The subspecies described from the largest islands (besides Sumatra, Java and Borneo) are those from Bangka (11 413 km2),
Belitung (4788 km2) and Nias (4048 km2). Lyon (1906)
described the two Bangka species T. bancanus and
T. luteicollis as very closely related to large and small
Sumatran mouse-deer, but brighter in the former and generally duller coloured in the latter; the T. kanchil-like T. billitonus from Belitung (see Fig. 7 for loca-tions) is quite a dark and dull coloured taxon. The colour of T. napu niasis shows no differences from that of the nominate form (Lyon, 1916). The most extreme melanistic and erythristic forms were found on islands between 100 and 400 km2, with the larger Bintang
Island (1173 km2) an exception. Interestingly, many of
the very small islands (<100 km2) had relatively low
levels of increased melanism/erythrism. The reason
Table 9. Mean skull measurements for mature specimens of T. kanchil and T. versicolor from the Asian mainland and Malay Peninsula CBL BPL ML ZW CW NL OHB WB MH OHO BW BL IB T. williamsoni Mean 94.5 69.7 77.4 45.2 20.9 29.3 28.7 33.3 21.9 9.1 19.8 5.7 N 1 1 1 1 1 1 1 1 1 1 1 1 SD – – – – – – – – – – – – T. versicolor Mean 90.5 69.7 75.7 42.9 21.2 34.3 27.2 33.7 32.7 18.2 9.1 17.9 4.6 N 2 3 3 3 3 1 3 3 3 3 3 3 3 SD 0.3 0.8 1.3 0.8 0.3 0. 0.4 0.2 1.0 0.1 0.0 0.1 0.3 T. k. ravus Mean 87.9 65.4 73.3 41.3 19.7 27.7 27.3 31.1 28.1 18.9 8.5 17.6 5.3 N 5 7 7 7 7 6 7 7 7 2 7 7 6 SD 1.4 1.6 1.2 0.6 0.4 2.1 1.0 0.9 1.6 0.6 0.5 1.2 0.6 T. k. fulviventer Mean 85.3 63.0 70.8 40.2 19.5 25.2 26.6 31.0 26.7 20.5 8.7 17.5 4.8 N 10 23 22 23 24 18 24 24 25 4 24 24 24 SD 2.4 2.4 2.5 1.2 0.7 1.8 0.8 1.0 1.3 0.7 0.5 1.0 0.5 T. k. angustiae Mean 86.1 65.9 73.0 41.3 19.6 27.0 27.1 31.1 27.7 19.7 8.3 18.4 5.0 N 3 4 4 4 4 4 4 4 4 3 4 4 4 SD 1.6 2.4 2.1 0.8 0.9 1.7 0.6 0.6 1.0 0.6 0.4 1.2 0.2 T. k. affinis Mean 86.0 62.4 70.5 40.7 20.1 26.5 26.3 31.0 27.7 18.2 8.4 17.1 5.2 N 9 14 15 14 13 14 14 14 12 6 14 14 13 SD 3.8 3.1 3.5 1.1 0.8 2.7 1.2 1.2 1.8 1.0 0.4 1.1 0.6 T. k. pierrei Mean 83.6 61.8 71.1 40.2 19.4 25.8 25.6 30.2 28.2 18.0 8.5 16.5 4.7 N 2 2 2 2 2 2 2 2 2 2 2 2 2 SD 2.2 2.1 0.8 0.7 0.4 2.5 0.1 0.6 0.7 1.1 0.6 0.0 0.1
for this is unclear, but it is possible that these islands have only recently been colonized or that mouse-deer have been introduced by people. Also, the very small sizes of these islands would increase extinction prob-ability and make it more likely that the islands had been recently colonized.
The relationship between body size and island area
During the research we became aware that body size of both T. javanicus and T. napu varied considerably
between islands. Different body sizes have often been used to assign island taxa to new species or subspecies and it is therefore important to investigate whether body size is determined by genetic characters or whether its is the result of phenotypic plasticity. To do this we charted the mean total length (as reported in the literature) of various species and subspecies (including both males and females) against the size of the island on which they occurred (Fig. 16). In T. napu the variation in body size is explained for 66.5% by the
Figure 15. Discriminant analysis of non-juvenile specimens of T. kanchil from the Malay peninsula, the Asian mainland and the islands west of the Malay peninsula, with corresponding correlation matrix.
Function 1 2 ML 0.59 -0.18 ZW 0.28 -0.19 OHB 0.22 0.11 MH 0.30 -0.53 BL 0.05 0.22 BW -0.19 0.07 WB -0.16 0.26 IB 0.10 -0.01 BPL 0.31 0.24 CW -0.20 -0.12 Function 1 4 2 0 -2 -4 Function 2 3 2 1 0 -1 -2 -3 T. k. fulviventer T. k. ravus/ T. k. angustiae T. k. ravulus/ T.k. lancavensis T. k. affinis
size of the island on which a taxon occurs (Fig. 16). In
T. javanicus, however, there is hardly any correlation
between the two factors. We do not have enough knowledge regarding the ecological differences between the two species to hypothesize on the cause of this size phenomenon. An anonymous reviewer has suggested the following intriguing explanation: ‘It could be that mainland napu is the larger of a pair of species and holds javanicus in check. When napu becomes confined on islands its size diminishes, but
javanicus is already smaller, so the island effect has
less scope to show itself ’.
TAXONOMICDISTINCTIONSBASEDONTHE CRANIOMETRICALRESULTS
The results of craniometrical analyses suggest that the Asian Tragulidae can be separated into three species groups: (1) T. napu-group; (2) T. javanicus/
kanchil-group; and (3) T. versicolor. Within the T. napu-group there appear to be two distinct species: T. napu s.s. and T. nigricans. Within the T.
javanicus-group there appear to be three distinct species:
T. javanicus, T. kanchil, and T. williamsoni. Below we
suggest a new taxonomy of Asian mouse-deer at spe-cies level based on the results of the metrical skull analysis.
T. napu
This species was readily differentiated from members of the T. javanicus/kanchil group by its larger size, rel-atively small auditory bullae (possibly, as suggested to us by an anonymous reviewer, an effect of negative allometry) and, in most specimens, the distinct coat coloration. Within this species, three geographical groups emerged, none of which was distinct enough to be assigned to species level.
The analysis of skull measurements suggested that
T. napu-like mouse-deer from the small Sundaland
islands cannot be completely separated from the nom-inate form from Sumatra, Malaya, and Borneo. The analysis of skin patterns and colours separated these island specimens from the mainland specimens based on increased levels of erythrism and melanism, a char-acter, however, that they share with other island taxa and with some specimens from the mainland. We therefore suggest assigning all Sunda Shelf island taxa to subspecies of T. napu, apart from those that deviate significantly from the common characteristics. Below we will discuss the descriptions of the individ-ual taxa.
T. versicolor
The craniometrical results clearly show that this species from southern Vietnam is distinct from both
T. javanicus and T. napu, and so far from being a
subspecies of T. napu as conventionally regarded, it cannot even be convincingly allocated to either of the two widespread species-groups. In addition, skin coloration pattern and roughness of neck hair are unlike any other mouse-deer that we have seen.
T. nigricans
The results of the statistical comparison between the Balabac specimens and the nominate form T. napu
napu confirm that this taxon is diagnosably distinct. It
also differs significantly from T. javanicus. We there-fore recommend that this taxon should be reassigned to a separate species, Tragulus nigricans Thomas, 1892.
T. javanicus
Statistical analysis of skull form suggests that the
javanicus-like mouse-deer of Borneo, Sumatra, Java,
Malaya, and the Asian mainland can be separated into three distinct groups, of which the Javan group did not overlap at all with the others. Together with its unique coloration (see below for detailed discus-sion), this sets aside the Javan taxon as a distinct spe-cies. In the Introduction we argued that T. javanicus Gmelin, 1788 is the appropriate name for the Javan taxon.
T. kanchil
Having separated T. javanicus as a species peculiar to Java, the next available name for the remaining mouse-deer, including those from Sumatra, is
T. kanchil Raffles, 1822.
Within T. kanchil, the Borneo group was reasonably well separated from the group containing Sumatran, small Sundaland islands, Malayan, and mainland Asian specimens, but not completely. The Bornean
Figure 16. The relationship between log10 island area and
body size in T. javanicus (lower regression line) and T. napu (upper regression line).
y = 26.5x+ 498 R2= 0. 665 y = 8. 6x + 492 R2= 0.0801 400 450 500 550 600 650 700 Body size (mm)
log10 of island size