Journal of Antimicrobial Chemotherapy (1985) 15, Suppl. A, 169-173
Computer-controlled in-vitro simulation of multiple dosing regimens
B. Ledergerber, J. Blaser and R. LutfayDivision of Infections Diseases, Department of Medicine, University Hospital Zurich, CH-8091 Zurich, Switzerland
The bactericidal effect of gentarrucin on Pseudomonas aerugwosa ATCC 27853 was investigated in a computer controlled dynamic in-vitro model, which allows the simultaneous simulation of three different dosing regimens for several days. The same total dose reduced cfu-counts of Pseudomonas aerugmosa most effectively, when administered with peak concentrations of 32 mg/1 every 32 h, whereas the other dosing regimens with peak concentrations of 16 mg/1 every 16 h and 8 mg/1 every 8 h were distinctly less effective following the second and subsequent doses. It was shown that the use of a microcomputer facilitates the in-vitro investigation of multiple dosing regimens but counting of cfu cannot be substituted by automatic measurements of turbidity when rapid bactericidal effects occur.
Introduction
With few exceptions, such as gonorrhoea or uncomplicated urinary tract infections, the treatment of infectious diseases requires administration of antibiotics in multiple doses for several days. It therefore seems appropriate to perform m-vitro investigations of multiple dosing regimens which can yield important information concerning the bactericidal or bactenostatic action of the second or subsequent doses and the possibility of emerging resistance, phenomena which escape the m-vitro studies of single doses.
The use of a microprocessor with the capacity to control simultaneously multiple independent sets facilitates the performance of long-term experiments and improves their reproducibility. The feedback of certain data to the computer offers additional advantages such as (i) information concerning the actual state of the experiment by displaying and recording turbidity data which can be used as a guideline for diluting the samples for cfu-determinations and (li) maintenance of constant pharmacokinetic conditions by verification of liquid levels.
Turbidity data can further be used to initiate automatically active intervention in an experiment, e.g. when lack of action of a drug is detected
The purpose of the present study was to prove the feasibility of the computer controlled in-vitro model to determine the effect of three different multiple dosing regimens of gentamicin on the viable counts of Pseudomonas aeruginosa.
Materials and methods
Media
Mueller-Hinton broth (MHB) and Mueller-Hinton agar (MHA) were obtained from Difco (Brunschwig AG, Basel, Switzerland). MHB was supplemented with M g+ + and
C a+ + (MHB-S) according to NCCLS standards (1983). 169
Antibiotics
Gentamicin laboratory reference powder was obtained from Schering (Essex Chemie, Luzern, Switzerland).
Bacterial strain
Log-phase cultures of Ps. aeruginosa ATCC 27853 were photometrically adjusted by
diluting them with MHB-S to yield a final inoculum of 105 cfu/ml. Glass flasks
(volume 125 ml) were filled with 100 ml of the bacterial suspension. The minimal inhibitory concentration (MIC) of gentamicin in MHB-S was 20 mg/1.
Viable counts of bacteria
To detect > 100 cfu/ml, three drops of 20 fi\, each from appropriate tubes of serial ten-fold dilutions, were plated on MHA. Less than 100 cfu/ml were quantified by membrane filtration of 1 ml and 10 ml of undiluted samples, yielding a sensitivity of 0-5 cfu/ml. Filters were washed with 100 ml of 0-9% NaCl in water to eliminate residual drug and placed on MHA. Viable counts were not adjusted for the loss which occurred through the dilution with drug free broth.
Simulation of multiple dosing regimens
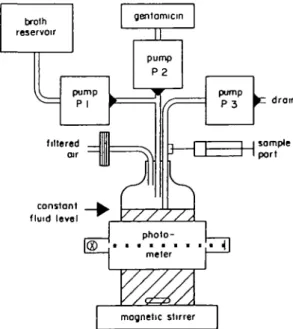
The in-vitro model (designated apparatus model I) described by Grasso et al. (1978) was modified by adding a second peristaltic pump which drained the culture flask and thereby maintained a constant fluid level (Figure 1, pump 3). In addition, this pump
broth reservoir
I
pumpP 1 (c dram
Figure 1. Single set of the in-ntro model. Pump speed of pump PI was adjusted to produce the desired elimination half-life, whereas pump P3 (drain) was suctioning at a higher flow rate to maintain the constant volume and to provide the ventilation of the head space with filtered air (pore size: 0-2 /an). Pump P2 was operated according to the dosage regimens.
Computer-controlled in-vitro model 171
irtJtor prtattr (tiaJi
t
I
rad-lli dockT
microcomputer IZ c process-interface 220VlwiKwJ 3.1 Ml tapm iiiiir r
ONI n Wl i / D -| olog wpwi-TTT *ok*m-co<tfroto mognttfc ttlrrtr ; Ycontrol of three m-vitro sets
Figure 2. Diagram of the computer system The process interface was designed to control simultaneously
three m-vilro sets as shown in Figure 1
provided continuous ventilation of the head space of the culture flask through a port for filtered air which allowed aerobic growth conditions. Three sets of the in-vitro model were simultaneously operated in an incubator at a temperature of 370°C, simulating three multiple dosing regimens (A, B and C) with identical total doses, which produced peak gentamicin concentrations of 8, 16 and 32 mg/1 at dosage intervals of 8, 16 and 32 h, respectively. The infusion periods were 30 min each. Human one-compartment pharmacokinetics with an elimination half-life of 2-2 h were simulated by continuous dilution with drug free broth.
Turbidimetry
Three photometers were built with extra-bright light-emitting diodes, wave-length 660 nm (Stanley ESBR 5501, Dewald AG, Zurich, Switzerland), matched pairs of photodiodes (United Detector Technology PIN-3DP, Traco AG, Zurich, Switzerland) and a log ratio amplifier (LOG 100, Burr-Brown AG, Ruschlikon, Switzerland) providing a compensated operation with a threshold for the detection of > 200,000 cfu/ml. Turbidity was measured in each culture flask over a path length of 4-6 cm and recorded on the disc of the computer at 5 min intervals.
Computer control
An Apple II® plus computer (Apple Computer Inc., Cupertino, California), supplied with a specially designed interface was used to control simultaneously three sets of the
in-vitro model as shown in Figure 2.
Results
Multiple dosing regimens
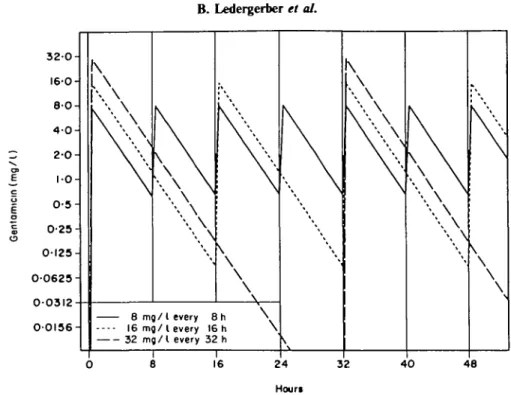
The gentamicin concentration versus time curves for the three different dosing regimens are displayed in Figure 3. The resulting viable counts and optical density
320- 16-0- 80- 40- 20- 1-0- 0-5- 0-25- 01250 01250 6 2 5 -00312 00156-8 m g / l every 00156-8h 16 mg/ I every 16 h 32 m g / l every 32 h I 16 —t 24 Houri
Figure 3. Concentration versus time curves of the three gentamian dosing regimens A, B and C with an
identical total dose yielding peak concentrations of 8, 16 and 32 mg/l at intervals of 8, 16 and 32 h, respectively 8 mg/l every 8 h * 16 mg/l every 16 h o 3 2 m g / l every32 h 48 Hours 001 00001
Figure 4. Cfu and turbidity versus time curves of Ps aeruginosa ATCC 27853, exposed to the three dosing
regimens of gentamian which are displayed in Figure 3 The photometers, operated at 660 nm, yielded a threshold of the detection of > 200,000 cfu/ml
Computer-controlled in-vitro model 173
versus time curves (Figure 4) show a rapid and dose dependent decline after the first dose, followed by regrowth within 4 to 8 h. Apart from a slight reduction of cfu at 24 h, the subsequent doses of regimen A (8 mg/1 peak concentrations every 8 h) showed no apparent bactericidal activity. The second and third dose of regimen B, yielding a peak concentration of 16 mg/1 at 16 and 32 h were marginally effective, and at 48 h, the effect of the fourth dose was completely lacking. This is in contrast to the obvious bactericidal effect of the second dose of regimen C (32 mg/1 peak concentration) at 32 h which resulted in a decrease of approximately 4 log cfu, comparable to the effect of the first dose.
Turbidity versus time curves showed a good correlation with the cfu-counts when growth occurred. In periods of rapid bactericidal action (e.g. regimen C at 32 h), turbidity was determined by the washout of dead bacteria through dilution with drug free broth and deviated markedly from the determinations of viable counts.
Discussion
The effect of multiple doses of gentamicin on Ps. aerugmosa ATCC 27853 was studied in a computer controlled in-vitro model. It was demonstrated that identical total doses of gentamicin were most effective, when administered at intervals of 32 h. Although the concentration of gentamicin for that regimen (C) was below the MIC for approximately 3/4 of the dosage interval, cfu's did not exceed the counts observed with regimen A within the first 24 h. Indeed, the long period of subinhibitory concentrations may be the reason for the retained bactericidal action of the second dose.
The on-line measurement of turbidity showed a good correlation with > 200,000 cfu/ml as long as growth occurred and was very useful as a guideline for diluting the samples for cfu-determinations. Due to insufficient sensitivity and the inability to quantify rapid bactericidal effects, as observed with aminoglycosides, the substitution of cfu-counts by turbidity measurements is not advisable.
The use of a microcomputer was a time-saving and reliable method to simulate multiple dosing regimens for several days. Limitations in simultaneously performing multiple dosing regimens were found to be the processing of samples, increasing number of pumps and space in the incubator.
Further development of the model includes the analogue control of pump speeds to simulate combination therapies of drugs with different half-lives and the automatic use of turbidity data to evaluate optimal timing of synergistic combinations.
References
Grasso, S, Meinardi, G., Carnen, I. & Tamassia, V. (1978). New in vitro model to study the effect of antibiotic concentration and rate of elimination on antibacterial activity Antimicrobial Agents and Chemotherapy 13, 570-6
Tentative Standard. (1983). Methods for dilution antimicrobial susceptibility tests for bacteria that grow aerobically National Committee for Clinical Laboratory Standards, Villanova, Pa