HAL Id: cea-02464528
https://hal-cea.archives-ouvertes.fr/cea-02464528
Submitted on 3 Feb 2020
HAL is a multi-disciplinary open access
archive for the deposit and dissemination of
sci-entific research documents, whether they are
pub-lished or not. The documents may come from
teaching and research institutions in France or
abroad, or from public or private research centers.
L’archive ouverte pluridisciplinaire HAL, est
destinée au dépôt et à la diffusion de documents
scientifiques de niveau recherche, publiés ou non,
émanant des établissements d’enseignement et de
recherche français ou étrangers, des laboratoires
publics ou privés.
General Guidelines for Sample Preparation Strategies in
HR-µMAS NMR-based Metabolomics of Microscopic
Specimens
Covadonga Lucas-Torres, Thierry Bernard, Gaspard Huber, Patrick Berthault,
Yusuke Nishiyama, Pancham Kandiyal, Bénédicte Elena-Herrmann, Laurent
Molin, Florence Solari, Anne-Karine Bouzier-Sore, et al.
To cite this version:
Covadonga Lucas-Torres, Thierry Bernard, Gaspard Huber, Patrick Berthault, Yusuke Nishiyama, et
al.. General Guidelines for Sample Preparation Strategies in HR-µMAS NMR-based Metabolomics
of Microscopic Specimens. Metabolites, MDPI, 2020, 10 (2), pp.54. �10.3390/metabo10020054�.
�cea-02464528�
Metabolites 2020, 10, 54; doi:10.3390/metabo10020054 www.mdpi.com/journal/metabolites Article
General Guidelines for Sample Preparation Strategies
in HR‐μMAS NMR‐based Metabolomics of
Microscopic Specimens
Covadonga Lucas‐Torres 1,*, Thierry Bernard 1, Gaspard Huber 1, Patrick Berthault 1, Yusuke Nishiyama 2,3, Pancham S. Kandiyal 4, Bénédicte Elena‐Herrmann 4, Laurent Molin 5, Florence Solari 5, Anne‐Karine Bouzier‐Sore 6 and Alan Wong 1,*
1 NIMBE, CEA, CNRS, Université Paris‐Saclay, CEA Saclay 91191 Gif‐sur‐Yvette, France; thierry.bernard@cea.fr (T.B.); gaspard.huber@cea.fr (G.H.); patrick.berthault@cea.fr (P.B.); alan.wong@cea.fr (A.W.) 2 JEOL RESONANCE Inc., Musashino, Akishima, Tokyo 196‐8558, Japan; yunishiy@jeol.co.jp 3 RIKEN‐JEOL Collaboration Center, Yokohama, Kanagawa 230‐0045, Japan 4 Univ Grenoble Alpes, CNRS, INSERM, IAB, Allée des Alpes, 38000 Grenoble, France; pancham‐singh.kandiyal@univ‐grenoble‐alpes.fr (P.S.K.); benedicte.elena@univ‐grenoble‐alpes.fr (B.E.‐H.) 5 Univ Lyon, Université Claude Bernard Lyon 1, CNRS UMR 5310, INSERM U 1217, Institut NeuroMyoGène, Lyon, France; laurent.molin@univ‐lyon1.fr (L.M.); florence.solari@univ‐lyon1.fr. (F.S.) 6 Centre de Résonance Magnétique des Systèmes Biologiques, CNRS‐Université de Bordeaux, UMR5536 Bordeaux, France; anne‐karine.bouzier‐sore@rmsb.u‐bordeaux.fr * Correspondence: Covadonga.Lperez@gmail.com (C.L.‐T.); alan.wong@cea.fr (A.W.) Received: 16 December 2019; Accepted: 28 January 2020; Published: 30 January 2020 Abstract: The study of the metabolome within tissues, organisms, cells or biofluids can be carried out by several bioanalytical techniques. Among them, nuclear magnetic resonance (NMR) is one of the principal spectroscopic methods. This is due to a sample rotation technique, high‐resolution magic angle spinning (HR‐MAS), which targets the analysis of heterogeneous specimens with a bulk sample mass from 5 to 10 mg. Recently, a new approach, high‐resolution micro‐magic angle spinning (HR‐μMAS), has been introduced. It opens, for the first time, the possibility of investigating microscopic specimens (<500 μg) with NMR spectroscopy, strengthening the concept of homogeneous sampling in a heterogeneous specimen. As in all bioanalytical approaches, a clean and reliable sample preparation strategy is a significant component in designing metabolomics (or ‐omics, in general) studies. The sample preparation for HR‐μMAS is consequentially complicated by the μg‐scale specimen and has yet to be addressed. This report details the strategies for three specimen types: biofluids, fluid matrices and tissues. It also provides the basis for designing future μMAS NMR studies of microscopic specimens.
Keywords: high‐resolution magic angle spinning; NMR; microscopic samples; metabolomics; sample preparation
1. Introduction
Sample preparation is an essential component in metabolomics [1,2]. It requires dedication in designing protocols for precise and reliable acquisition of data with the appropriate analytical platform (i.e., gas (GC) [3] or liquid (LC) chromatography [4], mass spectrometry (MS) [5,6] and nuclear magnetic resonance (NMR) [7,8]). In any case, incorporating a convenient and reliable strategy is of underlying importance for avoiding any metabolic loss, for ensuring reproducibility and for the valid biological interpretation of the data [9,10].
NMR spectroscopy has been present in the development of metabolomics for decades. Strategies for sample preparations for both the standard high‐resolution liquid [7] and high‐resolution magic angle spinning (HR‐MAS) [11] NMR are well documented and established. The fundamental basis is to minimize the sample exposure to unfavorable conditions (such as contamination, temperature, time, etc.) during the preparation so as to preserve sample integrity and experimental reproducibility. In general, the procedure is straightforward. For example, in HR‐MAS with a Bruker 4 mm rotor, it consists of introducing the mg (or μL) level of a sample into a Kel‐F bio‐insert (Figure 1a) by either a pipette or a biopsy punch, depending on the sample morphology (liquid or semi‐solid); if necessary, this is followed by adding sufficient D2O (or buffer) to
homogenize the content for high‐quality data acquisition; and lastly, the insert and the rotor are sealed with the corresponding use of dedicated toolsets (Figure 1). The entire procedure takes about 5–10 min [11–15].
Recently, a new NMR technology, high‐resolution micro‐magic angle spinning (HR‐μMAS), was introduced [16]. It targets the microgram (μg) level of specimens and has shown promising results towards metabolomics [17,18]. HR‐μMAS could open a new and unexplored NMR platform [19], such as the possibility of carrying out longitudinal metabolic investigation on living animals. This contributes to the fact that μg scale analysis permits (1) minimal surgical tissue excision and (2) homogenous sampling from a heterogeneous specimen. However, the sample preparation for HR‐μMAS NMR spectroscopy (i.e., with a 1 mm μ‐rotor) is a strenuous task [19] compared to the mg sampling with HR‐MAS (i.e., 4 mm rotor). As trivial as it may seem at first glance, handling delicate specimens at the μg level requires high precision skills and tools. One has to consider that displacing such a minuscule sample mass (<500 μg) in a confined volume (<500 nL), in a clean and efficient manner, creates an inevitable difference with HR‐MAS. Moreover, unlike HR‐MAS, different sample morphologies also require different strategies with different toolsets, constituting additional steps for HR‐μMAS.
Presently, the sample preparation for HR‐μMAS has yet to be fully described and documented. The main bottleneck lies in the necessary requirements, namely methodical sample collection, feasible sample filling and quick μ‐rotor sealing. Few attempts have been made to simplify the preparation of μMAS for metabolomics [20–22]. One example is the use of a 1 mm disposable Kel‐F μ‐rotor along with the concept of sampling insert (i.e. a 4 mm Kel‐F bioinsert) using a glass capillary [20]. The intent is to facilitate the sample filling and eliminate the rotor sealing. However, the overall procedure is not efficient due to the limitations of handling a non‐rigid Kel‐F rotor. Moreover, the use of an insert lowers the filling factor and, hence, lowers the detection sensitivity by, in this case, nearly one‐third. In addition, this approach presents a high risk of damaging the MAS stator due to the spinning of a fragile glass capillary insert. As such, new strategies must be explored and attuned to metabolomics studies. After over 500 sample preparations in a span of two years with μ‐rotor, this report summarizes these experiences and outlines the general preparation strategies for different specimens targeting to HR‐μMAS NMR metabolomics. The strategies adopt three principal criteria: (1) rapid and clean sampling, (2) direct, clean and consistent sample filling and (3) quick μ‐rotor sealing. Although the guidelines herein are based on a JEOL 1 mm μ‐rotor, the strategies could provide the basis for designing new procedures for metabolomics studies including with μ‐rotors from other manufacturers.
2. HR‐μMAS Sample Preparation
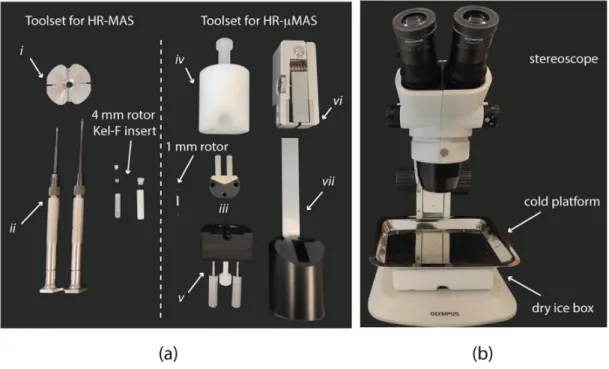
As an initial and major modification from HR‐MAS, all manipulations with both the sample and the μ‐rotor are carried out under a stereomicroscope (Figure 1b) with a large set of high‐precision tools (Figure 1a), each with a specific function. For example, a holder (Figure 1a, iii) facilitates all manipulations of the μ‐rotor and is an essential tool in all sample filling procedures described below. The use of a holder also prevents a constant contamination on the rotor surface. Specific toolsets are dedicated for closing (Figure 1a, iv and 1a, v) and opening (Figure 1a, vi and 1a, vii) the μ‐rotor caps. Since there are different toolset designs for different μ‐rotors (e.g., Bruker,
Metabolites 2020, 10, 54 3 of 10
JEOL, etc.), the report will omit the descriptions of operating the tools. Formal training from the vendor is recommended.
Figure 1. (a) Toolsets for (left) high‐resolution magic angle spinning (HR‐MAS) sample preparation compared to (right) high‐resolution micro‐magic angle spinning (HR‐μMAS) with details of ZrO2 rotor of different sizes and packing tools. (i) Clamp tool for opening the rotor cap, (ii) screw drivers for handling Kel‐F insert, (iii) μ‐rotor holder, (iv) and (v) toolset for closing the μ‐rotor caps, (vi) and (vii) toolset for opening the μ‐rotor caps. (b) Cold workstation and stereomicroscope. A dry ice bucket is placed under a metallic platform, which will be consequently cooled down for allocating the sample manipulations with the μ‐rotor under the stereomicroscope.
Due to the small sample volume, <500 nL, even the tiniest contamination is in line with the sample metabolic content. As a result, the unwanted signals will inevitably disrupt the metabolic spectral profile. Therefore, prior to the sample preparation, special attention to the cleanness of the rotor, the toolsets (i.e., contact with the rotor) and even the working space entirely is essential. Supplementary Materials Figure S1 shows an example of a contamination from a cleaning solvent, ethanol, even after a long drying period. Tips: (1) It is strongly recommended to avoid using solvent other than water for cleaning (i.e., rotor, toolsets, workspace); (2) sonicating the μ‐rotor in a warm water bath is recommended to assist in eliminating the tiniest residues.
2.1. μg Sampling
As aforementioned, ensuring the sample integrity is crucial [10], and therefore preconditions must be regulated. For example, the time for the samples to be exposed to an unfavorable temperature must be short. Therefore, the availability of dry ice during all procedures is important. While working with the stereomicroscope, one of the complications, the use of a cold platform (Figure 1b) is highly recommended for carrying out the entire sample preparation for keeping the specimens under a favorable environment. Ideally, the entire procedure from sampling to filling would be better performed inside a walk‐in cold room facility.
Prior to μg sampling, specific preconditions must be considered for different specimens. For example, intact cells are generally susceptible to their surroundings, and the permeability of the membrane should be considered. In that sense, the pH should be controlled using a buffer [23], as well as the cell concentration in the suspensions; it should be efficient for spectral sensitivity but
avoiding a crowding effect causing cell asphyxiation or rupture [24]. In addition, cells are particularly sensitive to the changes in temperature, so the freeze/thawing cycles have to be avoided as the formation of ice crystals will damage the cell membrane [25].
For animal tissues, the presence of excessive blood content distorts spectral resolution due to the existence of paramagnetic species [11]. Unlike in HR‐MAS, even a very small content of blood in a 500 μg sample could render a significant paramagnetic effect on the spectrum. Therefore, it is
advised to wash the tissue with D2O or saline solution (0.9% NaCl w/v) prior to filling. However,
caution must be applied to prevent removal of the metabolic content. We recommend a swift immersion into a deuterated saline solution. Depending on the sample morphologies, the μg sampling procedure is performed either by a pipette for biofluids or fluid matrices (i.e., intact specimens suspended in a liquid) or by a microsized biopsy punch for tissues. Tips: (1) With a pipette, it is recommended to use a micropipette tip with hydrophilic surface (ideally with glass) to avoid surface tensions with the individual specimens; (2) with a microbiopsy punch, it is recommended to cool down the tip to prevent a complete thawing of the tissue during the collection and transferring. 2.2. Sample Filling
The sample filling procedure can be considered the most significant step in the sample preparation. This is because of its extensive manipulation of the sample. Unfortunately, it is not straightforward to fill μg specimens into a tiny rotor (with a 0.5 mm inner diameter). It should comply with the following criteria: (1) a good sample homogeneity inside the μ‐rotor to achieve high spectral resolution data (i.e., avoiding the presence of air bubbles). For example, the tiniest air pocket can worsen the spectral resolution; (2) a correct sample displacement inside the μ‐rotor for maximum sensitivity detection; (3) a sufficient sample mass to achieve a good sensitivity; (4) a good weight balance of the μ‐rotor to avoid spinning deficiency; and (5) a repeatable sampling procedure for data reproducibility. Subtle deviations in all these criteria could affect the individual spectral data and diminish both the data repeatability and reproducibility. What follows are the details of three strategies, each with different toolsets targeting different specimens.
2.2.1. Micropipette or Microsyringe
Target samples: biofluids such as serum, plasma, urine and tissue extract.
Pipette tip/fine‐needle characteristics: both must be narrow in diameter (i.e., < 0.5 mm) to be able to traverse through the entire μ‐rotor length (e.g., Eppendorf GELoader® tips, Hilgenberg glass needles).
μ‐rotor requirements: one closed end (i.e., one end is open while the other is closed with a μ‐rotor cap). Guidelines: o Convey 1–2 μL of fluid inside the μ‐rotor by placing the tip (or needle) at the bottom. Tip: the μ‐rotor is placed in the holder (Figure 1a, iii) to facilitate the handling. o Release the fluid slowly while moving upwards to avoid air bubbles. o Centrifuge (~3000 rpm, ~30 s; recommended at 4 °C) the filled μ‐rotor to ensure the exclusion of air bubbles.
o Seal the μ‐rotor with a designated μ‐rotor cap using the dedicated toolset (e.g., Figure 1a). Caution: Ensure a sufficient space for the sealing; if not, the sealing would be impossible. Estimated time: 5–10 min.
2.2.2. Centrifugal Microfunnel
Target samples: fluid matrix samples such as cells or whole organisms in biofluids (e.g., blood, nematode and microbe).
Metabolites 2020, 10, 54 5 of 10
Funnel characteristics: biocompatible material (ideally with glass or parylene coating, etc.). Caution: The surface must be smooth and hydrophilic to prevent sample shearing, and to assist the transference into the μ‐rotor. μ‐rotor requirement: one closed end. Guidelines (based on a 3D‐printed microfunnel shown in Figure 2a): o Place the μ‐rotor inside the designated space in the funnel. o Convey (by either pipette or glass syringe) the matrix into the funnel reservoir. o Centrifuge at 4 °C. The speed and time depend on the funnel materials (polymers such as Kel‐F and Teflon allow for faster centrifugation, while glass will only tolerate a gentle centrifugation). o Close the μ‐rotor. Estimated time: 10–15 min. 2.2.3. Microbiopsy Punch Target samples: semi‐solids such as animal and food tissues, or cell pellets. Punch characteristics: sharp edges for clean‐cut and reproducibility. The outer diameter must be smaller than or equal to the inner diameter of the μ‐rotor (i.e., <0.5 mm, examples in Figure 2b). μ‐rotor requirements: Both ends must be opened to prevent the effect of the air pressure during the filling. Guidelines: o Extract μg sample by punching. Tip: Frozen samples facilitate a clean excision. o Fast transfer of the excised sample into the μ‐rotor (placed in a holder).
o Follow by adding a drop of D2O (or buffer) into the sample to homogenize and to avoid
dehydration. Note: Water content in the sample can have a large effect on the spectral quality (Supplementary Materials Figure S2). o Close one end of the μ‐rotor followed by a gentle centrifugation (~1500 rpm, ~30 s, at 4 °C) for sample positioning and releasing air bubbles. o Fill the remaining μ‐rotor volume with D2O or buffer. Tip: Use the holder. o A second centrifugation should be applied to further homogenize the sample. o Close the μ‐rotor. Estimated time: 15–20 min. Figure 2. (a) (i) 3D‐printed funnel. It consists of a bulk polymeric funnel, which leaves a space for the μ‐rotor, and a μ‐channel connecting the rotor volume with the sample reservoir. After printing, the funnel should be submitted to a coating process with deposited poly(p‐xylylene) (i.e., parylene), which adds a layer of 0.5 μm and generates a biocompatible and smoother surface. (ii) Custom‐made glass funnel. It connects the funnel reservoir with the μ‐rotor through a short channel. Suggested
convenient dimensions are shown in the picture for both types of funnel. (b) Different biopsy punch models. (i) 2 mm biopsy punch used for sample collection and filling process inside the standard HR‐MAS Kel‐F insert. (ii) Disposable and (iii) reusable 0.5 mm biopsy punch fitting the inner diameter of the μ‐rotor for HR‐μMAS to facilitate the filling process.
2.3. Pre‐Acquisition Considerations
After the sample filling, a few critical precautions must be applied prior to inserting the μ‐rotor into the probe. Under the stereomicroscope, one must carefully inspect the μ‐rotor caps to see if they are in good condition (i.e., no sign of damage) to ensure a good and stable sample spinning, and that the caps are tightly fit and secure in the μ‐rotor to prevent sample leakage. In addition, the cleanliness on the rotor surface is absolute; any tiny particles (i.e., dried sample residue, dust, etc.) could damage the stator. Hence, for the same reason, it is advised to clean the entire μ‐rotor surface, including the caps, with high‐quality tissue (e.g., Kimtech wipe) and/or with sticky pens (e.g., standard JEOL RESONANCE Inc. preparation tool set, Supplementary Materials Figure S3) prior to displacing the μ‐rotor into the stator.
Once the μ‐rotor is introduced in the stator, sample spinning must proceed with caution. A manual adjustment to the desired spinning frequency is recommended. Typical spinning rates ranging from 4 to 6 kHz are sufficient to suppress the susceptibility broadening in MAS NMR spectra of semi‐solids such as tissues and cells [11]. Such moderate rate prevents the sample temperature from increasing and provides adequate conditions during the data acquisition. As an example, Figure 3 shows excellent spectral quality from a spinning rate of 4 kHz. The spinning side‐bands are displaced outside the metabolites’ chemical shift range, and the metabolic isotropic signals are with good resolution.
2H‐field locking can be difficult due to the low 2H content in the sample volume; the signal is
often weak and unreliable for field shimming. Consequently, the strategy of field shimming with HR‐μMAS is different to that with HR‐MAS. Despite the applied MAS shim sets being the same [26], the metabolic signals are generally weak with HR‐μMAS to shim with a continuous acquisition; therefore, it is recommended to shim first on the water signal with continuous mode, followed by an incremental acquisition on metabolic signals. Consequently, the shimming can be a long and demanding process; hence, the use of sacrificed sample(s) is strongly recommended. One can also consider adding a small content of a known metabolite (e.g., <1 mM alanine, sucrose) in the sacrificed sample rendering a shimming process with a continuous acquisition. Supplementary Materials Figure S4 shows the resultant signals of the metabolic additive used for shimming.
Provided the sample filling into a μ‐rotor is identical, then the same shim set of the sacrificed sample can be applied, with minor adjustments. However, one should note that a slight deviation in the sample filling, resulting in an air pocket or insufficient water content, can deviate the shims from a sacrificed sample.
The experimental parameters used in the spectral acquisitions are no different with the standard NMR experiments, except with one exception: the power level for a 90° pulse is low owing to the high B1 efficiency with a μ‐size coil.
Figure 3 shows the resultant NMR spectra of different specimens (biofluid, cell matrix, small organism and animal tissue), each prepared by the different strategies described above. The details of the preparations are summarized in the Supplementary Materials (Protocol S1) and should provide the basis for future metabolomic studies with HR‐μMAS or with μMAS in general.
Metabolites 2020, 10, 54 7 of 10
Figure 3. 1H HR‐μMAS nuclear magnetic resonance (NMR) spectra spinning at 4 kHz from (a) rat urine in PBS/D2O prepared with automatic pipette, (b) 400 nL K562 cell suspension in PBS/D2O buffer (pH = 7.4) prepared with a 3D‐printed funnel, (c) 400 nL of C. elegans (n = 30) suspension in D2O prepared with a custom‐made glass funnel and (d) 500 μg brain tissue prepared with a disposable 0.5 mm biopsy punch. Total acquisition times are indicated for each spectrum. Spectra (b) and (d) were acquired using the Carr‐Purcell‐Meiboom‐Gill (CPMG) pulse sequence (d20 = 0.2 ms, loop = 200), and spectra (a) and (c) were acquired using the NOESY pulse sequence (mixing time 0.1 s). The main metabolic signatures are identified on the spectra. The preparation for each specimen is detailed in the Supplementary Protocol 1. 3. Final Remarks
Acknowledging the difficulties for preparing μg‐scale specimens in a specific tiny sampling volume for HR‐μMAS NMR spectroscopy, this report presents general guidelines of the sample preparation strategies for the different type of specimens (biofluid, fluid matrix and tissue). Although the basis of these preparations is similar to those for HR‐MAS, they are considerably complicated by the fact that the manipulation of the minuscule specimens along with a tiny rotor must be performed in a repeatable, clean and timely manner. A slight deviation could affect the overall data, resulting in non‐reproducible data acquisition and consequently in variable or misinterpreted analysis.
The guidelines herein can provide a good basis for designing NMR‐based metabolomics studies of μg‐scale heterogeneous specimens with HR‐μMAS or with μMAS in general. An example is shown in Figure 4; over 100 sampling data on tissue (control and disease) were acquired adopting the guidelines stated in this report. The results offer good data reproducibility for reliable multivariate data analysis. The Principal Component Analysis (PCA) score plots (Figure 4a) clearly display two groups within the data set. Its quality parameters (R2X = 0.85, Q2 = 0.63) demonstrate the
data acquisition is trustworthy where the sample preparation has an important contribution. Figure 4b exhibits good regularity of the NMR spectral profiles within the groups. Acceptable values of the relative standard deviation (%RSD) of the individual spectral bins are found with a median of 30.7%
for control and 37.6% for disease (Figure 4c). The slightly higher value of the latter is attributed to the accentuated heterogeneity of the tissue itself.
Figure 4. (a) PCA scores plot obtained from a model study containing 102 data on brain tissue (control and disease) from an initial 112 samples, where 10 (9%) were discarded due to either extra peaks from contamination or poor spectral quality from air pockets or dryness. Quality parameters: 14 components, R2X = 0.85, Q2 = 0.63. (b) Overlaid 1H‐HR‐μMAS NMR spectra of (blue) 62 control and (red) 40 diseased tissue samples. (c) Boxplots of the relative standard deviation (%RSD) values calculated from the individual bucket intensity (Δ = 0.04 ppm) of both groups across the spectral region (0.76–5.28 ppm). It summarizes the lower, median and upper quartiles, with the black whiskers displaying the range of data, and the red cross indicating the outlier data points.
It should be noted that among the different types of specimens, fluid matrices are the most challenging of all. This is due to the difficulty in achieving a required quantity of intact specimens (e.g., tiny organisms and cells) in a nL scale volume. Although the strategy (centrifugal microfunnel) described above improves the sample filling, it is still a primitive and tedious approach. One should consider redesigning the μ‐rotor to incorporate a filtration system that can improve sample filling for fluid matrices, which would be a great advantage. For example, an internal filter inside the rotor would retain the matrix (i.e., specimens), while the fluid would be guided out. This method of collecting and filling the sample would assist in concentrating the specimens inside the μ‐rotor and render an increase in the sensitivity of the experiments. In addition, this potential methodology would benefit from the use of microfluidic technology for gently guiding the susceptible specimens inside the μ‐rotor.
Supplementary Materials: The following are available online at www.mdpi.com/xxx/s1, Protocol S1: Detailed preparation for the samples generating the spectra in Figure 5, Figure S1: Garlic and brain tissue displaying ethanol impurity signals. Figure S2: Differences in the spectral resolution depending on the water content shown in different specimens. Figure S3: μ‐rotor handling and cleaning tools. Figure S4: Example of spectrum obtained by adding a known amount of sucrose embedded in a brain tissue sample.
Author Contributions: C.L.‐T. and P.S.K. carried out experimental work. C.L.‐T. planned and drafted the manuscript; A.W., Y.N., F.S., B.E.H. and A.K.B.‐S. assisted in editing and reviewing; T.B., G.H., P.B. and L.M. provided supports in designing the sample filling and the tools (e.g. microfunnels). All authors have read and agreed to the published version of the manuscript. Funding: C.L.T. and P.S.K. the APC were funded by Agence Nationale de la Recherche in France, grant number ANR‐16‐CE11‐0023. A.K.B.‐S was also supported by LabEx TRAIL, grant number ANR‐10‐LABX‐57 Acknowledgments: Christina Sizun (Institut de Chimie des Substances Naturelles, CNRS) for offering samples; Guillaume Carret and Melanie Moskura (CEA Saclay) for their assistance in fabricating the 3D‐printed microfunnel.
Metabolites 2020, 10, 54 9 of 10 References 1. Dunn, W.B.; Ellis, D.I. Metabolomics: Current analytical platforms and methodologies. Trends Anal. Chem. 2005, 24, 285–294, doi:10.1016/j.trac.2004.11.021. 2. Moco, S.; Bino, R.J.; de Vos, R.C.H.; Vervoort, J. Metabolomics technologies and metabolite identification. Trends Anal. Chem. 2007, 26, 855–866, doi:10.1016/j.trac.2007.08.003.
3. Dunn, W.B.; Broadhurst, D.; Begley, P.; Zelena, E.; Francis‐Mcintyre, S.; Anderson, N.; Brown, M.; Knowles, J.D.; Halsall, A.; Haselden, J.N.; et al. Procedures for large‐scale metabolic profiling of serum and plasma using gas chromatography and liquid chromatography coupled to mass spectrometry. Nat. Protoc. 2011, 6, 1060–1083, doi:10.1038/nprot.2011.335.
4. Martano, G.; Delmotte, N.; Kiefer, P.; Christen, P.; Kentner, D.; Bumann, D.; Vorholt, J.A. Fast sampling method for mammalian cell metabolic analyses using liquid chromatography‐mass spectrometry. Nat.
Protoc. 2015, 10, 1–11, doi:10.1038/nprot.2014.198.
5. Rubakhin, S.S.; Sweedler, J.V. Characterizing peptides in individual mammalian cells using mass spectrometry. Nat. Protoc. 2007, 2, 1987–1997, doi:10.1038/nprot.2007.277.
6. Vuckovic, D. Current trends and challenges in sample preparation for global metabolomics using liquid
chromatography‐mass spectrometry. Anal. Bioanal. Chem. 2012, 403, 1523–1548,
doi:10.1007/s00216‐012‐6039‐y. 7. Beckonert, O.; Keun, H.C.; Ebbels, T.M.D.; Bundy, J.; Holmes, E.; Lindon, J.C.; Nicholson, J.K. Metabolic profiling, metabolomic and metabonomic procedures for NMR spectroscopy of urine, plasma, serum and tissue extracts. Nat. Protoc. 2007, 2, 2692–2703, doi:10.1038/nprot.2007.376. 8. Pontes, J.G.M.; Brasil, A.J.M.; Cruz, G.C.F.; de Souza, R.N.; Tasic, L. NMR‐based metabolomics strategies: plants, animals and humans. Anal. Methods 2017, 9, 1078–1096, doi:10.1039/C6AY03102A.
9. Álvarez‐Sánchez, B.; Priego‐Capote, F.; Luque de Castro, M.D. Metabolomics analysis I. Selection of biological samples and practical aspects preceding sample preparation. Trends Anal. Chem. 2010, 29, 111– 119, doi:10.1016/j.trac.2009.12.003.
10. Álvarez‐Sánchez, B.; Priego‐Capote, F.; Luque de Castro, M.D. de Metabolomics analysis II. Preparation of biological samples prior to detection. Trends Anal. Chem. 2010, 29, 120–127, doi:10.1016/j.trac.2009.12.004. 11. Beckonert, O.; Coen, M.; Keun, H.C.; Wang, Y.; Ebbels, T.M.D.; Holmes, E.; Lindon, J.C.; Nicholson, J.K.
High‐resolution magic‐angle‐spinning NMR spectroscopy for metabolic profiling of intact tissues. Nat.
Protoc. 2010, 5, 1019–1032, doi:10.1038/nprot.2010.45.
12. Mirnezami, R.; Jiménez, B.; Li, J.V.; Kinross, J.M.; Veselkov, K.; Goldin, R.D.; Holmes, E.; Nicholson, J.K.; Darzi, A. Rapid diagnosis and staging of colorectal cancer via high‐resolution magic angle spinning nuclear magnetic resonance (HR‐MAS NMR) spectroscopy of intact tissue biopsies. Ann. Surg. 2014, 259, 1138–1149, doi:10.1097/SLA.0b013e31829d5c45.
13. Choi, J.S.; Baek, H.‐M.; Kim, S.; Kim, M.J.; Youk, J.H.; Moon, H.J.; Kim, E.‐K.; Han, K.H.; Kim, D.; Kim, S.I; Koo, J.S. HR‐MAS MR Spectroscopy of Breast Cancer Tissue Obtained with Core Needle Biopsy: Correlation with Prognostic Factors. PLoS One 2012, 7, e51712, doi:10.1371/journal.pone.0051712.
14. Farooq, H.; Courtier‐Murias, D.; Soong, R.; Bermel, W.; Kingery, W.; Simpson, A. HR‐MAS NMR Spectroscopy: A Practical Guide for Natural Samples. Curr. Org. Chem. 2013, 17, 3013–3031, doi:10.2174/13852728113179990126.
15. Blaise, B.J.; Giacomotto, J.; Triba, M.N.; Toulhoat, P.; Piotto, M.; Emsley, L.; Ségalat, L.; Dumas, M.E.; Elena, B. Metabolic profiling strategy of caenorhabditis elegans by whole‐organism nuclear magnetic resonance. J. Proteome Res. 2009, 8, 2542–2550, doi:10.1021/pr900012d.
16. Nishiyama, Y.; Endo, Y.; Nemoto, T.; Bouzier‐Sore, A.‐K.; Wong, A. High‐resolution NMR‐based metabolic detection of microgram biopsies using a 1 mm HRμMAS probe. Analyst 2015, 140, 8097–8100, doi:10.1039/C5AN01810B. 17. Duong, N.T.; Endo, Y.; Nemoto, T.; Kato, H.; Bouzier‐Sore, A.‐K.; Nishiyama, Y.; Wong, A. Evaluation of a high‐resolution micro‐sized magic angle spinning (HRμMAS) probe for NMR‐based metabolomic studies of nanoliter samples. Anal. Methods 2016, 8, 6815–6820, doi:10.1039/C6AY01654E. 18. Lucas‐Torres, C.; Huber, G.; Ichikawa, A.; Nishiyama, Y.; Wong, A. HR‐μMAS NMR‐Based Metabolomics: Localized Metabolic Profiling of a Garlic Clove with μg Tissues. Anal. Chem. 2018, 90, 13736–13743, doi:10.1021/acs.analchem.8b04150.
19. Lucas‐Torres, C.; Wong, A. Current developments in μMAS NMR analysis for metabolomics. Metabolites 2019, 9, doi:10.3390/metabo9020029.
20. Duong, N.T.; Yamato, M.; Nakano, M.; Kume, S.; Tamura, Y.; Kataoka, Y.; Wong, A.; Nishiyama, Y. Capillary‐inserted rotor design for HRμMAS NMR‐based metabolomics on mass‐limited neurospheres.
Molecules 2017, 22, 1–9, doi:10.3390/molecules22081289.
21. Feng, J.; Hu, J.; Burton, S.D.; Hoyt, D.W. High Resolution Magic Angle Spinning 1H NMR metabolic profiling of nanoliter biological tissues at high magnetic field. Chinese J. Magn. Reson. 2013, 30, 1–11. 22. Wong, A.; Li, X.; Molin, L.; Solari, F.; Elena‐Herrmann, B.; Sakellariou, D. μHR‐MAS NMR Spectroscopy
for Metabolic Phenotyping of Caenorhabditis Elegans. Anal. Chem. 2014, 86, 6064–6070, doi:10.1021/ac501208z.
23. León, Z.; García‐Cañaveras, J.C.; Donato, M.T.; Lahoz, A. Mammalian cell metabolomics: Experimental design and sample preparation. Electrophoresis 2013, 34, 2762–2775, doi:10.1002/elps.201200605.
24. Lu, W.; Su, X.; Klein, M.S.; Lewis, I.A.; Fiehn, O.; Rabinowitz, J.D. Metabolite Measurement: Pitfalls to
Avoid and Practices to Follow. Annu. Rev. Biochem. 2017, 86, 277–304,
doi:10.1146/annurev‐biochem‐061516‐044952.
25. Mashego, M.R.; Rumbold, K.; de Mey, M.; Vandamme, E.; Soetaert, W.; Heijnen, J.J. Microbial metabolomics: Past, present and future methodologies. Biotechnol. Lett. 2007, 29, 1–16, doi:10.1007/s10529‐006‐9218‐0.
26. Piotto, M.; Elbayed, K.; Wieruszeski, J.M.; Lippens, G. Practical aspects of shimming a high resolution magic angle spinning probe. J. Magn. Reson. 2005, 173, 84–89, doi:10.1016/j.jmr.2004.11.022. © 2020 by the authors. Licensee MDPI, Basel, Switzerland. This article is an open access article distributed under the terms and conditions of the Creative Commons Attribution (CC BY) license (http://creativecommons.org/licenses/by/4.0/).