HAL Id: inserm-01353362
https://www.hal.inserm.fr/inserm-01353362
Submitted on 11 Aug 2016
HAL is a multi-disciplinary open access archive for the deposit and dissemination of sci-entific research documents, whether they are pub-lished or not. The documents may come from teaching and research institutions in France or abroad, or from public or private research centers.
L’archive ouverte pluridisciplinaire HAL, est destinée au dépôt et à la diffusion de documents scientifiques de niveau recherche, publiés ou non, émanant des établissements d’enseignement et de recherche français ou étrangers, des laboratoires publics ou privés.
disease in transgenic mice
Mohamed Amine Hamouda, Arnaud Jacquel, Guillaume Robert, Alexandre
Puissant, Valentine Richez, Roméo Cassel, Nina Fenouille, Sandrine Roulland,
Jérôme Gilleron, Emmanuel Griessinger, et al.
To cite this version:
Mohamed Amine Hamouda, Arnaud Jacquel, Guillaume Robert, Alexandre Puissant, Valentine Richez, et al.. BCL-B (BCL2L10) is overexpressed in patients suffering from multiple myeloma (MM) and drives an MM-like disease in transgenic mice. Journal of Experimental Medicine, Rockefeller University Press, 2016, [Epub ahead of print]. �10.1084/jem.20150983�. �inserm-01353362�
Ar ticle
The Rockefeller University Press $30.00
INT ROD UCT ION
Multiple myeloma (MM) is a malignant condition that evolves from monoclonal gammopathy of undetermined significance (MGUS) and corresponds to the expansion of abnormal plas‑
mocytes in the BM (Palumbo and Anderson, 2011). Autol‑ ogous stem cell transplantation remains a good option for treating this disease; however, all patients will unavoidably re‑ lapse. Therefore, considerable efforts have been devoted to the development of new therapeutic options for the treatment of patients suffering from MM. Although drugs such as lenalid‑
Multiple myeloma (MM) evolves from a premalignant condition known as monoclonal gammopathy of undetermined signifi-cance (MGUS). However, the factors underlying the malignant transformation of plasmocytes in MM are not fully character-ized. We report here that Eµ-directed expression of the antiapoptotic Bcl-B protein in mice drives an MM phenotype that reproduces accurately the human disease. Indeed, with age, Eµ-bcl-b transgenic mice develop the characteristic features of human MM, including bone malignant plasma cell infiltration, a monoclonal immunoglobulin peak, immunoglobulin deposit in renal tubules, and highly characteristic bone lytic lesions. In addition, the tumors are serially transplantable in irradiated wild-type mice, underlying the tumoral origin of the disease. Eµ-bcl-b plasmocytes show increased expression of a panel of genes known to be dysregulated in human MM pathogenesis. Treatment of Eµ-bcl-b mice with drugs currently used to treat patients such as melphalan and VEL CADE efficiently kills malignant plasmocytes in vivo. Finally, we find that Bcl-B is overexpressed in plasmocytes from MM patients but neither in MGUS patients nor in healthy individuals, suggesting that Bcl-B may drive MM. These findings suggest that Bcl-B could be an important factor in MM disease and pinpoint Eµ-bcl-b mice as a pertinent model to validate new therapies in MM.
BCL-B (BCL2L10) is overexpressed in patients suffering
from multiple myeloma (MM) and drives an MM-like
disease in transgenic mice
Mohamed‑Amine Hamouda,
1,6,7Arnaud Jacquel,
1,6,7Guillaume Robert,
1,6,7Alexandre Puissant,
8,9Valentine Richez,
1,17Romeo Cassel,
1,6,7Nina Fenouille,
10Sandrine Roulland,
11Jerome Gilleron,
2,6Emmanuel Griessinger,
3,6Alix Dubois,
1,6,7Beatrice Bailly‑Maitre,
4,6Diogo Goncalves,
1,6,7Aude Mallavialle,
5,6Pascal Colosetti,
1,6,7Sandrine Marchetti,
1,6,7Martine Amiot,
12Patricia Gomez‑Bougie,
12Nathalie Rochet,
6,13Marcel Deckert,
5,6Herve Avet‑Loiseau,
14Paul Hofman,
15Jean‑Michel Karsenti,
16Pierre‑Yves Jeandel,
17Claudine Blin‑Wakkach,
6,18Bertrand Nadel,
11Thomas Cluzeau,
1,6,7,16Kenneth C. Anderson,
8,9Jean‑Gabriel Fuzibet,
17Patrick Auberger,
1,6,7* and
Frederic Luciano
1,6,7*
1Team 2, 2Team 7, 3Team 4, 4Team 8, and 5Team 11, Institut National de la Santé et de la Recherche Médicale (INS ERM) U1065, Centre Méditerranéen de Médecine
Moléculaire (C3M), 06204 Nice, France
6Université de Nice Sophia-Antipolis, 06000 Nice, France
7Equipe Labellisée par la Ligue Nationale Contre le Cancer, 75013 Paris, France
8Dana-Farber Cancer Institute and 9Boston Children’s Hospital, Harvard Medical School, Boston, MA 02115 10Koch Institute for Integrative Cancer Research, Massachusetts Institute of Technology, Cambridge, MA 02142
11Centre d’Immunologie de Marseille-Luminy, Aix-Marseille University, INS ERM U1104, Centre National de la Recherche Scientifique (CNRS) UMR 7280,
13288 Marseille, France
12Team 10, INS ERM U892, 44007 Nantes, France 13UMR 7277, 06108 Nice, France
14Cancer Research Center of Toulouse, UMR 1037, INS ERM–Université Toulouse III Paul Sabatier (UPS)–CNRS, 31037 Toulouse, France
15Service d’Anatomopathologie, 16Service d’Hématologie Clinique, and 17Service de Médecine Interne, Centre Hospitalier Universitaire de Nice, 06003 Nice, France 18CNRS UMR 7370, 06108 Nice, France
© 2016 Hamouda et al. This article is distributed under the terms of an Attribution–Noncommercial–Share Alike–No Mirror Sites license for the first six months after the publication date (see http ://www .rupress .org /terms). After six months it is available under a Creative Commons License (Attribution–Noncommercial– Share Alike 3.0 Unported license, as described at http ://creativecommons .org /licenses /by -nc -sa /3 .0 /).
*P. Auberger and F. Luciano contributed equally to this paper. Correspondence to Frederic Luciano: fluciano@unice.fr
Abbreviations used: MGUS, monoclonal gammopathy of undetermined significance; MM, multiple myeloma; M-spike, monoclonal spike; PC, plasma cell; SHM, somatic hypermutation; SPEP, serum protein electrophoresis; TRAP, tartrate-resistant acid phosphatase.
The Journal of Experimental Medicine
on July 25, 2016
jem.rupress.org
Downloaded from
omide (REV LIM ID) and bortezomib (VEL CADE) have sig‑ nificantly improved the overall survival rates of patients, MM remains an incurable disease, and there is an urgent need for new therapies (Strobeck, 2007; Ludwig et al., 2010).
Among the six human antiapoptotic Bcl‑2 family pro‑
teins (Bcl‑2 [BCL2], Bcl‑XL [BCL2L1], Mcl‑1 [MCL1],
Bcl‑W [BCL2L2], Bfl‑1 [BCL2A1], and Bcl‑B [BCL2L10]; Adams and Cory, 1998), Bcl‑B was the last antiapoptotic member to be identified, and its physiological function is only partially understood (Ke et al., 2001; Zhai et al., 2003). Bcl‑B is expressed predominantly in normal human B lymphocytes and is pathologically overexpressed in malignant plasma cells (PCs) and many types of solid tumors such as prostate, mam‑ mary, colorectal, and lung carcinomas (Luciano et al., 2007; Krajewska et al., 2008). Mice lack the bcl‑b gene; however, the closest homologue (Diva/Boo) is predominantly ex‑ pressed in ovary and testis and exhibits a proapoptotic rather than an antiapoptotic phenotype (Inohara et al., 1998).
Pangenomic studies have been extensively used to iso‑ late genes that are differentially expressed in PCs from healthy donors versus MGUS and MM patients (Claudio et al., 2002; Davies et al., 2003; De Vos et al., 2003; Carrasco et al., 2006). None of these studies identified the bcl‑b gene as a candidate promoting the genesis and progression of MM. However, a recent report showed that ubiquitination and proteasomal turnover dictate the expression level of the Bcl‑B protein and thereby its antiapoptotic activity (Beverly et al., 2012; van de Kooij et al., 2013; Rooswinkel et al., 2014). Consequently, determination of the Bcl‑B protein level appears to be the only reliable approach for evaluating its oncogenic potential.
The generation of specific mouse models of MM is not only an important challenge but also a prerequisite for better characterization and understanding of the molecular mecha‑ nisms involved in MM pathogenesis and the progression from MGUS to MM. In addition, the availability of mouse models that accurately recapitulate MM could be of considerable in‑ terest for the validation of new therapeutic strategies for this
disease. However, attempts to develop such models (3′KE‑
bcl‑xL, Igh‑c‑myc Eµ‑c‑maf) have generally yielded B cell
malignancies displaying immature phenotypes or plasmacy‑ tomas rather than MM (Linden et al., 2004; Park et al., 2005; Morito et al., 2011). Several other animal models of MM
(Eµ‑xbp‑1s, 3′KE‑bcl‑xL/Eµ‑c‑myc, bcl‑xL × imyc) have
been reported but do not recapitulate all of the characteristics of human MM from the clinical, pathological, and genetic points of view (Cheung et al., 2004; Boylan et al., 2007; Car‑ rasco et al., 2007). Only the vk*myc mouse model, in which the activation of c‑myc oncogene occurs sporadically through the physiological somatic hypermutation (SHM) process, ful‑ fills most of the biological and genetic criteria of an ideal mouse model of MM (Chesi et al., 2008).
In the present study, we identify the pathophysiological function of Bcl‑B for the first time. Of note, we show that specific overexpression of Bcl‑B in the B cell compartment drives an MM‑like disease in transgenic mice that recapitulates
the main features of the human pathology, including a unique IgG monoclonal peak driven by specific immunoglobulin re‑ arrangements, PC infiltration in the BM, anemia, lytic bone lesions, and kidney immunoglobulin deposits. Unlike previ‑ ously characterized MM mouse models, in which penetrance was relatively low, 100% of Eµ‑bcl‑b mice develop the disease. In addition, Eµ‑bcl‑b mice exhibit increased expression of proteins involved in the regulation of B cell proliferation and plasmocyte differentiation, including Xbp‑1s.
The discovery that Bcl‑B could be an important factor in PC homeostasis that can drive an MM‑like disease in mice may have important clinical implications.
RES ULTS
Bcl-B is predominantly expressed in the BM of MM patients
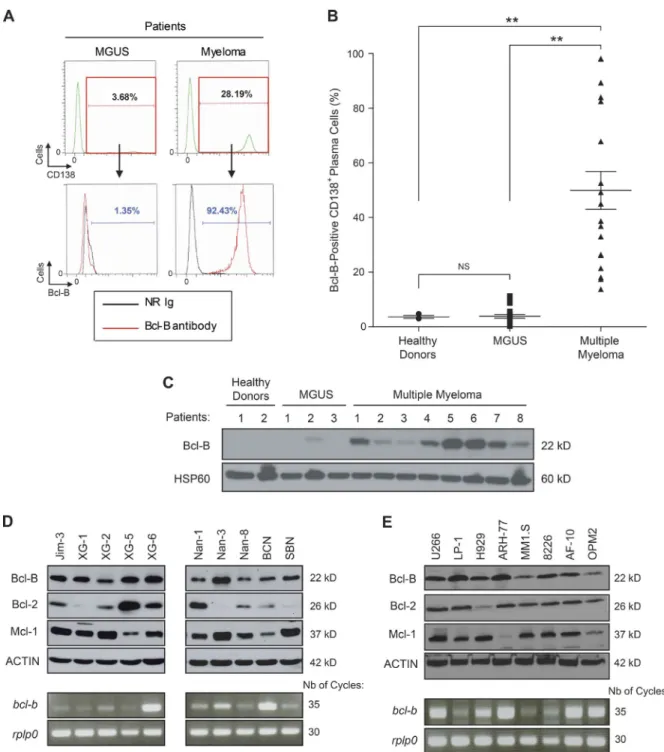
We previously reported Bcl‑B overexpression in histological BM sections from MM patients (Luciano et al., 2007; Kra‑ jewska et al., 2008). To confirm Bcl‑B protein expression, we used a dedicated flow cytometry assay (Cluzeau et al., 2012). Fig. 1 A shows an example of Bcl‑B protein expression mea‑ surement by flow cytometry in an MGUS patient and an MM patient with 3.6% and 28.2% of medullar plasmocytes, respectively. We found that most of the plasmocytes from the MM patient highly expressed the Bcl‑B protein, whereas a negligible proportion of the plasmocytes from the MGUS patient weakly expressed the Bcl‑B protein. In patients with
newly diagnosed MM (n = 18), 20–100% of sorted CD138+
BM cells were positive for Bcl‑B, whereas only a very small
percentage (0–10%) of CD138+ BM cells from healthy donors
(n = 3) and MGUS patients (n = 20) were positive for this protein (Fig. 1 B). The level of Bcl‑B expression was next analyzed by Western blot using plasmocytes from two healthy donors, three MGUS patients, and eight patients with newly diagnosed MM. All MM patients expressed Bcl‑B, whereas the protein was almost undetectable in healthy donors and MGUS patients (Fig. 1 C). We finally examined different MM cell lines for the expression of Bcl‑B, Bcl‑2, and Mcl‑1 because these two latter Bcl‑2 family members were previously reported to be important for MM pathogenesis (Spets et al., 2002; Go‑ mez‑Bougie et al., 2004; Wuillème‑Toumi et al., 2005; Morales et al., 2011). The level of Bcl‑B expression was homogeneous in all of the MM cell lines, whereas significant variation was observed for Bcl‑2 and Mcl‑1 expression from one cell line to another (Fig. 1, D and E, top). In the corresponding MM cell lines, we also examined the expression of Bcl‑B at the RNA level. Although there was not a perfect correlation between the mRNA level and the protein expression, amplification of Bcl‑B mRNA was observed in most cell lines (Fig. 1, D and E, bottom).We also detected homogeneous expression of Bcl‑B in all B cell lymphoma cell lines tested that was equivalent in intensity to that detected in MM. Interestingly, the Bcl‑B pro‑ tein was not detected in two myeloid cell lines (not depicted). These results are in agreement with previous studies that have demonstrated that the expression level of Bcl‑B
on July 25, 2016
jem.rupress.org
Figure 1. Bcl-B protein is predominantly expressed in the BM of patients suffering from MM and is widely expressed in human MM cell lines.
(A) Representative cytometric profiles as examples of Bcl-B–positive PC quantification by flow cytometry analysis of BM cells from an MGUS and an MM patient. Total BM cells were quantified, and Bcl-B protein expression was measured by gating the CD138-positive fraction corresponding to medullar plas-mocytes. NR Ig, nonrelevant rabbit Ig. (B) The percentage of Bcl-B–positive PCs was quantified by flow cytometry analysis of BM cells from healthy donors (n = 3), MGUS patients (n = 20), and patients with newly diagnosed MM (n = 18). P-values were determined by one-way ANO VA. NS, no significant difference was observed. **, P < 0.01. Results are expressed as the mean ± SD. (C) PCs were isolated from the BM of healthy donors (lanes 1 and 2), MGUS patients (lanes 3–5), and MM patients (lanes 6–13) using CD138 magnetic beads. Total protein lysates (35 µg per lane) were subjected to Western blot analysis using anti–Bcl-B or Hsp60 antibodies. (D and E) Total protein extracts (30 µg) from a panel of human MM cell lines were subjected to SDS-PAGE/immunoblot using Bcl-B, Bcl-2, Mcl-1, and Actin antibodies (top). In parallel, bcl-b transcript level was determined by RT-PCR (bottom).
on July 25, 2016
jem.rupress.org
Downloaded from
protein is mainly dependent on its posttranscriptional regu‑ lation and that the abundance of the transcript does not re‑ flect the expression level of the protein (Beverly et al., 2012; van de Kooij et al., 2013; Rooswinkel et al., 2014). Collec‑ tively, these data suggest that Bcl‑B protein could be a ro‑ bust marker of MM disease.
Expression of Bcl-B in B cells drives MM in transgenic mice
To investigate the role of Bcl‑B in plasmocyte homeostasis, we designed transgenic mice carrying the Bcl‑B open read‑ ing frame under the control of the immunoglobulin VH pro‑ moter and Eµ enhancer elements (Eµ‑bcl‑b mice; Fig. 2 A). Among the eight founders obtained, we further analyzed those expressing the transgene exclusively in B cells. All of them developed an MM‑like disease. We further focused on the founder line with intermediate expression of Bcl‑B. As expected, the Eµ regulatory elements specifically drove ex‑ pression of Bcl‑B only in the BM, spleen, and lymph nodes (Fig. 2 B). Although endogenous Bcl‑B protein is absent in mice, the functionality of exogenous Bcl‑B protein was con‑ firmed in splenic cells isolated from Eµ‑bcl‑b mice based on its ability to interact with the BH3‑only family mem‑ ber Bim (not depicted).
The overall survival of homozygous (+/+) Eµ‑bcl‑b mice (Fig. 2 C, red curve) was significantly lower than that of control mice (Fig. 2 C, black curve). Half of the homo‑ zygous (+/+) Eµ‑bcl‑b mice died within 18 mo versus 26 mo for the control mice. Moreover, all (+/+) Eµ‑bcl‑b mice were dead at 20 mo compared with only 10% of the control
mice. Of note, hemizygous (−/+) Eµ‑bcl‑b mice showed an
intermediate overall survival that correlated with the twofold lower Bcl‑B expression in the corresponding plasmocytes (Fig. 2 C, blue curve and inset). For the rest of the study, we
used almost exclusively hemizygous (−/+) Eµ‑bcl‑b mice.
With age, Eµ‑bcl‑b mice exhibited an increased proportion
of CD138+ plasmocytes in their BM (Fig. 2 D). The increased
proportion of CD138+ plasmocytes was also confirmed by
immunofluorescence and by May‑Grünwald‑Giemsa (MGG) staining (not depicted). At 15 mo, the mean percentage of
mature plasmocytes (B220−/CD138+) was 15.58% (with a
range of 5% to 52%) in Eµ‑bcl‑b mice versus only 0.47% in control mice. Importantly, neither WT nor transgenic young mice developed plasmacytosis (not depicted). As is the case for MM patients who often develop anemia, Eµ‑bcl‑b mice ex‑ hibited reduced hemoglobin levels (mean = 7.5 g/dl, n = 28) compared with their control counterparts (mean = 13.2 g/dl, n = 16; Fig. 2 E). Although all aged Bcl‑B mice developed an MM‑like disease, the incidence of the splenomegaly in Eµ‑ bcl‑b mice was only 53.3% (not depicted). Splenomegaly was accompanied by an increase in cellularity and a significant in‑ crease in mature B cell number. However, we failed to detect any increase in CD138‑positive cells, corresponding to plas‑ mocytes, in the spleens of Eµ‑bcl‑b mice. At the same time, we identified a comparable proportion of T cells, B cells, and PCs in the lymph nodes of wild‑type and Eµ‑bcl‑b mice (not
depicted). Moreover, Eµ‑bcl‑b mice exhibited characteristic lytic bone lesions (Fig. 2 F, top) compared with their control counterparts (Fig. 2 F, top). Indeed, areas of bone destruc‑ tion were clearly visible in Eµ‑bcl‑b mice (Fig. 2 F, yellow arrows). Tartrate‑resistant acid phosphatase (TRAP) staining was also analyzed in the trabecular zone of the femurs from WT and Eµ‑bcl‑b transgenic mice. The black arrows indicate significantly more TRAP‑positive osteoclasts (purple stain‑ ing) in Eµ‑bcl‑b mice. Images were analyzed to define the areas corresponding to TRAP staining. These areas were nor‑ malized to the bone areas and revealed a significant increase in TRAP‑positive cells in Eµ‑bcl‑b mice compared with WT mice (not depicted). Congo red staining of histochemical sections from the kidneys of wild‑type and Eµ‑bcl‑b mice showed reddish and intense orange deposits in the latter, cor‑ responding to amyloid deposition (Fig. 2 G, left). This was confirmed under polarized light (Fig. 2 G, right). The bright green is the “apple green birefringence” that is characteris‑ tic of amyloid deposition. Such deposits are also reminiscent of the human pathology.
Eµ-bcl-b mice exhibit monoclonal hypergammaglobulinemia
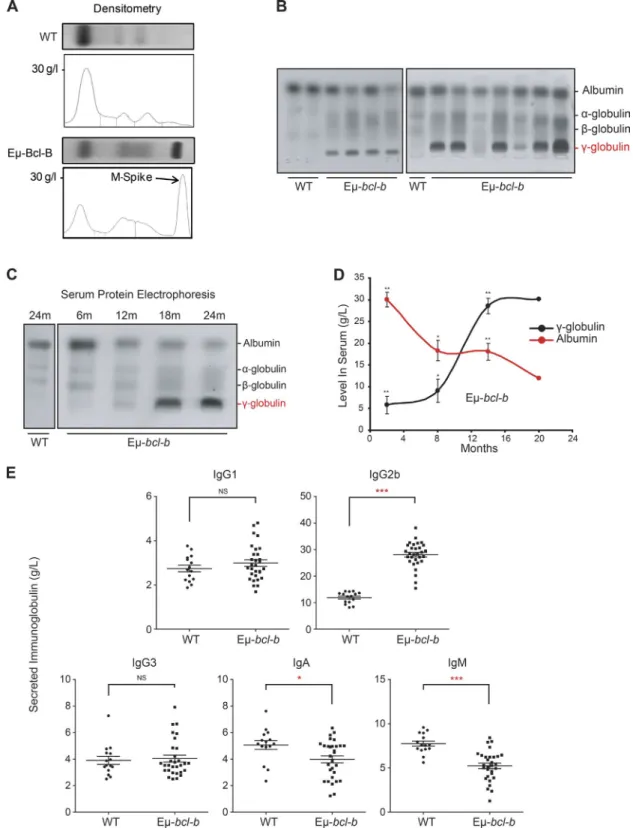
Serum protein electrophoresis (SPEP) on the blood of 18‑mo‑ old mice confirmed the diagnosis of myeloma (Fig. 3 A). The
presence of a monoclonal spike (M‑spike; γ‑globulin peak) in
transgenic mice is indicated by an arrow (Fig. 3 A). A promi‑
nent γ‑globulin peak was also detected in the sera of 9 out of
11 mice, and a fainter one was present in the 2 remaining mice
(Fig. 3 B). We also analyzed the appearance of the γ‑glob‑
ulin peak in the serum of transgenic mice as a function of the disease progression (Fig. 3 C). The immunoglobulin peak was faintly detected at 12 mo and was maximal after 18 mo of age, but undetectable in the serum of 24‑mo‑old control mice (Fig. 3 C). Densitometric analysis showed a time‑de‑ pendent increase of gammaglobulinemia in the serum of four transgenic mice and a parallel decrease in albumin production (Fig. 3 D). The decrease in serum albumin level is a hallmark of human MM that was reported in the previously generated MM mouse model (Chesi et al., 2008). A selective increase in IgG2b was detected by ELI SA in the sera of homozygous Eµ‑bcl‑b (n = 30) versus control mice (n = 15), whereas no increase in the IgG1 and IgG3 levels was noted (Fig. 3 E). IgA and IgM levels were significantly decreased in homozy‑ gous Eµ‑bcl‑b mice. This finding is in agreement with the situation observed in the human disease. Globally, from this data, we concluded that 86.7% of the homozygous Eµ‑bcl‑b mice developed a monoclonal gammopathy. In comparison, 38.1% of the hemizygous transgenic mice developed a mono‑ clonal gammopathy (not depicted). To further confirm the monoclonal origin of the tumors that developed in the Eµ‑ bcl‑b transgenic mice, we analyzed immunoglobulin heavy
and light chain gene rearrangements in sorted CD138+ plas‑
mocytes from two WT and three Eµ‑bcl‑b mice (compare Table S3). PCR analysis revealed the clonal origin of the tumor in homozygous transgenic mouse #1 for both IgH
on July 25, 2016
jem.rupress.org
Figure 2. Generation and characterization of Eµ-bcl-b transgenic mice. (A) Transgenic mice were designed that carry the Myc-bcl-b open reading
frame under the control of the immunoglobulin VH promoter and Eµ enhancer elements (Eµ-bcl-b mice). (B) The Bcl-B protein level was analyzed by Western blot in the spleen, lymph node, thymus, BM, kidney, muscle, and heart of 8-wk-old control or Eµ-bcl-b transgenic mice. The asterisk indicates a nonspecific band used as a loading control. (C) The graph represents the overall survival (in months) of a cohort of 56 WT, 80 hemizygous (−/+), and 48 homozygous (+/+) Eµ-bcl-b mice. Statistically significant differences (P < 0.005) were detected between Eµ-bcl-b transgenic and control littermates. (inset) Splenic cells from WT, (−/+), and (+/+) Eµ-bcl-b mice were collected and lysed, and the total protein extracts were subjected to SDS-PAGE/
on July 25, 2016
jem.rupress.org
Downloaded from
and Igk, with five identical clones out of five sequenced in each case. Regarding the second transgenic mouse (tumor #2), which was also supposed to be homozygous, the results for the monoclonality on the basis of the IgK locus appear very clear, whereas the results for the monoclonality on the basis of the IgH locus, where a dominant B cell clone popu‑ lation represents at least 50% of the myeloma cells, appear less clear. Therefore, one can consider mouse #2 as oligoclonal. Globally, there was good evidence of clonal expansion for both mouse #1 and #2 compared with WT mice. In contrast, for the third transgenic mouse (tumor #3), which was known to be hemizygous, the tumor was clearly polyclonal. This was not unexpected because two‑thirds of the hemizygous Eµ‑ bcl‑b transgenic mice produce more than one monoclonal antibody. Finally, sequence analysis of the VDJH4 and VKJK variable regions showed evidence of SHM and intraclonal di‑ versity accumulation, both compatible with a clonal expansion process. In conclusion, despite the low number of mice tested, a monoclonal origin was established for the two homozygous Eµ‑bcl‑b mouse tumors. Collectively, the results from Fig. 3 and Table S3 confirm the monoclonality of the disease.
Set of genes modulated in Eµ-bcl-b plasmocytes
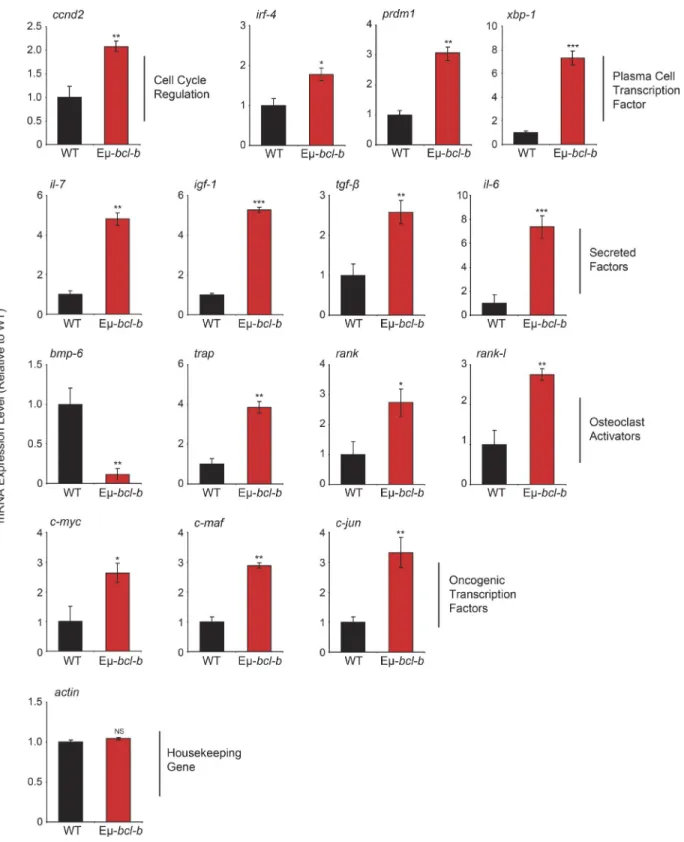
To compare gene expression profiles of control and Eµ‑bcl‑b mice, we performed dedicated microarrays covering the main cytokines affected in MM and important cellular pathways involved in B cell proliferation and differentiation. We ob‑ served a significant increase in the mRNA expression of key factors involved in the pathogenesis of human MM, including igf‑1, il‑6, and il‑7 cytokines; c‑myc, ccnd2, c‑maf, and c‑jun proto‑oncogenes; and irf‑4, prdm‑1, and xbp‑1 key genes in‑ volved in B cell and plasmocyte differentiation (Iida et al., 1997; Borson et al., 2002; Klein et al., 2003; Shaffer et al., 2008; Ohguchi et al., 2016). Of note, modulation of mRNA expression of the bone resorption factors rank, rank‑l, bmp‑6, and trap was also detected (Fig. 4). Collectively, this pattern of mRNA expression is in agreement with the MM phenotype developed by the Eµ‑bcl‑b mice.
The malignant PCs of Eµ-bcl-b mice are serially transplantable and are sensitive to conventional MM therapies
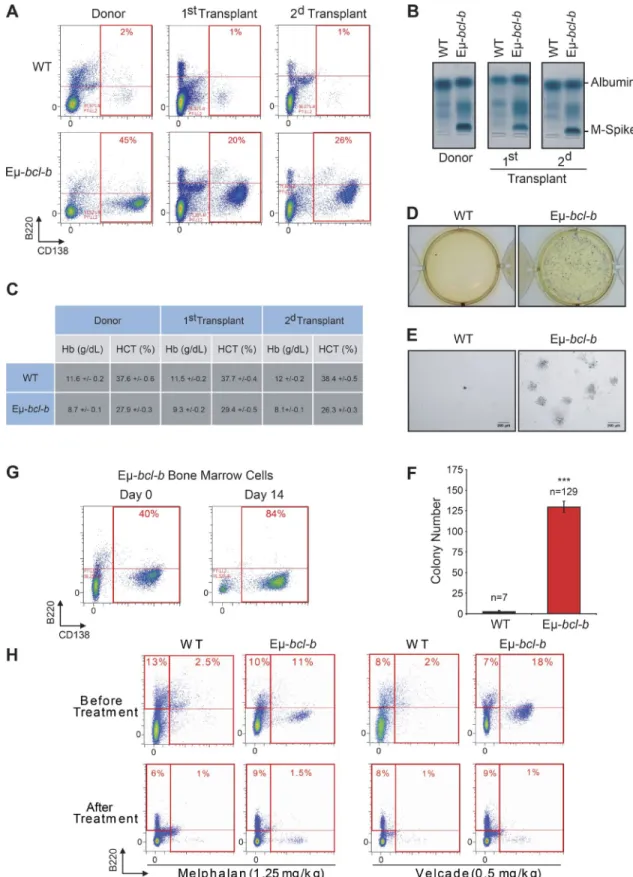
To determine whether the BM cells from Eµ‑bcl‑b mice have the potential to generate clinical features of MM into sec‑
ondary recipients, BM mononuclear cells from transgenic and control mice were i.v. injected into lethally irradiated synge‑ neic C57BL/6 mice. Conversely to mice transplanted with control BM cells, those transplanted with transgenic BM cells
showed signs of weakness after 2 mo. The CD138+/B220−
PC expansion was maintained in the BM of the first and second transplants (Fig. 5 A), and SPEP analysis detected a monoclonal peak in the sera of transplanted mice (Fig. 5 B). Blood analysis also revealed a drastic reduction in hemoglobin and hematocrit levels (Fig. 5 C). Mice serially transplanted with control BM cells had no evidence of plasmacytosis, IgG peak, or blood count anomalies. The clonogenic potential of BM cells from Eµ‑bcl‑b or wild‑type secondary transplanted mice was further analyzed. Only BM cells from Eµ‑bcl‑b mice harbored a high clonogenic potential and could be ex‑ panded in culture medium supplemented with mouse–ril‑7
(Fig. 5, D–F). Indeed, after 14 d, the proportion of B220−/
CD138+ PCs in the BM of Eµ‑bcl‑b mice drastically in‑
creased (Fig. 5 G). All together, these findings confirm the tumorigenic nature of the Eµ‑bcl‑b mice plasmocytes.
To determine whether the Eµ‑bcl‑b are sensitive to con‑ ventional chemotherapies, 24‑mo‑old transgenic and control mice were treated with either VEL CADE (0.5 mg/kg twice a week for 6 wk) or melphalan (1.25 mg/kg once a day for 5 wk; Fig. 5 H). At the end of both treatments, a drastic diminu‑ tion of the plasmacytosis in the BM from the transgenic mice
was observed. In parallel, we showed that the B (B220+), T
(CD4+/CD8+), and monogranulocytic (GR1+) populations
were not affected by both treatments in BM or spleen from control or transgenic mice (not depicted). These results show that the tumorigenic plasmocytes from the Eµ‑bcl‑b mice are sensitive to conventional therapies and confirm that our model could be used to test innovative therapeutic strategies.
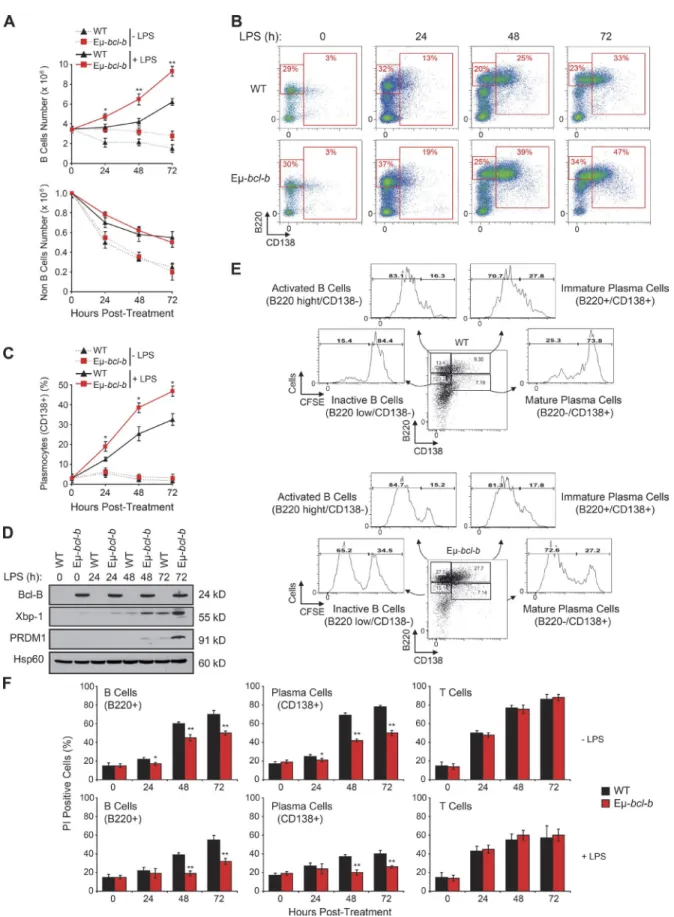
Increased plasmocyte proliferation and differentiation of Eµ-bcl-b splenic B cells
We next investigated the role of Bcl‑B in B cell prolifera‑ tion and plasmocyte differentiation ex vivo. Splenic B cells from 8‑wk‑old control and Eµ‑bcl‑b mice were incubated ex vivo with LPS. LPS significantly increased the number of B cells in wild‑type mice at 3 d (Fig. 6 A). Splenic B cells isolated from Bcl‑B mice exhibited a 2.5‑fold increase in B cell number in response to LPS, whereas non‑B cells were unaffected (Fig. 6, A and B). During plasmocyte differentia‑
immunoblot using Bcl-B and Hsp60 antibodies. (D, left) PCs from BM sections of hemizygous 18-mo-old WT or Eµ-bcl-b mice were stained with an an-ti-CD138 antibody. (right) The infiltration of PCs into the BM of transgenic mice was confirmed by flow cytometry using B220 and CD138 antibodies. (E) Hemoglobin levels in the peripheral blood were measured in 18-mo-old WT mice (n = 16) and Eµ-bcl-b mice (n = 28). ***, P < 0.0001 using a two-tailed Student’s t test for unpaired data. Horizontal bars indicate median. (F, left) Freshly isolated nondecalcified femurs from WT and hemizygous Eµ-bcl-b transgenic mice were x-rayed. The yellow arrows indicate lytic bone lesions in Eµ-bcl-b mice. (right) TRAP staining was analyzed in the trabecular zone of the femurs from WT and Eµ-bcl-b transgenic mice. The black arrows indicate more TRAP-positive osteoclasts (purple color) in Eµ-bcl-b mice. (G) Renal tissue sections from 18-mo-old control (WT) and hemizygous Eµ-bcl-b mice were stained with Congo red. (left) Sections were mounted, and brightfield images were acquired. The black arrows indicate amyloid deposition in the interstitium. (right) Polarized images were also acquired. The bright green is the “apple green birefringence” that is characteristic of amyloid.
on July 25, 2016
jem.rupress.org
Figure 3. Eµ-bcl-b transgenic mice exhibit monoclonal gammopathy. (A) SPEP was performed with the sera of representative 18-mo-old WT and
hemizygous Eµ-bcl-b mice. The presence of an M-spike (γ-globulin peak) in the transgenic mice is indicated by an arrow. (B) SPEP was performed with the sera of 18-mo-old mice (3 control and 11 hemizygous Eµ-bcl-b transgenic mice). The positions of albumin and the different globulins are indicated. (C) SPEP was performed on WT and hemizygous Eµ-bcl-b mice at the indicated age (months). The positions of albumin and the different globulins are indicated. (D) Densitometric analysis of albumin and γ-globulin in the sera of four Eµ-bcl-b mice was performed. Note the hypergammaglobulinemia and hypoalbumin-emia in hemizygous Eµ-bcl-b mice. (E) Sera from 18-mo-old WT (n = 15) or homozygous Eµ-bcl-b (n = 30) mice were analyzed by ELI SA. ***, P < 0.001; **, P < 0.01; *, P < 0.05 using a two-tailed Student’s t test for unpaired data. Results are expressed as the mean ± SD.
on July 25, 2016
jem.rupress.org
Downloaded from
Figure 4. Eµ-bcl-b mice exhibit an mRNA expression pattern that is compatible with the MM phenotype. Total RNA was obtained from sorted
medullar plasmocytes of 18-mo-old control WT mice (n = 4) and transgenic hemizygous Eµ-bcl-b developing myeloma (n = 4) mice. The mRNA expression levels of genes implicated in growth, PC differentiation, and bone resorption were analyzed by quantitative RT-PCR. The expression levels were normalized accordingly to the ubiquitin and β-actin housekeeping genes. Where indicated, the cumulative data ± SD from independent experiments are shown. ***, P < 0.001; **, P < 0.005; *, P < 0.05, using a two-tailed Student’s t test for unpaired data.
on July 25, 2016
jem.rupress.org
Figure 5. The malignant PCs of Eµ-bcl-b mice are serially transplantable and are sensitive to conventional MM therapies. Mononuclear cells
from the BM of either hemizygous 24-mo-old transgenic mice or control mice were isolated and injected i.v. into lethally irradiated syngeneic C57BL/6 mice. Two independent sets of recipient mice after a first and second serial transplant are represented. Transplanted mice were sacrificed at 3 mo. (A) The percentage of CD138+/B220− PCs in control or Eµ-bcl-b transplanted mice was determined by flow cytometry. (B) The presence of M-spike in the sera of
on July 25, 2016
jem.rupress.org
Downloaded from
tion, B cells first exhibited increased expression of B220 (low
to high) and next differentiated into B220+/CD138+ B cells
(Fig. S1). Plasmocyte differentiation was assessed by follow‑
ing the emergence of B220+/CD138+ B cells in control and
Eµ‑bcl‑b mice. LPS significantly increased the proportion of
B220+ B cells in transgenic mice (Fig. 6 B). Quantification of
CD138+ cells revealed the increased differentiation potential
of B cells isolated from Eµ‑bcl‑b mice (Fig. 6 C). Collectively, these data show that Bcl‑B favors plasmocyte differentiation. Expressions of Xbp‑1 and PRDM1 were also analyzed be‑ cause these transcription factors are known to be essential for plasmocyte differentiation. Xbp‑1 has also been reported to drive MM in a transgenic mouse model (Carrasco et al., 2007). Xbp‑1 and PRDM1 protein levels increased grad‑ ually during LPS‑induced plasmocyte differentiation and correlated with plasmocyte differentiation in Eµ‑bcl‑b mice (Fig. 6 D). CFSE staining experiments in splenocytes isolated from LPS‑treated wild‑type or Eµ‑bcl‑b mice showed that
differentiation of B cells (B220+/CD138−) into immature
plasmocytes (B220+/CD138+) was more efficient in trans‑
genic mice after 72 h. According to the release of CFSE, the
inactive B220low/CD138− B cell population and B220low/
CD138+ mature plasmocytes from transgenic mice exhibited
a strong increase in proliferative potential (Fig. 6 E). The pro‑
liferative potentials of active B220high/CD138− B cells and
immature B220high/CD138+ plasmocytes were slightly in‑
creased in the Eµ‑bcl‑b mice. Finally, we performed exper‑ iments to determine whether the ability of Bcl‑B to inhibit B cell death was responsible for increased differentiation, pro‑ liferation, and survival. In the absence of LPS, we detected a strong increase in plasmocyte cell death that was significantly lowered in Eµ‑bcl‑b, whereas LPS induced a significant de‑ crease in plasmocyte cell death in wild‑type mice (Fig. 6 F). In addition, we observed marginal propidium iodide staining of plasmocytes from Eµ‑bcl‑b mice, confirming the key role of Bcl‑B in the protection against cell death. Identical results were observed for B cells (Fig. 6 F). No protection against cell death was detected in splenic T cells from wild type and Eµ‑ bcl‑b that did not express Bcl‑B (Fig. 6 F). Globally, our data establish a specific role for Bcl‑B in the differentiation and proliferation of plasmocytes through inhibition of cell death.
DIS CUS SION
Molecular analysis of both mouse and human MM has un‑ derscored the important role of the antiapoptotic members of
the Bcl‑2 family in the pathogenesis of this disease. Among them, Bcl‑2 and Mcl‑1 expression levels have been reported to be increased in MM and to act as key factors in MM dis‑ ease progression and chemoresistance (Tu et al., 1998; Spets et al., 2002; Gomez‑Bougie et al., 2004; Wuillème‑Toumi et al., 2005; Bodet et al., 2011; Morales et al., 2011). In the present study, we examined a large panel of MM cell lines to deter‑ mine the expression of Bcl‑2, Mcl‑1, and Bcl‑B (Fig. 1, D and E). Importantly, Bcl‑B protein level was homogeneous in all of the MM cell lines tested. Moreover, we clearly demonstrated that Bcl‑B protein is highly overexpressed in plasmocytes iso‑ lated from MM patients compared with those isolated from either healthy controls or MGUS patients. These results sug‑ gest that, in addition to Bcl‑2 and Mcl‑1, Bcl‑B protein may likely be a new marker of MM.
Owing to the importance of Bcl‑2 members in the MM disease, several animal transgenic models were generated in which these antiapoptotic proteins were expressed in the B cell compartment. Enforced expression of Bcl‑2 and Mcl‑1 in B cells and hematopoietic cells, respectively, resulted in B cell malignancies displaying immature phenotype rather than MM (McDonnell and Korsmeyer, 1991; Zhou et al., 2001).
Because Bcl‑XL is one of the most potent prosurvival proteins
(Beverly and Varmus, 2009) and because Bcl‑XL is involved in
chemoresistance processes in MM (Tu et al., 1998), a 3′KE/
Bcl‑XL mouse model was engineered. Enforced expression of
Bcl‑XL in B cells at late stage resulted in nonmalignant PC
foci in the BM and soft tissues without affecting the life span of transgenic mice (Linden et al., 2004). When deregulation
of Bcl‑XL and of the c‑Myc oncogene was combined in the
B cell compartment (3′KE/Bcl‑XL/Ig‑Myc), mice developed
nonindolent PC tumors with short onset (135 d on average) and full penetrance (Cheung et al., 2004). These tumors pro‑ duced monoclonal Ig (IgG and IgM) and infiltrated BM as well as spleen. Moreover, PCs obtained from tissues with plas‑ macytosis were not transplantable into nude mice, suggesting that these cells had not yet undergone malignant transforma‑
tion. These results suggest that deregulation of Bcl‑XL either
alone or in combination with c‑Myc oncogene in the B cell compartment does not drive a complete MM‑like disease.
Of the different transgenic mice models expressing an antiapoptotic Bcl‑2 member alone or together with c‑MYC in the B cell compartment, the Eµ‑bcl‑b model described herein is the only one that recapitulates most of the main features of the human MM pathology: reduction of life span,
serially transplanted mice was determined by SPEP analysis. (C) Hemoglobin and hematocrit levels were measured on a Hemavet automated cell counter. The mean ± SD of three independent experiments is shown. (D) BM nucleated cells were isolated from 3-mo-old Eµ-bcl-b or WT secondary transplanted mice and were grown in semisolid methyl cellulose medium (5 × 10³ cells/ml). Colonies were detected after 14 d of culture by adding 1 mg/ml MTT reagent.
(E) Light microscopy images of colonies were also captured. Bars, 200 µm. (F) Colonies were counted using the ImageJ quantification software. (G) BM cells from Eµ-bcl-b mice were also maintained in culture in StemSpan SFEM medium supplemented with 1 ng/ml of recombinant mouse–IL-7, and the propor-tion of PCs was determined by flow cytometry. (H) BM cells from 24-mo-old control and hemizygous Eµ-bcl-b mice were isolated, and the percentage of plasmocytes (CD138+) was determined by cytometry. Then, mice were treated with either VEL CADE (0.5 mg/kg twice a week for 6 wk) or melphalan (1.25
mg/kg once a day for 5 wk). At the end of the experiment, mice were sacrificed and plasmacytosis was monitored by flow cytometry as described above. Where indicated, the cumulative data ± SD from independent experiments are shown. ***, P < 0.001, using a two-tailed Student’s t test for unpaired data.
on July 25, 2016
jem.rupress.org
Figure 6. Eµ-bcl-b splenic cells show increased cell proliferation and differentiation. (A) Splenic B cells from hemizygous Eµ-bcl-b and WT mice
were isolated and treated ex vivo for 1, 2, or 3 d with or without 8 µg/ml LPS. The cells were then harvested, and the number of B and T cells was deter-mined by flow cytometry using a B220 antibody. (B) Splenic cells from hemizygous Eµ-bcl-b or WT mice were treated as in A. The cells were then harvested,
on July 25, 2016
jem.rupress.org
Downloaded from
high penetrance of phenotype, indolent PC expansion re‑ stricted to the BM, monoclonal gammaglobulinemia for the great majority of the homozygous mice (M‑spike and unique IgG2b secretion), malignancy of the plasmocytes (transplantability into recipient mice), bone lytic lesions, renal immunoglobulin deposition, anemia, decreased albumin lev‑ els, and elevated expression of genes encoding proteins in‑ volved in MM pathogenesis.
Importantly, MM induction seems to be a unique fea‑ ture of Bcl‑B because the introduction of a prosurvival signal in the B cell compartment by other Bcl‑2 members, even
more robust (Eµ‑bcl‑2 or 3′KE/bcl‑xL) than the one induced
by Bcl‑B (Beverly and Varmus, 2009; Beverly et al., 2012), does not specifically lead to an MM‑like disease in mice.
From the M‑spike present in the sera of all the trans‑ genic mice tested (Fig. 3, B and C), it is obviously impossi‑ ble to extrapolate for a single VDJ rearrangement. However, (a) the ELI SA tests performed on a great number of trans‑ genic mice that specifically show the production of a unique monoclonal antibody (IgG2b), (b) the fact that Eµ‑bcl‑b mice always exhibit >10% tumoral plasmocytes, and (c) the clon‑ ality data presented in Table S3 argue strongly that Eu‑bcl‑b mice do develop an MM phenotype. In addition, SHM, a hallmark of MM, was also confirmed in a few mice (Table S3). The percentage of mutations was significantly higher in transgenic mice, and although we used a random polymerase for the assessment of the VDJ rearrangement, previous results from our team have shown a mean error of <0.3% using this polymerase, which is drastically lower than the frequency of mutation found in Eµ‑bcl‑b mice (unpublished data). These data convincingly show that Eµ‑bcl‑b mice display an MM phenotype that replicates accurately the human disease. An‑ other point of the present study is the specific expression of IgG2b by all Eµ‑bcl‑b homozygous mice. Despite the fact that around 10–15% of all human MM secrete this specific isotype, we found no likely reason either in the literature or in questioning experts in the field that could explain such a selective IgG2b expression.
Of note, the vk‑Myc mouse model of MM, in which the activation of c‑Myc oncogene occurs sporadically through‑ out the physiological SHM process, shares many common features with our Eµ‑bcl‑b mice. This model fulfills most of the biological and genetic criteria of an ideal mouse model of MM. Authors (Chesi et al., 2008) have argued that c‑myc
activation could be the secondary event that further increases cell proliferation. One hypothesis could be that deregulation of Bcl‑B in plasmocytes might represent an important pri‑ mary prosurvival event necessary for the initiation of MM pathogenesis. This hypothesis is supported by the gene tran‑ scription profile that showed an increase of c‑myc mRNA in plasmocytes isolated from Eµ‑bcl‑b mice compared with control mice (Fig. 4). Table S4 summarizes the characteristics of the different MM‑like mouse models previously generated. Compared with other prosurvival Bcl‑2 proteins, it was recently confirmed that Bcl‑B has the narrowest capacity to bind proapoptotic proteins (Bax, Bik, and Bim), highlighting a more specialized role in the apoptosis signaling (Rautureau et al., 2012). The proapoptotic Bcl‑2 protein Bim was re‑ ported to be essential for the maintenance of B cell homeo‑ stasis (Oliver et al., 2006; Huntington et al., 2009) through the elimination of autoreactive B cells (Enders et al., 2003; Fischer et al., 2007) and through its contribution to the dif‑ ferentiation of B cells into PCs (Gao et al., 2012). Moreover, expression of Bim and its association with the antiapoptotic Bcl‑2 members was also described as an important factor for the survival of Myeloma cells (Gomez‑Bougie et al., 2004; Romagnoli et al., 2009; Morales et al., 2011) and for the pre‑ dicted response to chemotherapy agents. Thus, the specific and potent inhibition of Bim‑induced cell death by Bcl‑B could partially explain why Eµ‑bcl‑b mice develop charac‑ teristic features of human MM.
In this context, a recent study suggested that the anti‑ apoptotic potency of Bcl‑2 proteins relies on their stability rather than their binding selectivity (Rooswinkel et al., 2014). Several studies are currently underway to better understand the mode of regulation of the Bcl‑B protein in cells. Recent reports showed that ubiquitination and proteasomal turnover dictate the expression level of the Bcl‑B protein and thereby its antiapoptotic activity (Beverly et al., 2012; van de Kooij et al., 2013; Rooswinkel et al., 2014). This work is in agreement with an alternative posttranslational stabilization mechanism as the main mode of Bcl‑B regulation in MM. Using CHX, a protein synthesis inhibitor, we recently measured the sta‑ bility of the Bcl‑B protein in several non‑MM and MM cell lines (unpublished data). We evaluated that the half‑life of the
Bcl‑B protein in HeLa cells is ∼3 h, which is consistent with
previous studies describing Bcl‑B as an unstable protein (Bev‑ erly et al., 2012; van de Kooij et al., 2013). In contrast, in MM
and the percentages of inactive B cells (B220low/CD138−), active B cells (B220High/CD138−), and immature/mature PCs (CD138+) were determined by flow
cytometry using B220 and CD138 antibodies. (C) The graph represents a quantification of the CD138-positive PCs after LPS treatment. (D) Splenic B cells from hemizygous Eµ-bcl-b and WT mice were treated as in A. The cells were then collected, washed, and lysed, and total protein extracts were subjected to SDS-PAGE/immunoblot using Bcl-B, Xbp-1, PRDM1, and Hsp60 antibodies. (E) Splenic B cells from hemizygous Eµ-bcl-b and WT mice were isolated and stained with CFSE dye. After 24 h, the cells were stimulated with 8 µg/ml LPS for 72 h to induce plasmocyte differentiation. The proliferative potentials of the different living populations (inactive B cells [B220low/CD138−], active B cells [B220High/CD138−], immature PCs [B220+/CD138+], and mature PCs (B220−/
CD138+]) were determined by flow cytometry. (F) Splenic B cells from hemizygous Eµ-bcl-b and WT mice were treated as in A. Unstimulated cells (top) or
LPS-stimulated cells (bottom) were harvested, washed, and labeled using B220 and CD138 antibodies as well as propidium iodide (PI). The percentage of dead cells (PI positive) was measured by flow cytometry. Where indicated, the cumulative data ± SD from three independent experiments are shown. **, P < 0.01; *, P < 0.05, using a two-tailed Student’s t test for unpaired data.
on July 25, 2016
jem.rupress.org
cells, Bcl‑B remains stable at 24 h, suggesting an abnormal sta‑ bility of this protein in this pathological context. Thus, even if the abnormal stability of the Bcl‑B protein in MM appears to be a cause of its overexpression, the exact mechanism remains to be clarified and will be the object of future studies.
Importantly, Eµ‑bcl‑b mice exhibit elevated expression of genes encoding proteins involved in MM pathogenesis that may contribute to the MM phenotype. A dedicated transcrip‑ tional profile of Eµ‑bcl‑b BM plasmocytes showed increased expression of proto‑oncogenes (ccnd2, c‑myc, c‑maf, and c‑jun) that are well reported to be deregulated in the human MM (Claudio et al., 2002; Davies et al., 2003), therefore con‑ firming the tumorigenic nature of the PCs we observed in our MM mouse model. The transcription factor xbp‑1, required for PC proliferation and differentiation, was also induced in transgenic mice (Carrasco et al., 2007). This positive modu‑ lation is in agreement with the exacerbated proliferation and differentiation potential we observed in the B lymphocytes and plasmocytes of our mouse model. We also observed in Eµ‑bcl‑b mice an increased expression of cytokines required for the survival and proliferation of PCs (il‑6, il‑7, and igf‑1) and factors involved in osteoclastogenesis, including trap, rank, and rank‑l. Among them, IL‑6 and IGF‑1 were obviously re‑ ported to be crucial for the survival and the proliferation of myeloma cells (Gaillard et al., 1997; Sprynski et al., 2009). IL‑6 and IL‑7, which are excessively secreted by tumor PCs, were also described to induce rank‑l expression via stromal cells and thereby promote osteoclastogenesis (Giuliani et al., 2002). This perturbation of bone homeostasis is associated with the devel‑ opment of osteolytic lesions and the loss of bone volume ob‑ served in MM patients (Hjertner et al., 2006). Thus, increased mRNA expression of il‑6, il‑7, rank, and rank‑l in our MM model is compatible with the bone lytic lesions we underlined. In summation, this gene network, which includes proto‑onco‑ genes, master transcription factors involved in plasmocyte dif‑ ferentiation, cytokines implicated in plasmocyte survival, and proliferation and bone resorption factors, coincides strongly with the MM phenotype of our Eµ‑bcl‑b mice.
In conclusion, we report here that the Eµ‑bcl‑b trans‑ genic mouse is a relevant model of human MM that accu‑ rately recapitulates the pathogenesis of this hematopoietic malignancy. Our data also underscore an as of yet uniden‑ tified role for Bcl‑B in B cell proliferation and plasmocyte differentiation through its ability to impair B cell death and drive MM progression. High levels of Bcl‑B protein were also observed in patients with MM but not in healthy controls or patients with MGUS. As this model recapitulates accurately the human disease and is readily transplantable in secondary recipients, it represents a pertinent tool to validate new po‑ tential therapies for MM patients.
MAT ERI ALS AND MET HODS Eµ-bcl-b transgenic mice
To drive the expression of the Bcl‑B protein in B cells, we used the pBlueScript II vector containing a mouse variable chain
enhancer, a promoter (Eµ), a fragment of the rabbit β‑globin
gene, and a polyadenylation signal sequence. The Myc‑tagged bcl‑b cDNA was amplified by PCR from the corresponding pcDNA3 plasmid (Luciano et al., 2007) using the following
primers: forward 5′‑ATACTC GAGATG GAA CAG AAA CTC
ATC TCT‑3′ and reverse 5′‑ATACTC GAGTCA TAA TAA
TCG TGT CCA GAG‑3′. Each primer contains an Xho1 re‑
striction site. The pBlueScript–Myc‑bcl‑b vector was obtained by subcloning the Xho1‑digested Myc‑bcl‑b PCR fragment into the Xho1‑digested pBlueScript vector. After sequenc‑ ing, the vector sequence was excised by SacI–KpnI digestion, and the resulting linearized and purified sequence was micro‑ injected into pronuclei obtained from B6D2 mice (Service d’Experimentation Animale et de Transgénèse [SEAT], CNRS, Villejuif, Paris, France). Transgenic founders were crossed with C57BL/6N mice to generate lines. F1 transgenic progeny were crossed with C57BL/6N mice to maintain the lines, and the mice were kept in specific pathogen–free conditions at the C3M facility for all subsequent analyses. The described pheno‑ type of the Eµ‑bcl‑b mice was maintained through at least 10 generations. Screening of the transgenic mice was performed
by PCR analysis using a set of bcl‑b–specific primers (5′‑GCC
AAC CTT TGT TCA TGGC‑3′ and 5′‑GTG GTG ACG CTC
GTG ACC‑3′), and the expression of the Bcl‑B protein was
confirmed by Western blot analysis of various tissues using an anti–Bcl‑B antibody (compare Table S1).
For the survival experiments, the mice were aged until they showed evident signs of tumors and/or discomfort and subsequently sacrificed. Sibling control mice were sacrificed at the same time or allowed to age further. Necropsy was performed to assess the presence of phenotypic abnormalities. Statistical analysis was performed using Prism software (Graph‑ Pad Software). Survival curves were generated using the Ka‑ plan‑Meier method. All animal studies and experiments were performed with the approval of the Comité Institutionnel d’Ethique Pour l’Animal de Laboratoire (CIE PAL) and were in agreement with all regulatory standards. After the eradication of all our mice, the Eµ‑bcl‑b strain has been now rederived (JAN VIER Labs; project number 15.355), so that this model will be fully available for the scientific community in 2017.
Cell lines
The human MM cell lines U266, MM1.S, NCI‑H929, RPMI8226, ARH‑77, AF‑10, and OPM2 were purchased from ATCC. The LP‑1 cell line was obtained from DSMZ. The JIM3, XG‑1, XG‑2, XG‑5, XG‑7, MDN, JIM‑3, Nan‑1, Nan‑3, Nan‑8, BCN, and SBN cell lines were provided by M. Amiot (INS ERM U892, Nantes, France). All cells were cultured in RPMI‑1640 medium containing 10% fetal bo‑ vine serum, 50 U/ml penicillin, 50 mg/ml streptomycin, and 1 mM sodium pyruvate (Gibco).
Western blot analysis
Whole cell extracts from BM, splenocytes, snap‑frozen tissues, and MM cell lines were lysed at 4°C in lysis buffer (50 mM
on July 25, 2016
jem.rupress.org
Downloaded from
Hepes, pH 7.4, 150 mM NaCl, 20 mM EDTA, 100 µM NaF,
10 µM Na3VO4, 1 mM PMSF, 10 mg/ml leupeptin, 10 mg/ml
aprotinin, and 1% Triton X‑100). The lysates were centrifuged at 16,000 g for 15 min at 4°C, and the supernatants were sup‑ plemented with SDS sample buffer. A total of 30 µg of proteins was separated on a 12% SDS–polyacrylamide gel and trans‑ ferred onto PVDF membranes (GE Healthcare) in 20 mM Tris, 150 mM glycine, and 20% ethanol buffer. After blocking nonspecific binding sites in saturation buffer (50 mM Tris, pH 7.5, 50 mM NaCl, 0.15% Tween, and 5% BSA), the membranes were probed with primary antibodies (compare with Table S1) according to standard procedures. The membranes were then washed three times using TNA–1% NP‑40 (50 mM Tris, pH 7.5, and 150 mM NaCl) and incubated further for 1 h with HRP‑conjugated antibodies. Bound immunoglobulins were detected using ECL detection solution (GE Healthcare).
Flow cytometry
Single‑cell suspensions from spleens, thymuses, and BM were collected, and red blood cells were lysed by ammonium
chloride treatment (Sigma‑Aldrich). 106 cells were washed
in PBS (0.5% BSA and 2 mM EDTA) and stained for 30 min on ice with a combination of the indicated antibodies (compare with Table S1). Then, the cells were washed twice and resuspended in PBS (0.5% BSA and 2 mM EDTA). Multicolor flow cytometric analysis was performed using a MAC SQuant cytometer (Miltenyi Biotec) and analyzed with MAC SQuant software.
Isolation of PCs from patients
CD138+ BM cells were isolated from patients using magnetic
CD138 microbeads (Miltenyi Biotec) according to the man‑ ufacturer’s instructions. In brief, patient samples were col‑ lected in tubes containing EDTA. Then, the cells were passed through a filter (100‑µm pore size) to remove bone fragments or cell clumps. The cells were then centrifuged at 445 g for 10 min at room temperature in a swinging bucket rotor with the brake off. The supernatant was aspirated, and the cells were incubated with 50 µl of whole blood CD138 microbeads per 1 ml of anticoagulated BM for 15 min at 4°C. The cells were then washed and resuspended in autoMACS running buffer. The magnetic separation was performed using the Possel WB program on the autoMACS Pro Separator. The purity of the isolated PCs was assessed by flow cytometry using an anti– human CD138 antibody (compare with Table S1).
Treatment of Eµ-bcl-b mice with VEL CADE and melphalan
Eµ‑bcl‑b mice with significant plasmacytosis (>15%) were selected for drug treatment (five mice per group). 0.5 mg/ kg VEL CADE was given twice a week for 6 wk. 1.25 mg/ kg melphalan was given once a day (5 d per week) for 5 wk. Treatments with VEL CADE and melphalan were adminis‑ trated intraperitoneally with insulin syringe. At the end of the experiment, mice were sacrificed, and the BM plasmacytosis was quantified by flow cytometry.
Isolation of PCs from mice
The isolation of mouse PCs was performed with a CD138+
PC isolation kit (Miltenyi Biotec) according to the manufac‑ turer’s instructions. In brief, cells were extracted from tibia and femora of either Eµ‑bcl‑b or control mice, and the isolation of mouse PCs was performed in a two‑step procedure. First, non‑PCs were magnetically labeled with a cocktail of bio‑ tin‑conjugated antibodies (CD49b and CD45R) and anti‑bi‑ otin microbeads. Cells were then separated with autoMACS Separator (program Depl025). In the second step, PCs con‑ tained in the negative fraction were directly labeled with CD138 microbeads and isolated by positive selection (program Posseld2). The purity of the isolated PCs was assessed by flow cytometry using anti–mouse CD138 and B220 antibodies.
Ex vivo culture of splenocytes
8–10‑wk‑old WT or Eµ‑bcl‑b mice were euthanized, and sin‑ gle‑cell splenocyte suspensions were obtained by dissociation of the corresponding spleen. After red blood cell lysis with ammonium chloride (Sigma‑Aldrich), the splenocytes were
counted and plated at a density of 5 × 10⁵ cells/ml in sple‑
nocyte medium (RPMI‑1640 medium containing 10% fetal bovine serum, 50 U/ml penicillin, 50 mg/ml streptomycin, 1 mM sodium pyruvate, and 50 µM 2‑ME). Then, the sple‑ nocytes were incubated with 8 µg/ml LPS serotype B4 (Sig‑ ma‑Aldrich). The experiment was terminated after 1, 2, or 3 d.
In vitro proliferation assay
B220+ splenocytes were incubated with 5 µM Cell Trace CFSE
(Invitrogen) for 15 min at 37°C according to the manufactur‑ er’s instructions. Then, the cells were washed and plated in the splenocyte medium described in the previous section. After 18 h, the cells were washed and plated in the same medium in the presence or absence of 8 µg/ml LPS and grown for 1, 2, or 3 d. The cells were then harvested and washed, and B cells were phenotyped using anti–mouse B220 and anti–mouse CD138 antibodies (compare Table S1). In parallel, the prolifer‑ ative potential (as measured by CFSE release) of the different living populations was determined by flow cytometry.
Colony formation assay
BM nucleated cells were isolated from the femora and tibia of Eµ‑bcl‑b or WT recipient mice. After red blood cell lysis with ammonium chloride (Sigma‑Aldrich), BM cells were
grown in semisolid methyl cellulose medium (0.5 × 10³ cells/
ml; MethoCult M3630; STE MCE LL Technologies). Colo‑ nies were visualized after 14 d of culture by adding 1 mg/ml 3‑(4,5‑dimethylthiazol‑2‑yl)‑2,5‑diphenyltetrazolium bro‑ mide (MTT) reagent and were counted using the ImageJ quantification software (National Institutes of Health).
Ex vivo culture of BM cells
BM nucleated cells were isolated from the femora and tibia of Eµ‑bcl‑b or WT recipient mice. After red blood cell lysis with ammonium chloride (Sigma‑Aldrich), the BM cells
on July 25, 2016
jem.rupress.org
were counted and plated at a density of 5 × 10⁵ cells/ml in StemSpan SFEM medium (STE MCE LL Technologies) sup‑ plemented with 1 ng/ml recombinant mouse–IL‑7 (Miltenyi Biotec). Cells were maintained in culture for 14 d.
Quantitative reverse transcription PCR
Total RNA was prepared from the BM cells of 18‑mo‑old transgenic mice or their control littermates using TRIzol re‑ agent according to the manufacturer’s instructions (Invitro‑ gen). Total RNA (1 µg) was reverse transcribed into cDNA using Superscript II reverse transcription (Invitrogen). Quan‑ titative PCR was performed using 100 ng cDNA and Power SYBR Green PCR Master Mix (Applied Biosystems). Each sample was run in triplicate in a Step One Plus Real‑Time PCR System (Applied Biosystems). The primers used are listed in Table S2. The expression levels were normalized to
that of the ubiquitin and β‑actin housekeeping genes. The
results were analyzed using the comparative 2−ΔΔCt method,
with WT expression normalized to 1.
IgVH rearrangement and SHM analysis
The rearranged immunoglobulin variable heavy‑chain re‑ gion (IgVH) genes were amplified from DNA isolated from purified tumor and normal PCs by PCR. Forward primers that anneal to framework region III of the most abundantly used Igh‑VJ558 and Igh‑V7183 were used in separate reac‑ tions (covering >80% of the rearrangements) along with a reverse primer downstream of JH4. Immunoglobulin kappa light (IgK) chain rearrangements were PCR amplified using VK consensus primers and a reverse primer downstream of JK5. The PCR conditions were 40 cycles of 95°C for 30 s, 60°C for 45 s, and 72°C for 90 s. PCR products indicative of clonal rearrangements were gel purified using the Wizard Gel and PCR clean‑up kit (Promega) and were sequenced directly using the same primers as in the PCR reaction and then further cloned using the PGEm‑T Easy kit (Promega). 5–10 clones were sequenced for each PCR fragment to evaluate the clonal dominance of a given rearrangement. To determine IgV rearrangement and calculate the mutation frequency, sequences were aligned to the NCBI databases (IgBlast) and confirmed using the international ImMunoGe‑ neTics information system (IMGT) database. PCR for IgH and IgK was repeated two or three times for each sample to confirm the presence of dominant PCR fragments in tumors and of polyclonal patterns in WT PCs. As a control, DNA extracted from mouse normal PCs were analyzed in parallel to calculate the SHM rate.
X-ray analysis, TRAP staining, histopathology, and immunohistochemistry
Bone x‑ray radiography was performed on aged WT and Eµ‑ bcl‑b freshly isolated non‑decalcified femurs using the Fax‑ itron x‑ray Edimex System and AGFA HDR 37F9H films.
Kidneys were fixed in 4% paraformaldehyde for 2 h at room temperature and then overnight at 4°C. Fixed tissues
were embedded into optimal cutting temperature media (OCT) and frozen in liquid nitrogen. OCT blocks con‑
taining the tissues were stored at −80°C until they were
sectioned. Using a Leica cryostat CM350 (C3M histol‑ ogy facility, Nice), 10‑ to 15‑µm sections were collected. The tissue sections were incubated for 1 h with 1% Congo red solution, rinsed in water, and cleared in alkaline alco‑ hol until a clear background was obtained. Nuclei were then labeled with Harris hematoxylin for 30 s and rinsed in running water for 5–10 min. Sections were mounted in glycerol‑based solution, and brightfield and polarized images were acquired on a Leica DM5500B microscope equipped with a polarizer and a color camera (C3M light microscopy facility, Nice).
Femurs were fixed and decalcified in Bouin’s fixative solution (Labonord). After decalcification, the bones were de‑ hydrated through a graded alcohol series and xylene and sub‑ sequently embedded in paraffin. 5‑µm sections were cut and stained with hematoxylin and eosin (H&E). Immunohisto‑ chemistry was performed using a BenchMark XT Automated IHC Slide Staining System (Ventana; Roche) according to standard procedures. Dewaxed tissue sections were stained using an anti–mouse CD138 rat polyclonal antibody followed sequentially by mouse anti–rat biotinylated and streptavidin HRP antibodies (compare with Table S1).
TRAP staining
Femora were fixed in 4% paraformaldehyde for 24 h at 4°C, decalcified in 10% EDTA for 10 d at 4°C, and incubated over‑ night in a 30% sucrose solution, and 7‑µm sections were ob‑ tained with a cryotome (Shandon; Thermo Fisher Scientific). Bone sections were stained for TRAP activity using a leuko‑ cyte acid phosphatase kit (Sigma‑Aldrich) and hematoxylin, and staining was visualized by light microscopy (Palm Micro Beam; ZEI SS). TRAP staining was analyzed in the trabecu‑ lar zone of the femora as described (Mansour et al., 2011): images were analyzed using ImageJ software (W. Rasband, National Institutes of Health Image System) to define the areas corresponding to TRAP staining. These areas were nor‑ malized to the bone areas.
Hemoglobin, paraprotein (SPEP), and immunoglobulin measurement
Peripheral blood from WT and Eµ‑bcl‑b mice was collected into tubes containing EDTA (Greiner Bio‑One). Hemoglo‑ bin levels were measured on a Drew Hemavet 950FS and compared using the two‑tailed Student’s t test for unpaired data. For paraprotein measurement, the mice were bled by tail grazing. Then, the blood was collected, and the sera were harvested after blood coagulation and centrifugation for 10 min at 1,000 g. The sera were diluted 1:2 in barbital buffer (60 mM Tris, 10 mM barbital, 50 mM Na‑diethyl‑barbituric acid, 0.5 µM thimerosal). Then, the sera were loaded onto gels and separated by electrophoresis (1% agarose [Euromedex] polymerized in barbital buffer). The gels were stained with
on July 25, 2016
jem.rupress.org
Downloaded from
amido black and destained with acetic acid. For immunoglob‑ ulin measurement, the sera were diluted 1:50, and the total Ig concentrations were determined using an Ig subtype–spe‑ cific ELI SA quantification kit (Thermo Fisher Scientific). It has been reported that some anti‑IgG2a could cross‑react with IgG2c. Nevertheless, there was no difference between IgG2a expression between WT and transgenic mice, ruling out the possibility of an increased expression of IgG2c. This means that IgG2b is the only monoclonal antibody overex‑ pressed in the Eµ‑bcl‑b mice.
BM transplantation
BM nucleated cells were isolated from Eµ‑bcl‑b or WT femora and tibia donor mice. Then, 20 million cells were resuspended in 100 µl PBS and transplanted by i.v. injec‑ tion into the tails of 10‑wk‑old WT C57BL/6 recipient mice irradiated with 7Gy.
Statistical analysis
The results are expressed as the mean ± SD. The data were compared by one‑way ANO VA and Student’s t tests, and the Bonferroni correction was applied used GraphPad Prism software. Statistical significance was established at ***, P < 0.0001; **, P < 0.01; *, P < 0.05. Survival rates were com‑ pared with the Kaplan‑Meier method using Prism software.
Study approval
BM samples from healthy, MGUS, or myeloma patients were obtained from the Internal Medicine or Hematology Depart‑ ments of the Centre Hospitalier Universitaire de Nice after informed consent was obtained (clinical trial NCT01270009). Mouse experiments were approved by the Institutional Ani‑ mal Care and Use committee of the University of Nice So‑ phia‑Antipolis (Nice, France).
Online supplemental material
Fig. S1 shows a schematic representation of B cell activation and differentiation after LPS stimulation. Table S1 shows a list of antibodies used for flow cytometry, Western blot, and immunochemistry. Table S2 shows a list of primers used for quantitative PCR. Table S3 shows IgH and IgK gene rearrangement and somatic mutations in mouse tumors. Table S4 shows a comparison of the biological and clinical features of available MM mouse models. Online supplemental material is available at http ://www .jem .org /cgi /content /full /jem .20150983 /DC1.
ACK NOW LED GME NTS
We are grateful to our clinician colleagues from the Centre Hospitalier Universitaire de Nice. We also sincerely thank all patients enrolled in this study. We greatly ac-knowledge the C3M imaging core facility (Microscopy and Imaging Platform Côte d’Azur, Mica) and the C3M animal facility.
This work was supported by the Ligue Nationale Contre le Cancer (Equipe Label-lisée grant R08001AA), the Fondation de France (grant R08080AA), and an ARC Foun-dation program (grant PGA120140200777) and an ARC project (2015–2016). This work was also funded by the French government (French National Research Agency,
ANR) through the “Investments for the future” LAB EX SIG NAL IFE: program reference #ANR-11-LABX-0028-01.
The authors declare no competing financial interests.
Submitted: 12 June 2015 Accepted: 6 June 2016
REFERENCES
Adams, J.M., and S. Cory. 1998. The Bcl‑2 protein family: arbiters of cell survival. Science. 281:1322–1326. http ://dx .doi .org /10 .1126 /science .281 .5381 .1322
Beverly, L.J., and H.E. Varmus. 2009. MYC‑induced myeloid leukemogenesis is accelerated by all six members of the antiapoptotic BCL family.
Oncogene. 28:1274–1279. http ://dx .doi .org /10 .1038 /onc .2008 .466
Beverly, L.J., W.W. Lockwood, P.P. Shah, H. Erdjument‑Bromage, and H. Varmus. 2012. Ubiquitination, localization, and stability of an anti‑ apoptotic BCL2‑like protein, BCL2L10/BCLb, are regulated by Ubiquilin1. Proc. Natl. Acad. Sci. USA. 109:E119–E126. http ://dx .doi .org /10 .1073 /pnas .1119167109
Bodet, L., P. Gomez‑Bougie, C. Touzeau, C. Dousset, G. Descamps, S. Maïga, H. Avet‑Loiseau, R. Bataille, P. Moreau, S. Le Gouill, et al. 2011. ABT‑ 737 is highly effective against molecular subgroups of multiple myeloma.
Blood. 118:3901–3910. http ://dx .doi .org /10 .1182 /blood ‑2010 ‑11 ‑317438
Borson, N.D., M.Q. Lacy, and P.J. Wettstein. 2002. Altered mRNA expression of Pax5 and Blimp‑1 in B cells in multiple myeloma. Blood. 100:4629– 4639. http ://dx .doi .org /10 .1182 /blood .V100 .13 .4629
Boylan, K.L., M.A. Gosse, S.E. Staggs, S. Janz, S. Grindle, G.S. Kansas, and B.G. Van Ness. 2007. A transgenic mouse model of plasma cell malignancy shows phenotypic, cytogenetic, and gene expression heterogeneity similar to human multiple myeloma. Cancer Res. 67:4069–4078. http :// dx .doi .org /10 .1158 /0008 ‑5472 .CAN ‑06 ‑3699
Carrasco, D.R., G. Tonon, Y. Huang, Y. Zhang, R. Sinha, B. Feng, J.P. Stewart, F. Zhan, D. Khatry, M. Protopopova, et al. 2006. High‑resolution genomic profiles define distinct clinico‑pathogenetic subgroups of multiple myeloma patients. Cancer Cell. 9:313–325. http ://dx .doi .org /10 .1016 /j .ccr .2006 .03 .019
Carrasco, D.R., K. Sukhdeo, M. Protopopova, R. Sinha, M. Enos, D.E. Carrasco, M. Zheng, M. Mani, J. Henderson, G.S. Pinkus, et al. 2007. The differentiation and stress response factor XBP‑1 drives multiple myeloma pathogenesis. Cancer Cell. 11:349–360. http ://dx .doi .org /10 .1016 /j .ccr .2007 .02 .015
Chesi, M., D.F. Robbiani, M. Sebag, W.J. Chng, M. Affer, R. Tiedemann, R. Valdez, S.E. Palmer, S.S. Haas, A.K. Stewart, et al. 2008. AID‑dependent activation of a MYC transgene induces multiple myeloma in a conditional mouse model of post‑germinal center malignancies. Cancer
Cell. 13:167–180. http ://dx .doi .org /10 .1016 /j .ccr .2008 .01 .007
Cheung, W.C., J.S. Kim, M. Linden, L. Peng, B. Van Ness, R.D. Polakiewicz, and S. Janz. 2004. Novel targeted deregulation of c‑Myc cooperates with Bcl‑XL to cause plasma cell neoplasms in mice. J. Clin. Invest. 113:1763–
1773. http ://dx .doi .org /10 .1172 /JCI200420369
Claudio, J.O., E. Masih‑Khan, H. Tang, J. Gonçalves, M. Voralia, Z.H. Li, V. Nadeem, E. Cukerman, O. Francisco‑Pabalan, C.C. Liew, et al. 2002. A molecular compendium of genes expressed in multiple myeloma. Blood. 100:2175–2186. http ://dx .doi .org /10 .1182 /blood ‑2002 ‑01 ‑0008 Cluzeau, T., G. Robert, N. Mounier, J.M. Karsenti, M. Dufies, A. Puissant,
A. Jacquel, A. Renneville, C. Preudhomme, J.P. Cassuto, et al. 2012. BCL2L10 is a predictive factor for resistance to azacitidine in MDS and AML patients. Oncotarget. 3:490–501. http ://dx .doi .org /10 .18632 /oncotarget .481
Davies, F.E., A.M. Dring, C. Li, A.C. Rawstron, M.A. Shammas, S.M. O’Connor, J.A. Fenton, T. Hideshima, D. Chauhan, I.T. Tai, et al. 2003.
on July 25, 2016
jem.rupress.org