HAL Id: inserm-00390621
https://www.hal.inserm.fr/inserm-00390621
Submitted on 2 Jun 2009
HAL is a multi-disciplinary open access
archive for the deposit and dissemination of sci-entific research documents, whether they are pub-lished or not. The documents may come from teaching and research institutions in France or abroad, or from public or private research centers.
L’archive ouverte pluridisciplinaire HAL, est destinée au dépôt et à la diffusion de documents scientifiques de niveau recherche, publiés ou non, émanant des établissements d’enseignement et de recherche français ou étrangers, des laboratoires publics ou privés.
Socioeconomic position and cognitive decline using data
from two waves: what is the role of the wave 1 cognitive
measure?
Aline Dugravot, Alice Guéguen, Mika Kivimaki, Jussi Vahtera, Martin Shipley, Michael Marmot, Archana Singh-Manoux
To cite this version:
Aline Dugravot, Alice Guéguen, Mika Kivimaki, Jussi Vahtera, Martin Shipley, et al.. Socioeconomic position and cognitive decline using data from two waves: what is the role of the wave 1 cognitive measure?. J Epidemiol Community Health, 2009, 63 (8), pp.675-80. �10.1136/jech.2008.081281�. �inserm-00390621�
Socioeconomic position and cognitive decline using data from 2 waves:
What is the role of the wave 1 cognitive measure?
Aline Dugravot 1 Alice Guéguen 1 Mika Kivimaki 2 Jussi Vahtera 3 Martin Shipley 2 Michael G. Marmot 2 Archana Singh-Manoux 1,2,4* *Corresponding author & address 1INSERM, U687-IFR69
Hôpital Paul Brousse ; Bâtiment 15/16 16 Avenue Paul Vaillant Couturier 94807 Villejuif Cedex, France Telephone: +33 (0)1 77 74 74 10 Fax: +33 (0)1 77 74 74 03
Email: [email protected]
2Department of Epidemiology and Public Health
University College London, United Kingdom
3Finnish Institute of Occupational Health, Helsinki, Finland 4Centre de Gérontologie, Hôpital Ste Périne, AP-HP, France
ABSTRACT
Background
: Analysis of change in health status using data from two waves can be examined either adjusted or unadjusted for baseline health status. We assess the effect of socioeconomic position (SEP) on cognitive change using both these strategies and discuss the implications of the analyses.Methods:
Data come from 1261 men and 483 women of the Whitehall II cohort study, aged 50-55 years at wave 1. Cognition was assessed at both waves using a test of verbal memory, and two tests of verbal fluency. Analysis of Variance (ANOVA) was used to estimate the effect of SEP on change score and analysis of covariance (ANCOVA) to estimate this effect adjusted for the baseline cognitive score. Then the ANCOVA estimates were corrected for bias due to measurement error (estimated based on 3-month test-retest). Finally, ANCOVA estimates were examined for increasing levels of measurement error.Results:
The results of the ANOVA suggest no effect of SEP on cognitive decline. In contrast, the ANCOVA suggests significantly greater cognitive decline in the lower SEP groups. However, the ANCOVA estimates for the effect of wave 1 cognition show evidence for regression to the mean due to the presence of measurement error. The corrected ANCOVA estimates show no association between SEP and cognitive decline.Conclusions:
We recommend caution when using ANCOVA, or adjustment for baseline, in the analysis of change using two waves of observational data.INTRODUCTION
Socioeconomic position (SEP), assessed by education, occupation or income, has been shown to be associated with cognition.[1 2 3 4] There is also evidence to suggest that SEP is associated with cognitive decline, but most of this research is on the elderly.[3 5 6 7 8 9] Recent research suggests that midlife is a critical period for cognition,[10] adding to previous work that show some decline in cognition already in midlife.[11] However, it remains unclear whether SEP influences cognitive decline in midlife.
It is widely accepted that the analysis of change is best examined using longitudinal models with multiple repeated measures.[12] However two-wave data are more widely available than multiple-wave data, with the difference between the two measures used to define decline, or change. There are at least two widely used analytical strategies to examine change using data from two waves. Both approaches attempt to address the same causal question, namely the extent to which changes in the exposure results in changes in the
outcome measure. The first approach consists of regressing the change score on the predictor. This is equivalent to analysing the change score using analysis of variance (ANOVA). When the predictor has only two levels this is also equivalent to performing a t-test between the two levels of the predictor. The second strategy consists of regressing the wave 2 measure on the wave 1 measure and the predictor in an analysis of covariance (ANCOVA). Inconsistency in the results from these two approaches is often observed in observational studies and is known as the Lord’s Paradox.[13 14] In fact, these two approaches estimate statistical parameters that correspond to the causal question mentioned above under slightly different sets of
assumptions.[15 16] The first approach estimates the crude or the unconditional effect of the predictor on the change score. The second approach provides a conditional effect of the predictor on change, the condition being that the wave 1 outcome is similar in all predictor groups. In practice, both ANOVA and ANCOVA analyses are often carried out by using least squares regression which provides a more flexible method of analysis and can easily
incorporate further control and adjustment for other baseline covariates.
In regression analysis the independent variable is assumed to be measured without error. Cognitive test scores are an imprecise measure of true cognitive function and are likely to be measured with some error. ANCOVA involves including the baseline cognitive score as an independent variable, contributing in some cases to bias in the ANCOVA estimates for the effect of SEP on cognition. More precisely, measurement error in the wave 1 cognition score results in an attenuation of its estimated effect on wave 2 cognition score.[17 18] If the wave 1 cognitive score in ANCOVA is related to the predictor, then the estimation of the effect of the predictor will be biased.[19 20 21] However, including the wave 1 cognitive score in ANCOVA when it is
not
related to the predictor does not bias the effect of the predictor on wave 2 cognitive score. Under this condition, the ANCOVA provides a more precise estimate of the effect of the predictor compared to the ANOVA,[22 23] making it particularly suitable to randomized controlled trials and other situations when there is no association between the predictor and the wave 1 value of the outcome measure.[23] However, when the predictor and wave 1 outcome measure are associated, there are various methods to correct estimatesderived from ANCOVA for the effects of measurement error.[20 24 25]
Research on cognitive decline using data from two waves is widespread.[3 6 8 26 27 28 29] In general terms, little attention has been paid to the implications of the analytical strategy. The objective of our study is to examine the effect of SEP on cognitive change in midlife using data from two waves, separated by 5 years. We estimate and compare the effect of SEP on cognitive change using the ANOVA and the ANCOVA approaches outlined above. A further objective is to examine whether the ANCOVA estimates corrected for bias due to measurement error allows judgements to be made about the estimated effect of SEP on cognitive decline in midlife.
METHODS
Data were drawn from the Whitehall II study, established in 1985 as a longitudinal study to examine the socioeconomic gradient in health and disease among 10308 civil servants (6895 men and 3413 women).[30] All civil servants aged 35-55 years in 20 London based departments were invited to participate by letter, and 73% agreed. Baseline examination took place during 1985-1988, and involved a clinical examination and a self-administered questionnaire. Subsequent phases of data collection have alternated between postal
questionnaire alone and postal questionnaire accompanied by a clinical examination. Since baseline seven phases of data collection have been completed.
Socioeconomic position (SEP)
Our indicator of SEP was employment grade in the British civil service at Phase 1, a measure which is associated with salary, social status and level of responsibility. We
classified grade into three categories representing high (administrative grades), intermediate (professional or executive grades) and low (clerical or support grades) SEP. This measure of SEP was assessed on average 15 years prior to the measurement of wave 1 cognition.
Cognitive function
Assessment of cognitive function was introduced for the first time to the full Whitehall II sample at the fifth phase (1997-1999) of data collection. The cognitive data used in the analysis come from Phases 5 (considered to be wave 1) and 7 (2002-2004, wave 2 for our analysis). Cognition was assessed using five standard cognitive tests in the Whitehall II cohort.[4] In our study, we have chosen to use three of the five tests that were little influenced by ceiling and floor effects, a source of potential bias in the analyses. The first test was a 20-word free-recall test of short-term verbal memory. Participants were presented with a list of 20 one- or two-syllable words at 2-second intervals and were then asked to recall in writing as many of the words as they could, in any order; they had two minutes to do so. The other two tests measured verbal fluency: phonemic and semantic fluency. Phonemic fluency was assessed via “s” words and semantic fluency via “animal” words. Participants were asked to recall in writing as many words beginning with “s” and as many “animal” names as they could. One minute was allowed for each test. The scores on all three tests represent the number of correct words.
Statistical analysis
The analysis reported in this paper was based on a sub sample of participants aged 50 to 55 years at wave 1 of the cognitive data collection. SEP was examined as a categorical variable with high SEP as the reference. Descriptive analysis on the association between SEP and cognitive performance at wave 1 was carried out using analysis of variance (ANOVA), separately in men and women and was adjusted for age. In subsequent analyses men and women were combined as there were no real differences in the estimated effects.
Cognitive change was defined as the difference between cognitive scores at wave 2 and at wave 1, a negative change score indicated cognitive decline. The effect of SEP on cognitive change was first estimated by regressing cognitive change score on SEP (analysis 1, ANOVA). Then, we used ANCOVA, consisting of regressing cognitive score at wave 2 on SEP and wave 1 cognitive score (analysis 2). This is formally equivalent to regressing the change score on SEP and wave 1 cognition.[31] For both analysis 1 and 2 we show the estimated effects of SEP on cognitive change by using the high SEP group as the reference and estimating the difference in the cognitive change and 95% Confidence Interval (CI) in the intermediate and low SEP groups. Both analyses were adjusted for age, sex and the time
between the two waves of cognitive measures that was on average 5.5 (range: 3.9-7.0) years. The ANCOVA also produced an estimate for the effect of wave 1 measure. This was the difference, at wave 2, between two individuals who had one unit difference on the observed wave 1 score.
In further analyses the ANCOVA estimates, where both wave 1 cognition and SEP are independent variables, were corrected for bias due to measurement error. Measures of
cognition vary both due to day-to-day variations and error in the instrument used to assess cognition. Several methods have been developed to correct estimates for bias due to measurement error. Regression calibration is a widely used statistical method for adjusting point and interval estimates of effect obtained from regression models. We used errors-in-variables regression that allows user-specified measurement error to correct bias in the regression estimates using the
EIVREG
command in STATA.[32] Measurement error is an inverse function of the reliability coefficient; the more the error, the less reliable is themeasure. In our data we first used the test-retest reliability coefficient obtained from retesting a sub sample (N=556) of participants of the Whitehall II study at a three months interval. We extended these analyses by examining two further scenarios involving increasingly
pessimistic assumptions about the severity of measurement error in order to reflect the fact that the magnitude of the correction in the estimated effects of SEP and wave 1 cognition depends on the magnitude of the measurement error.
The correction for bias corresponds to:
y
=X
*Β
+e
withX
=X
*+U
where
y
represents the vector of the cognitive score at wave 2,X
* represents the matrix of thetrue value of the explanatory variables (age, sex, time between the both measures of cognitive function, wave 1 score and SEP) and
X
represents the matrix of the observed values.В
is the vector of the parameters. The estimateb
ofВ
is obtained as following:b
=A
-1X
Ty
whereA
=X
TX
–S
XT is the transpose of X, S is a diagonal matrix with elements N(1-r
i)si², where N is the
number of observations, ri is the user-specified reliability coefficient for the ith explanatory
variable (0<ri<1 for the wave 1 score andri=0 for the all other variables) and si² is the
variance of the ith variable. In the simplest situation of a single explanatory variable, the corrected regression coefficient is just the observed regression coefficient divided by the reliability coefficient of the explanatory variable.
RESULTS
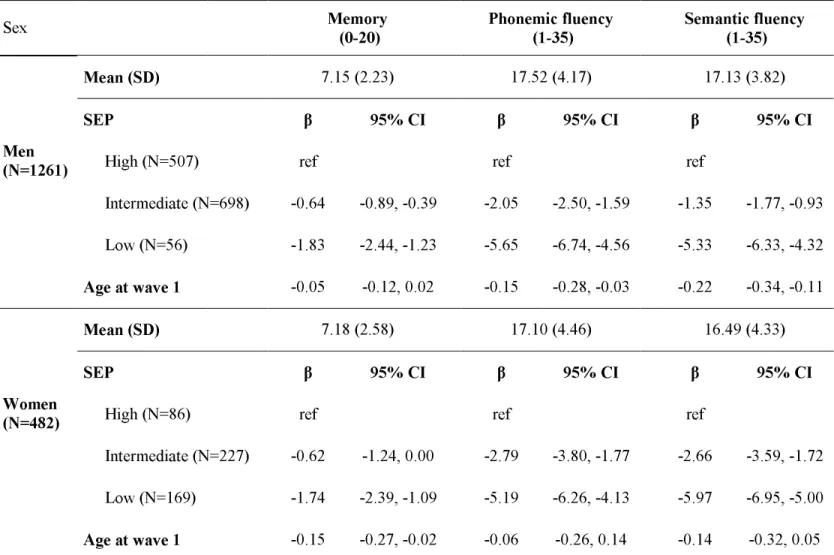
Data on all measures were available on 1743 (1261 men and 482 women) participants, aged 50-55 years at wave 1. Table 1 presents the sample characteristics in men and women. There were few men in the low SEP group (4%) and few women in the high SEP group (18%). The mean wave 1 memory score was a little over 7 words for men and women. In men, the mean score at wave 1 was more than 17 words (17.52 and 17.13) for both the verbal fluency tests. In women, the corresponding figure was 17.10 and 16.49 words, respectively. SEP and cognitive performance at wave 1
Table 1 also shows the differences in cognitive scores at wave 1 between the three SEP groups with high SEP as the reference. In men, the low SEP group had an average memory score that was 1.83 words lower (p<0.001) than the high SEP group. For phonemic and semantic fluency in men, the average differences between the high and low SEP groups were 5.65 (p<0.001) and 5.33 (p<0.001) words, respectively. The results for women were very similar and men and women have been combined in subsequent analyses.
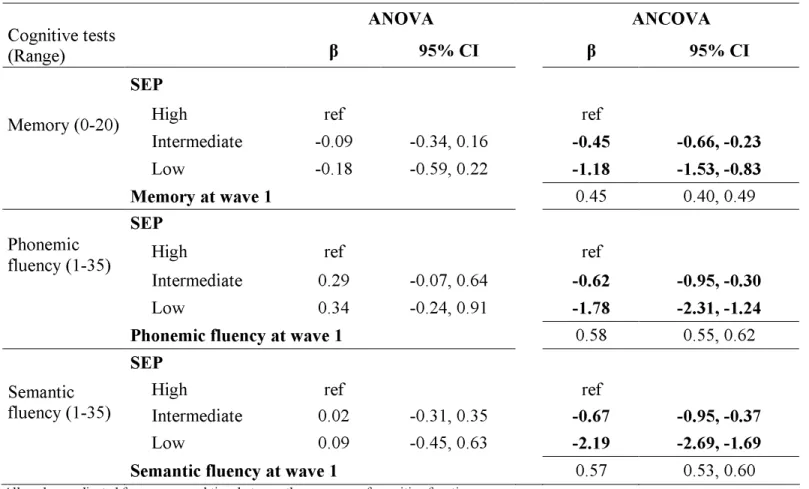
Table 2 shows estimates of the effect of SEP on cognitive change between wave 1 and wave 2 using ANOVA and ANCOVA. The results of the ANOVA reveal no difference in cognitive change score between the SEP groups for the three cognitive tests. However, the ANCOVA shows SEP to predict cognitive change, the decline being greater in the low SEP group, for all three cognitive tests. For instance, compared to the high SEP group the average decline in memory in the low SEP group was greater by 1.18 words (95% confidence interval (CI)=1.53, 0.83). For phonemic and semantic fluency tests, this difference was estimated at -1.78 (95% CI=-2.31, -1.24) and -2.19 (95% CI=-2.69, -1.69) words.
The ANCOVA results also provide an estimate for the effect of the wave 1 cognitive score. These results show that one word difference in the memory score between two
participants at wave 1 was associated with 0.45 word difference (95% CI =0.40, 0.49)
between them at wave 2. Similar results were obtained for all three tests, all coefficients were significantly lower than 1. This implies that two individuals with one unit difference on the observed wave 1 score will have a significantly smaller difference on the observed wave 2 score. There can be two possible explanations for this finding. The first is that those with high cognition decline more than those with poor cognition at wave 2. This is not plausible on the basis of what we know about cognitive ageing. An alternative, more likely explanation for the results is that measurement error in assessments of cognitive function[33] led to an
attenuation of the estimated effect of wave 1 cognitive score on the wave 2 score[17 18]. Thus, it is important to consider correcting the estimates derived from ANCOVA, for measurement error.
Correction of the bias due to measurement error in the ANCOVA estimates
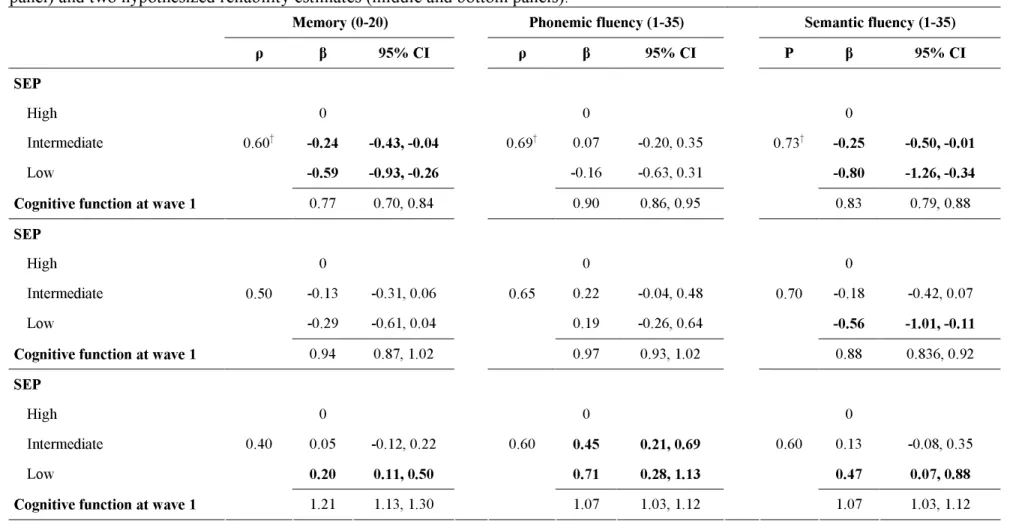
Table 3 presents the estimates for the effect of SEP on cognitive change, corrected for bias due to measurement error. The observed test-retest reliability for the memory test was 0.60 and those for phonemic and semantic fluency tests 0.69 and 0.73, respectively. In the top third of the table the reliability of the cognitive test was set as the observed test-retest
reliability and the estimates of the effect of SEP on cognitive change were corrected using this measure of reliability. The corrected estimates of memory show that at the observed reliability (0.60), SEP had a much weaker association with cognitive decline. However, the estimated effect of 1 unit difference in memory between two individuals at wave 1 translated to 0.77 word difference (95% CI=0.70, 0.84) between them at wave 2. The middle and bottom panels of Table 3 show the results for two hypothetical reliability coefficients, i.e. two scenarios with increasing measurement error and decreasing reliability coefficients. For example, reliability at 0.50 for memory revealed no effect of SEP on cognitive decline and little evidence of regression to the mean. These findings demonstrate the importance of measurement error to estimates derived from ANCOVA.
DISCUSSION
We examined the effect of SEP on cognitive decline in midlife using two commonly used analytical strategies, analysis of variance and analysis of covariance – the first is unadjusted and the second adjusted for baseline cognitive score. In this observational cohort study these two approaches lead to different conclusions: the results of the ANOVA suggest no effect of SEP whereas those obtained using the ANCOVA without correction for
measurement error suggest greater cognitive decline in the lower SEP groups. The
discrepancy is a result of at least two factors. The first is that the estimates from these two approaches are based on different assumptions; the ANOVA provides an unconditional and the ANCOVA a conditional effect. In other words the ANCOVA results are conditional on observed baseline cognition being similar in the three SEP groups. A second source of difference in the two approaches is that the ANCOVA estimates are biased due to the inclusion of baseline cognitive function, which is measured with error, as an independent
variable.[19 20] We also demonstrate that the bias formula correction intended to correct for the influence of measurement error provides estimates that vary as a function of the size of the measurement error.
The discrepancy in the results between the ANOVA and the ANCOVA in
observational studies was identified by Fred Lord and is known as the “Lord’s paradox”[13 14]. The ANCOVA results would apply to situations were there were no baseline differences in cognition in the SEP groups. However, this is an untenable assumption as our data clearly show SEP to be related to baseline cognitive performance; a fact also widely reported in the literature[1 2 3 4] Many observational studies on cognitive decline, irrespective of the predictor examined, are based on the ANCOVA approach.[3 8 28 29 34 35] A recent literature review where 12 out of 14 studies concluded that education had some protective effect on cognitive decline.[34] Out of these 12 studies, 8 studies adjusted for baseline cognitive score and did not take measurement error into account.[5 6 26 27 36 37 38 39] However, as highlighted by Glymour and colleagues,[19] one study that initially suggested education to be associated with greater cognitive decline using data from 2-waves and ANCOVA without corrections for measurement error,[26] later incorporated a third repeat measure of cognitive function to the analysis and found no effect of education on cognitive decline.[40]
The results from the ANCOVA model provide estimates for the effect of SEP and the wave 1 cognitive measure as both are included as independent variables in the model. We use both these estimates to show that the uncorrected ANCOVA may not be reliable; the
coefficient for the effect of wave 1 cognitive score on wave 2 cognitive score suggests that two individuals with one unit difference in their scores at baseline have a smaller difference at wave 2. There are two possible interpretations of this observation. The first is that higher scores at baseline predict lower scores at follow-up and vice versa. In other words, cognitive decline is stronger in individuals with better baseline cognitive function. This is not consistent with conclusions of previous studies,[11 27] and difficult to reconcile with the results for SEP obtained from the same model. We could speculate that participants who perceive themselves to have impaired performance at baseline work especially hard to improve cognitive score during the testing interval, while those who perceive themselves to perform well at baseline spend the testing interval avoiding all cognitive challenges and thus their true cognitive score declines. However, it is much more likely that these results are simply affected by
measurement error which leads to “regression to the mean”,[17 18] the tendency of
observations that are extreme by chance to move closer to the mean when repeated, due to measurement error. In general terms, the greater the measurement error the greater is the inflation for the estimated effect of the predictor and the greater the attenuation in the estimated effect of the baseline measure.[19 20] Cognitive function is measured with
error[33], and given the association between SEP and baseline cognition, ANCOVA is clearly not suitable for the analysis of cognitive change in observational studies.
The bias due to measurement error in the estimates obtained from ANCOVA can be corrected.[20 24 25] As expected, this correction reduced the estimated effect of SEP and increased the impact of the baseline cognition on cognition at follow-up. Our results show that the estimates from the corrected model depend on the size of the measurement error of the tests. Increasingly pessimistic assumptions about the magnitude of measurement error lead to larger corrections of the effect estimate, so that under the assumption of high levels of
measurement error (corresponds to decreasing reliability in Tables 3) the corrected effect estimate of SEP on cognitive decline decreases and then reverses sign compared to the uncorrected effect estimate. The estimates of the reliability obtained in our study for each test are close to those found in other studies[41 42] and with the observed estimates there is little influence of SEP on cognitive decline. However, we cannot rule out the possibility that the
observed reliability is overestimated as the corrected wave 1 effects continue to show the presence of regression to the mean. For cognition, the measurement error is made up of errors specific to the measure but also to within-subject variability due to, for instance, health of the participant fluctuating over time. On the other hand, our second scenario is perhaps too pessimistic regarding the magnitude of the measurement error. The coefficient for wave 1 in the corrected model (reliability 0.40) indicates an increase in variance at wave 2. However, an examination of the variances associated with the observed data (not shown but available from authors) shows no such increase. Therefore, this second scenario might represent an over correction.
CONCLUSION& RECOMMENDATIONS
Glymour et al. have recently argued against adjustment for baseline health status in the analysis of change in health[19] and proposed the use of causal diagrams to determine
whether or not to adjust for the baseline measure of health. We add to this point of view in this paper by narrowing the focus to a comparison between the estimates obtained from the ANOVA and the ANCOVA, particularly for analysis of change using data from 2 waves, drawn from an observational study. We recommend caution when using ANCOVA, or adjustment for baseline, in observational data. As a first step, it is judicious to examine the estimates of both the ANOVA and the ANCOVA, when analysing change using two waves of data. Inconsistency between the results from the two analyses, one adjusted and the other unadjusted for baseline, ought to be taken as a warning sign. ANCOVA includes both the exposure and the wave 1 outcome as independent variables and we recommend that estimates for both these measures be examined when interpreting the results for the effect of the
exposure. Finally, we caution against a simple correction of the ANCOVA estimates using the observed test-retest reliability to take account of the bias due to measurement error. Here again, it is advisable to examine the corrected estimates for both the exposure and the wave 1 outcome measure. When all these factors are taken into account, our results suggest no effect of SEP on cognitive decline in midlife.
ACKNOWLEDGEMENTS
AS-M is supported by a “European Young Investigator Award” from the European Science Foundation. MK and JV are supported by the Academy of Finland (projects #117604, #124271, #124322 and #129264), MM is supported by an MRC research professorship and MJS is supported by the British Heart Foundation. The Whitehall II study has been supported by grants from the British Medical Research Council (MRC); the British Heart Foundation; the British Health and Safety Executive; the British Department of Health; the National Heart, Lung, and Blood Institute (grant HL36310); the National Institute on Aging (grant AG13196); the Agency for Health Care Policy and Research (grant HS06516); and the John D. and Catherine T. MacArthur Foundation Research Networks on Successful Midlife Development and Socioeconomic Status and Health.
We thank all of the participating civil service departments and their welfare, personnel, and establishment officers; the British Occupational Health and Safety Agency; the British Council of Civil Service Unions; all participating civil servants in the Whitehall II study; and all members of the Whitehall II study team.
What this paper adds
What is already known on this subject?
Analysis of change using data from two waves of an observation study often provide different results depending on whether or not they are adjusted for the baseline measure.
Adjustment for the baseline measure provides results that are conditional on observed health measure being similar in the different exposure groups.
What does this study add?
We compared analysis adjusted and unadjusted for the baseline measure and showed that adjustment for baseline could be misleading as the exposure is often associated with the baseline measure in observational studies.
A further source of error in the estimates from the adjusted models is measurement error in the health measure; correction for this error does not provide a satisfactory solution and we recommend the use of unadjusted models.
Table 1. Cognitive tests in the three SEP groups at wave 1 (1997-99).
Sex Memory (0-20) Phonemic fluency (1-35) Semantic fluency (1-35)
Mean (SD) 7.15 (2.23) 17.52 (4.17) 17.13 (3.82)
SEP β 95% CI β 95% CI β 95% CI
High (N=507) ref ref ref
Intermediate (N=698) -0.64 -0.89, -0.39 -2.05 -2.50, -1.59 -1.35 -1.77, -0.93 Men (N=1261) Low (N=56) -1.83 -2.44, -1.23 -5.65 -6.74, -4.56 -5.33 -6.33, -4.32 Age at wave 1 -0.05 -0.12, 0.02 -0.15 -0.28, -0.03 -0.22 -0.34, -0.11 Mean (SD) 7.18 (2.58) 17.10 (4.46) 16.49 (4.33) SEP β 95% CI β 95% CI β 95% CI
High (N=86) ref ref ref
Intermediate (N=227) -0.62 -1.24, 0.00 -2.79 -3.80, -1.77 -2.66 -3.59, -1.72 Women
(N=482)
Low (N=169) -1.74 -2.39, -1.09 -5.19 -6.26, -4.13 -5.97 -6.95, -5.00 Age at wave 1 -0.15 -0.27, -0.02 -0.06 -0.26, 0.14 -0.14 -0.32, 0.05
β: difference in cognitive scores between the three SEP groups with high SEP as the reference. Negative coefficient indicates lower cognitive score. SD: Standard Deviation
Table 2. Cognitive change between wave 1 (1997-99) and wave 2 (2002-04) using the ANOVA and the ANCOVA.
ANOVA
ANCOVA
Cognitive tests
(Range)
β
95% CI
β
95% CI
SEP
High ref ref
Intermediate -0.09 -0.34, 0.16
-0.45
-0.66, -0.23
Memory (0-20)
Low -0.18 -0.59, 0.22
-1.18
-1.53, -0.83
Memory at wave 1
0.45 0.40, 0.49SEP
High ref ref
Intermediate 0.29 -0.07, 0.64
-0.62
-0.95, -0.30
Phonemic fluency (1-35)
Low 0.34 -0.24, 0.91
-1.78
-2.31, -1.24
Phonemic fluency at wave 1
0.58 0.55, 0.62SEP
High ref ref
Intermediate 0.02 -0.31, 0.35
-0.67
-0.95, -0.37
Semantic fluency (1-35)
Low 0.09 -0.45, 0.63
-2.19
-2.69, -1.69
Semantic fluency at wave 1
0.57 0.53, 0.60All analyses adjusted for age, sex and time between the measures of cognitive function. β: regression coefficients. CI: Confidence Interval
SEP coefficient represents mean difference in cognitive change with the high SEP as the reference. Negative coefficient indicates a greater decline. A wave 1 cognitive score coefficient lower than 1 indicates a reduction in within SEP group variance of the cognitive score at wave 2.
Table 3. Correcting bias due to measurement error in the ANCOVA estimates of difference in cognitive change based on observed reliability (top panel) and two hypothesized reliability estimates (middle and bottom panels).
Memory (0-20) Phonemic fluency (1-35) Semantic fluency (1-35)
ρ β 95% CI ρ β 95% CI Ρ β 95% CI
SEP
High 0 0 0
Intermediate -0.24 -0.43, -0.04 0.07 -0.20, 0.35 -0.25 -0.50, -0.01
Low -0.59 -0.93, -0.26 -0.16 -0.63, 0.31 -0.80 -1.26, -0.34
Cognitive function at wave 1
0.60† 0.77 0.70, 0.84 0.69† 0.90 0.86, 0.95 0.73† 0.83 0.79, 0.88 SEP High 0 0 0 Intermediate -0.13 -0.31, 0.06 0.22 -0.04, 0.48 -0.18 -0.42, 0.07 Low -0.29 -0.61, 0.04 0.19 -0.26, 0.64 -0.56 -1.01, -0.11
Cognitive function at wave 1
0.50 0.94 0.87, 1.02 0.65 0.97 0.93, 1.02 0.70 0.88 0.836, 0.92 SEP High 0 0 0 Intermediate 0.05 -0.12, 0.22 0.45 0.21, 0.69 0.13 -0.08, 0.35 Low 0.20 0.11, 0.50 0.71 0.28, 1.13 0.47 0.07, 0.88
Cognitive function at wave 1
0.40 1.21 1.13, 1.30 0.60 1.07 1.03, 1.12 0.60 1.07 1.03, 1.12
All analyses adjusted for age, sex and time between the measures of cognitive function. β: regression coefficients from the Errors-in-variables regression. ρ Test retest reliability. † Test-Retest Reliability estimated in 556 participants of Whitehall II.
CI: Confidence Interval.
SEP coefficient represents mean difference of cognitive change with the high SEP as the reference. Negative coefficient indicates a greater decline. A wave 1 cognitive score coefficient lower than 1 indicates a reduction in within SEP group variance of the cognitive score at wave 2.
References
1 Dartigues JF, Gagnon M, Letenneur L, et al. Principal lifetime occupation and cognitive impairment in a French elderly cohort (Paquid). Am J Epidemiol. 1992;
135
:981-8. 2 Gallacher JE, Elwood PC, Hopkinson C, et al. Cognitive function in the Caerphillystudy: associations with age social class, education and mood. Eur J Epidemiol.
1999;
15
:161-9.3 Lee S, Buring JE, Cook NR, et al. The relation of education and income to cognitive function among professional women. Neuroepidemiology. 2006;
26
:93-101.4 Singh-Manoux A, Richards M, Marmot M. Socioeconomic position across the lifecourse: how does it relate to cognitive function in mid-life? Ann Epidemiol.
2005;
15
:572-8.5 Albert MS, Jones K, Savage CR, et al. Predictors of cognitive change in older persons: MacArthur studies of successful aging. Psychol Aging. 1995;
10
:578-89.6 Evans DA, Beckett LA, Albert MS, et al. Level of education and change in cognitive function in a community population of older persons. Ann Epidemiol. 1993;
3
:71-7. 7 Jacqmin-Gadda H, Fabrigoule C, Commenges D, et al. A 5-year longitudinal study ofthe Mini-Mental State Examination in normal aging. Am J Epidemiol. 1997;
145
:498-506.8 Koster A, Penninx BW, Bosma H, et al. Socioeconomic differences in cognitive decline and the role of biomedical factors. Ann Epidemiol. 2005;
15
:564-71.9 Stern Y, Gurland B, Tatemichi TK, et al. Influence of education and occupation on the incidence of Alzheimer's disease. JAMA. 1994;
271
:1004-10.10 Kivipelto M, Ngandu T, Laatikainen T, et al. Risk score for the prediction of dementia risk in 20 years among middle aged people: a longitudinal, population-based study.
Lancet Neurol. 2006;
5
:735-41.11 Lyketsos CG, Chen LS, Anthony JC. Cognitive decline in adulthood: an 11.5-year follow-up of the Baltimore Epidemiologic Catchment Area study. Am J Psychiatry.
1999;
156
:58-65.12 Clarke PS. Causal analysis of individual change using the difference score.
Epidemiology. 2004;
15
:414-21.13 Lord FM. A paradox in the interpretation of group comparisons. Psychol Bull.
1967;
68
:304-5.14 Lord FM. Statistical adjustments when comparing preexisting groups. Psychol Bull.
1969;
72
:336-7.15 Holland PW, Rubin DB. On Lord's Paradox. In: Wainer H, Messick S, editors.
Principals of Modern Psychological Measurement.Hillsdale,NJ: Lawrence Erlbaum Associates, 1983. p. 3-25.
16 Wainer H, Brown LM. Two statistical paradoxes in the interpretation of group differences: illustrated with medical school admission and licensing data. American Statistician. 2004;
58
:117-23.17 Fitzmaurice G. Regression to the mean. Nutrition. 2000;
16
:80-1.18 Barnett AG, van der Pols JC, Dobson AJ. Regression to the mean: what it is and how to deal with it. Int J Epidemiol. 2005;
34
:215-20.19 Glymour MM, Weuve J, Berkman LF, et al. When is baseline adjustment useful in analyses of change? An example with education and cognitive change. Am J Epidemiol.
2005;
162
:267-78.20 Yanez ND, III, Kronmal RA, Shemanski LR. The effects of measurement error in response variables and tests of association of explanatory variables in change models.
Stat Med. 1998;
17
:2597-606.21 Fox J. Applied regression analysis, linear models, and related methods. London: SAGE Publications, 1997.
22 Van Breukelen GJ. ANCOVA versus change from baseline: more power in randomized studies, more bias in nonrandomized studies [corrected]. J Clin Epidemiol. 2006;
59
:920-5.23 Senn S. Change from baseline and analysis of covariance revisited. Stat Med.
2006;
25
:4334-44.24 Yanez ND, III, Kronmal RA, Shemanski LR, et al. A regression model for longitudinal change in the presence of measurement error. Ann Epidemiol. 2002;
12
:34-8.25 Carroll RJ. Covariance analysis in generalized linear measurement error models. Stat Med. 1989;
8
:1075-93.26 Christensen H, Korten AE, Jorm AF, et al. Education and decline in cognitive
performance: compensatory but not protective. Int J Geriatr Psychiatry. 1997;
12
:323-30.27 Farmer ME, Kittner SJ, Rae DS, et al. Education and change in cognitive function. The Epidemiologic Catchment Area Study. Ann Epidemiol. 1995;
5
:1-7.28 Richards M, Shipley B, Fuhrer R, et al. Cognitive ability in childhood and cognitive decline in mid-life: longitudinal birth cohort study. BMJ. 2004;
328
:552.29 Richards M, Hardy R, Wadsworth ME. Alcohol consumption and midlife cognitive change in the British 1946 birth cohort study. Alcohol Alcohol. 2005;
40
:112-7. 30 Marmot MG, Smith GD, Stansfeld S, et al. Health inequalities among British civilservants: the Whitehall II study. Lancet. 1991;
337
:1387-93.31 Laird N. Further comparative analyses of pre-test post-test research designs. The American Statistician. 1983;
37
:329-30.32 Stata Statistical Software: Release 9. [computer program]. College Station, TX: StataCorp LP; 2005.
33 Lezak MD. Neuropsychological assessment. New York: Oxford University Press, 1995. 34 Anstey K, Christensen H. Education, activity, health, blood pressure and apolipoprotein E as predictors of cognitive change in old age: a review. Gerontology. 2000;
46
:163-77. 35 Richards M, Jarvis MJ, Thompson N, et al. Cigarette smoking and cognitive decline inmidlife: evidence from a prospective birth cohort study. Am J Public Health.
2003;
93
:994-8.36 Arbuckle TY, Maag U, Pushkar D, et al. Individual differences in trajectory of
intellectual development over 45 years of adulthood. Psychol Aging. 1998;
13
:663-75. 37 Butler SM, Ashford JW, Snowdon DA. Age, education, and changes in the Mini-MentalState Exam scores of older women: findings from the Nun Study. J Am Geriatr Soc.
1996;
44
:675-81.38 Schaie KW. The hazards of cognitive aging. Gerontologist. 1989;
29
:484-93.39 Shichita K, Hatano S, Ohashi Y, et al. Memory changes in the Benton Visual Retention Test between ages 70 and 75. J Gerontol. 1986;
41
:385-6.40 Christensen H, Hofer SM, Mackinnon AJ, et al. Age is no kinder to the better educated: absence of an association investigated using latent growth techniques in a community sample. Psychol Med. 2001;
31
:15-28.41 Harrison JE, Buxton P, Husain M, et al. Short test of semantic and phonological fluency: normal performance, validity and test-retest reliability. Br J Clin Psychol.
2000;
39
:181-91.42 Lemay S, Bedard MA, Rouleau I, et al. Practice effect and test-retest reliability of attentional and executive tests in middle-aged to elderly subjects. Clin Neuropsychol.
Licence for Publication statement.
"The Corresponding Author has the right to grant on behalf of all authors and does grant on behalf of all authors, an exclusive licence (or non exclusive for government employees) on a worldwide basis to the BMJ Publishing Group Ltd and its Licensees to permit this article to be published in Journal of Epidemiology and Community Health editions and any other BMJPGL products to exploit all subsidiary rights, as set out in our licence