Supporting Information
Hierarchically Porous Reduced
Graphene Oxide Coated with Metal–Organic Framework
HKUST-1 for Enhanced Hydrogen Gas Affinity
Kyung Seob Song
†, Daeok Kim
‡and Ali Coskun
† *† Department of Chemistry, University of Fribourg, Fribourg 1700, Switzerland
‡ Graduate School of EEWS, Korea Advanced Institute of Science and Technology (KAIST), 373-1
Guesong Dong, Daejeon, 305-701, Republic of Korea
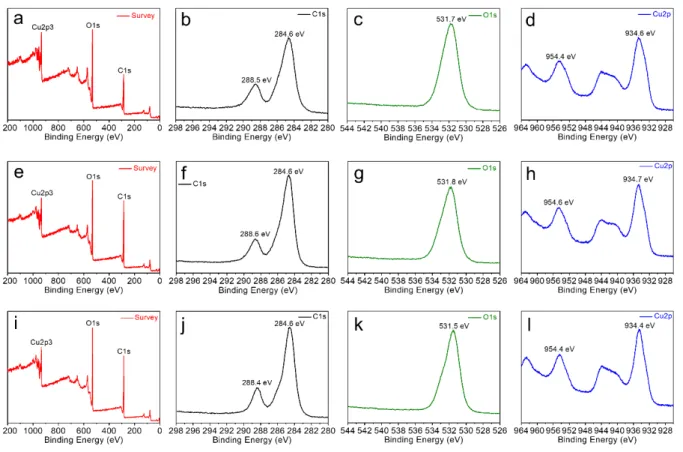
Figure S1. XPS analysis. (a) Survey spectrum, (b) C1s and (c) O1s of HRGO. (d) Survey spectrum, (e) C1s, (f) O1s and (g) Cu2p of HKUST-1.
Figure S2. XPS analysis. (a) Survey spectrum, (b) C1s and (c) O1s and (d) Cu2p of HKUST-1@HRG O-10. (e) Survey spectrum, (f) C1s and (g) O1s and (h) Cu2p of HKUST-1@HRGO-15. (i) Survey spe ctrum, (j) C1s and (k) O1s and (l) Cu2p of HKUST-1@HRGO-20.
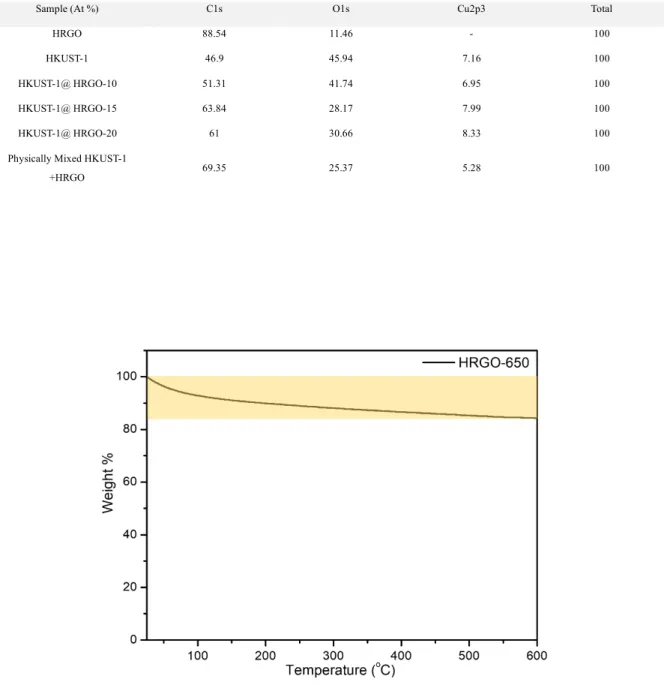
Table S1. XPS analysis table for HRGO, HKUST-1, HKUST-1@HRGO series and physically mixed H KUST-1 and HRGO.
Sample (At %) C1s O1s Cu2p3 Total
HRGO 88.54 11.46 - 100
HKUST-1 46.9 45.94 7.16 100
HKUST-1@ HRGO-10 51.31 41.74 6.95 100
HKUST-1@ HRGO-15 63.84 28.17 7.99 100
HKUST-1@ HRGO-20 61 30.66 8.33 100
Physically Mixed HKUST-1
+HRGO 69.35 25.37 5.28 100
Figure S3. TGA of HRGO under N2 atmosphere. The weight loss associated with residual oxygen (15.7
Table S2. Inductively coupled plasma-optical emission spectrometry of HKUST-1@HRGO Series
Sample Copper Concentration
(mg/l) Copper (wt %)
HKUST-1@ HRGO-10 5.77 11.5
HKUST-1@ HRGO-15 4.22 8.5
HKUST-1@ HRGO-20 2.84 5.7
Figure S4. Calibration curve of copper
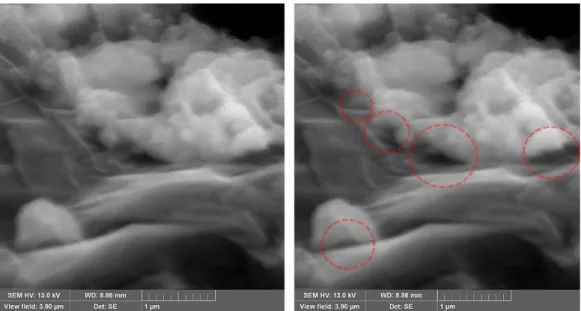
Figure S6. (a) Heterogenous nucleation of HKUST-1 nanoparticles on the surface of HRGO (without w ashing). (b) Filling the macro-/mesopores of HRGO with HKUST-1 nanoparticles (without washing).
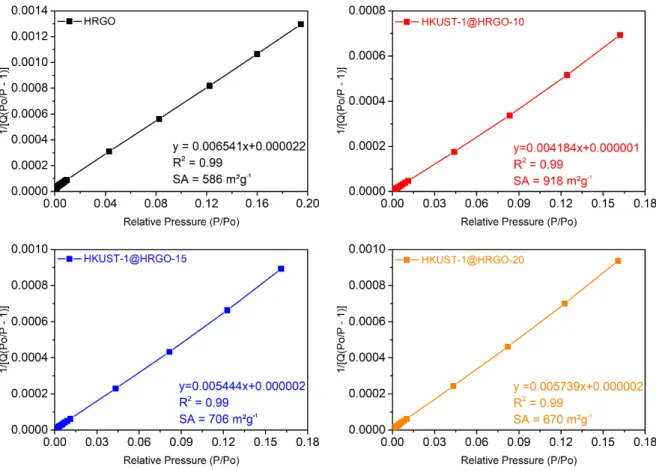
Figure S8. BET linear plots of HRGO, 10, 15 and HKUST-1@HRGO-20.
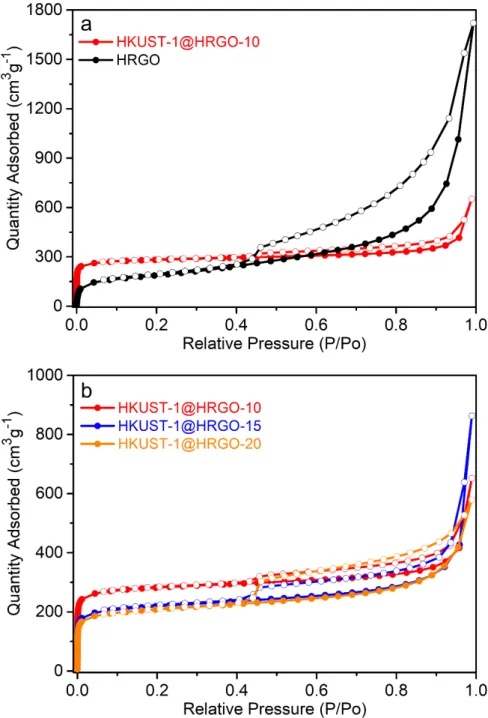
Figure S9. Surface area analysis of HRGO and HKUST-1@HRGO series using Ar at 87 K. (a) The c hange in the Ar adsorption (filled) and desorption (empty) isotherms at 87 K for HRGO and HKUST-1 @HRGO-10. (b) Ar adsorption and desorption isotherms of hierarchically porous HKUST-1@HRGO ser ies at 87 K.
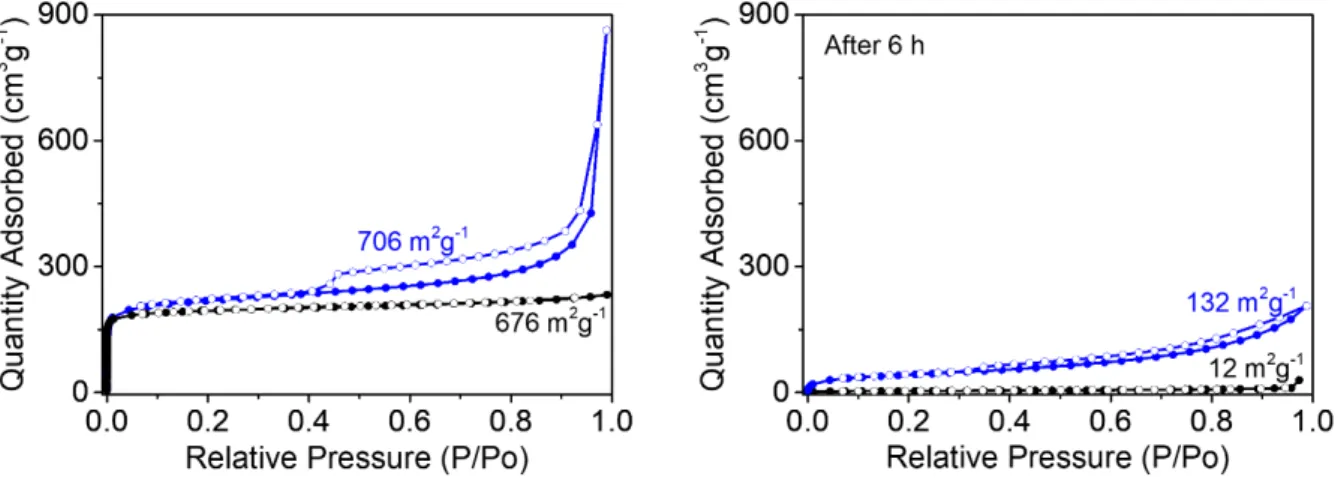
Figure S10. BET surface area analysis of HKUST-1 (black), HKUST-1@HRGO-15 (blue) before and after water treatment.
Table S3. BET surface area analysis of HKUST-1@HRGO-15 before and after H2 uptake
HKUST-1@HRGO-15 (mBET 2 g-1a, ) Smicro b, (m2 g-1) Sext c, (m2 g-1) Vtotal d, (cm3 g-1) Vmicro e, (cm3 g-1) Vext f, (cm3 g-1) Before H2 analysis 706 515 191 1.08 0.25 0.83 After H2 analysis 728 585 143 1.10 0.22 0.88
a Brunauer−Emmett−Teller (BET) surface area calculated over the pressure range (P/P
O) of 0.01−0.11. b Micro pore
surface area calculated using the t-plot method. e S
ext = Stotal - Smicro. d Total pore volume obtained at (P/P0) = 0.99. e Micropore volume calculated using the t-plot method. f V