HAL Id: hal-01819424
https://hal.uca.fr/hal-01819424
Submitted on 6 Feb 2021
HAL is a multi-disciplinary open access
archive for the deposit and dissemination of
sci-entific research documents, whether they are
pub-lished or not. The documents may come from
teaching and research institutions in France or
abroad, or from public or private research centers.
L’archive ouverte pluridisciplinaire HAL, est
destinée au dépôt et à la diffusion de documents
scientifiques de niveau recherche, publiés ou non,
émanant des établissements d’enseignement et de
recherche français ou étrangers, des laboratoires
publics ou privés.
Effects of a polydisperse cloud on tropospheric chemistry
N. Audiffren, N. Chaumerliac, M. Renard
To cite this version:
N. Audiffren, N. Chaumerliac, M. Renard. Effects of a polydisperse cloud on tropospheric
chem-istry. Journal of Geophysical Research: Atmospheres, American Geophysical Union, 1996, 101 (D20),
pp.25949 - 25965. �10.1029/96JD01548�. �hal-01819424�
JOURNAL OF GEOPHYSICAL RESEARCH, VOL. 101, NO. D20, PAGES 25,949-25,965, NOVEMBER 20, 1996
Effects of a polydisperse
cloud on tropospheric chemistry
N. Audiffren, N. Chaumerliac and M. Renard
LAMP, Laboratoire de M6t6orologie Physique, CNRS and Universit6 Blaise Pascal, Aubi/•re, France
Abstract. Effects of a polydisperse cloud on tropospheric chemistry have been studied in the
framework of a two-dimensional model where dynamical, microphysical, and chemical proces-
ses are fully interactive. The chemical module describes the tropospheric photochemistry of
ozone precursors in both gaseous and aqueous phases for a remote atmosphere. Impacts of the
cloud polydisperse feature have been obtained by comparing the results in the case of a mono-
disperse
cloud
created
under
the
same
meteorological
conditions.
The [NO]/[NO•]
ratio
decreases more sharply in the case of the polydisperse cloud. The partitioning of ihe most
soluble species does not follow the Henry's law equilibrium except in the middle of the cloud.
This result has implications for airborne measurements made within clouds. Deviations from
Henry's law found in samples are usually explained only by the effect of variations of the
liquid water content with time, assuming that no real deviations exist in the real cloud. Here, it
is shown that deviations from Henry's law equilibrium may exist even for clouds consisting of
small droplets.
Introduction
Radicals
(HOx,
RO2) are at the heart
of the atmospheric
photochemical oxidant cycle. OH is the prim• oxidant of the troposphere and thus plays a key role in the cycles of many
important gases. The chemistry of odd-hydrogen radicals
(HO
x) is closely
linked
to that
of organic
peroxy
radicals
RO
2
through their interconversion reactions (OH and CO, OH and methane). In addition, hydroxyl radical and peroxy radicals
(HO
2 and
RO2)
affect
the
photostationary
state
balance
of NO
and
NO 2 which
control
the net ozone
production
in the
troposphere.
Clouds modify the fate of these radicals (as well as for
other chemical species) by partitioning them between gas and aqueous phases, by their wet removal, by the redistribution of the species by additional vertical transport in convective cells, and œmally by modifying the photolysis rates. Unfommately, the impact of clouds and their chemistry of these radicals can
be hardly deduced from rare experimental data. Hence, adequate treatment of clouds and precipitation in atmospheric transport/chemistry models is needed. Its development raises
some problems since cloud processes are largely a subgrid
phenomena relative to the scales resolved in global models. Such models use scavenging coefficients (often proportional to the precipitation rate) or detennined from empirical or
microphysical considerations. Advanced models make more realistic calculations of the aqueous phase chemistry and wet
removal, but assumed that clouds were monodisperse and all the droplets have the same composition. These models were
developed to study acid deposition, and thus nonprecipitating
clouds have often not been considered, despite the fact that
most of clouds do not precipitate.
Atmospheric chemical models often use the Henry's law equilibrium [Schwartz, 1986; Seinfeld, 1986] to describe the
Copyright 1996 by the American Geophysical Union. Paper number 96JD01548.
0148-0227/96/96JD-01548509.00
partitioning of a species between gas and aqueous phase (fog,
cloud and rain) while several experimental studies [Noone et al., 1988; Collett et al., 1993; Pandis and Seinfeld, 1990; Pandis and Seinfeld, 1991; Winiwarter et al., 1992] have reported many deviations from this law. The most common explanation for these deviations from Henry's law for the bulk
samples is the introduction of a bias in the sampling
procedure [Pandis and Seinfeld, 1991]. On the basis of an
analysis of chemical contents of tropical rains from convective
clouds
Cautenet
and
Lefeivre
[1994],
found
that
for HNO
3,
NH 3, HCOOH,
the dilution
coefficients
are
particularly
weak,
far less than the value expected by the effect of simple dilution. Moreover, they emphasized that in order to analyze the chemical composition of rain, it is necessary to classify rain events according to the granulometric type of the precipitating clouds systems (convective or stratiform). Therefore, the polydisperse feature of the cloud system is of
primary importance in the analysis of the chemical content of
the rain.
We expect that the aqueous and gaseous reactions and the partitioning of the liquid water content in two main different
drop populations are also responsible for the deviations from
Henry's law in the case of soluble species. Bulk samplings are
usually of two main types. The most common corresponds to measurements obtained from a pluviometer. They are time- integrated measurements. Other measurements are sometimes
done in real clouds with airborne apparatus. We expect that
measurements made on the edges of clouds may provide
significantly different results from those obtained in the middle region of the clouds, in terms of dissolved-gases
contents. This spatial feature is likely due to the differences of chemical composition of the interstitial air in the cloud with
air surrounding it, and is an indirect effect of mixing and
transport. Another source of spatial differences in the
deviation from Henry's law is the polydisperse aspect of some clouds with, for example, two populations of drops of different
sizes (cloud droplets and raindrops). Then, in many clouds we may observe a combination of these two effects as it will be demonstrated in our simulation for two highly soluble species 25,949
25,950 AUDIFFREN ET AL.' EFFECTS OF POLYDISPERSE CLOUD
HCOOH,
and
1-I20
2 whose
aqueous
concentrations
could
be
experimentally measured.
Depletion of tropospheric ozone in presence of clouds is
still an open question. Most of the first studies concerning the effects of clouds on tropospheric ozone chemistry have predicted significant depletion of ozone induced by clouds in
global situations [Lelieveld and Crutzen, 1990; Dentener,
1993] with alternation of clear and cloudy conditions.
Nevertheless,
over
one
cloud
life cycle,
small
effects
on 0 3 are
expected, but noticeable changes in radical chemistry and subtraction of soluble species from gas phase already occur.
Indirect
effects
of clouds
such
as perturbing
the [NO]/[NO
2]
ratio as a consequence of radicals scavenging and modified photolysis rates are already significant within one isolated cloud simulation. During the cloud event, because of the
inhibition
of the
conversion
of NO into
NOg,
excess
of NO
exists relatively to clear conditions, and it will be consumed after the cloud dissipates. Obviously, a delay will occurdepending
whether
the conversion
of excess
NO into NO
2
after
the
cloud
can
be expected
particularly
if the
radicals
RO
2
have been washed out. Such effects of an isolated cloud on this ratio have been found in our simulation.
As previously underlined, the variation of concentrations
(in gas or aqueous phases) versus the droplet radius are often
based on a strongly limiting hypothesis that the cloud is monodisperse. More studies are needed to look at the effect of a polydisperse cloud and can be obtained by integrating the
results over a whole droplet specmun.
In this study, we first show how the radical chemistry is affected by the presence of either a monodisperse cloud or a polydisperse cloud, and compare the results. (Metals and organic aerosols inside the drops are not included in our simulation because of their poorly known reactions with chemical species). We focus on the process of transfer
between the gas and aqueous phases (fully coupled chemistries) and on the consequences on soluble species which it could induce with respect to the deviations from
Her•'s law.
We carried out a simulation with a chemical box model
similar to Jacob [1986], but with specific species values of the
accommodation coefficient a, a liquid water content which varies in time, and two different drop sizes. This box model
study constitutes the first part of our paper and would be taken
as the reference case for the study of the monodisperse cloud
effects. The polydisperse aspect of clouds is discussed in a
second part in the framework of a dynamic model that simulates contrasting types of clouds (continental versus maritime). We examine the behavior of 12 chemical species involved in the ozone tropospheric chemistry in the presence
of an orographic cloud. The selected scenario enables us to separate easily the microphysical processes along the mountain slope. The ozone chemistry is that of a non polluted
atmosphere
with a low amount
of NO
x. In the box model,
gaseous, aqueous reactions and mass transfer are taken into account as is done for the dynamic models of clouds. In both cases, the duration of simulation is 3 hours.
Description of the Model
The Chemical Module
This model treats 12 gaseous phase species with reactions derived from Lelieveld and Crutzen [1990]. The aqueous
phase reactions are derived from the work of Lelieveld and
Crutzen [1991]. Tables 1, 2 and 3 give, respectively, the gas
phase reactions, the equilibrium reactions between the two phases, and the aqueous phase reactions. Photolysis rates are held constant during the whole simulation in order to focus exclusively on the sensitivity to drop size. The complete
chemical scheme takes the following form:
a cs
dt
= eg
_ OgCg
_ t(cg
- Cae
LHeff
RT
)
Caq
)
d
dtCaq
=
Paq
- DaqCaq
+
Lkt
(Cg
- LHeff
RT
where
Cg and
Caq
are,
respectively,
the
gaseous
and
the
aqueous water concentrations, expressed in molecules percubic
centimeter
of air.
P g,
Paq,
D g, and
Daq
are
the
production
and destruction rates, respectively, for gaseous and aqueous phases. In the case of dissociating species, C is the sum of
the
dissolved
species
and
dissociated
parts
a•f
the
aqueous
concentration.
HelI
is the effective
Henry's
law constant
(in
mole per liter per atmosphere) which includes the possible
dissociation of the chemical species in the aqueous phase as a
function of the pH. L is the liquid water content (v/v); k t is the
mass transfer coefficient [Schwartz, 1986] to liquid water. The
latter strongly depends on the drop radius r and the
accommodation coefficient a, as can be seen in the following formula [Schwartz, 1986]:
r 2 4r
k t = •+ _
3Dg 3• v
Although the accommodation coefficient varies from one species to another (see Table 5), we verified that for soluble
species the consequence on the values of k t induced by this
variation is negligible in comparison with those related to the
drop radius.
An exponential method [Chang et al., 1987] has been chosen for the solver of these two equations because of its efficiency [see Gregoire et al., 1994]. Mixing of drops of different pH is one of the major sources of deviations to Henry's law [Pandis and $einfeld, 1991]. We held pH
constant (4.16) in order to focus on the sensitivity to varying the other parameters.
Initial Conditions
Initial gaseous concentrations, typically of low levels of
NO
x, are given
in Table
4. The initial spatial
gaseous
distribution
(in molecules
per
•ubic
centimeter)
of species
is
taken to be constant with height due to the lack of experimental vertical profiles of the chemical species in case
of low
levels
of NO
x. However,
this
provides
the
advantage
of
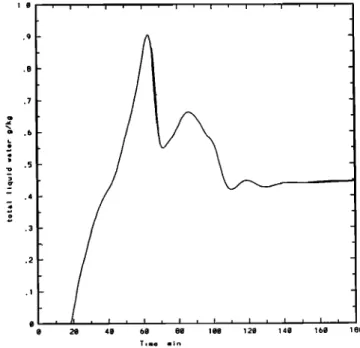
simplifying the analysis and the interpretation of the results. In the box model, the liquid water content varies with time as indicated on Figure 1. Two cases have been simulated, one corresponding to an aqueous phase with a constant mean
diameter of 20 microns, the other one with a diameter of 200
microns. The liquid water content and chemical intialization are taken as identical, as in the two cloud cases.
AUDWFREN ET AL.' EFFECTS OF POLYDISPERSE CLOUD 25,951
Table 1. List of the Reactions and Equilibrium m the Gas Phase With Corresponding Rate and Equilibrium
Constants [from Lelieveld and Crutzen, 1991 ].
Gas Phase Reaction Scheme • Rate constants •
G1 c 0 3 + H20 + hx' -• 2OH' + O 2 Jeff
G2 03 + OH --• HO 2- + O: 1.6 x 10 exp (-940/T)
-14
G3 03 + HO: ß --• OH' + 202 1.1 x 10 exp (-500/T)
-15
G4 2HO: --} H202 + O 2 (2.3 x 10 exp(600/T) + 1.7 x 10 [M] exp (1000/T))
-21 x (1+1.4 x 10 [H:O] exp (2200/T)) G5 H202 + hv • 2OH' 4.6 x 10 -12 G6 H202 + OH' -• HO 2' + H20 3.3 x 10 exp (-200/T) -12 G7 CH 4 + OH' + 02 +M --> CH302' + H20 +M 2.3 x 10 exp (-1700/T) -12 G8 CH302' + HO 2' -• CH302H + O: 4.0 x 10 G9 CH30:H + O: + hv -• CH20 + HO 2' + OH' 4.6 x 10 -12 G10 CH302H + OH • CH302' + H20 5.6 x 10 -12 G11 CH302H + OH -• CH20 + OH' + H20 4.4 x 10 G12 CH20 + 202 + hv • CO + 2HO 2 1.7 x 10 G13 CH20 + hv -• CO + H 2 3.3 x 10 -11 G14 CH20 + OH' + 02 --> CO + HO 2' + H:O 1.1 x 10 -13
G15 CO + OH- + O, +M --} CO, + HO,- + M 2.4 x 10
G16 NO+03-->NO:+O2 2.0 x10 exp(-1400/T)
G17 NO:+
02+hv -•NO + O
3
5.6
x 10
-3
G18 NO + HO:' ---> NO 2 + OH' 3.7 x 10 exp (240/T)
12
G19 NO
+ CH302'
+ O
2 --->
NO
2 + CH?_O
+ HO
2'
4.2 x 10' exp
(180/T)
-11 G20 NO 2 + OH (+ M) •> HNO 3 (+ M) 1.2 x 10 -I G21 HNO 3 + hv • NO 2 + OH 3.2 x 10 -13 E22 CH20 + HO 2' • O2CH2OH 6.7 x 10 -12G23 O2CH2OH + HO 2- • HCO2H + HO2-+ O 2 2.0 x l0
-12
G24 O2CH2OH + NO + 02 •> HCO2H + HO 2' + NOv_ 7.0 x 10 G25 O,CH,OH + O,CH,OH •> 2HCO,H + HO,' + 1.2 x 10
H20
-13
G26 HCO2H + OH + 02 •> CO 2 +HO 2' + H20 3.2 x 10
-1
J,
S
'•
* Reaction
rate
constants
of first
order
reactions
are
in s' of 2nd
order
reactions
in molecule
cm
•
1 1 -5
O 3+hyco 2+O(D) J0 =1.6 x10
1 -10
O(D) + H20 • 2OH k l = 2.2 x 10
1 3 -11
O(D) + N 2 • O(P) + N 2 k2= 4. x 10 exp(67(1/T-1/298.))
1 3 -11
O(D) + 02 •> O(P) + 02 k3= 2.6 x 10 exp(110(1/T-1/298)) Jeff = J0 kl ([H20]/(k• [H20] + lie [O21 + k3 IN21 ))
Mesoscale Simulation
A complete description of the mountain wave scenario used to create the orographic cloud can be found in previous papers [Chaumerliac et al., 1987, Chaumerliac et al., 1990]. The haft width of the mountain is 25 km and its height is 1 km. The initial wind is horizomal and homogeneous with a
velocity of 20 m/s, and the initial relative humidity is assumed to be 80% below 3 km. The mesoscale model [Nickerson et al., 1986] covers an horizomal domain of 300 km over land with a grid spacing of 10 km. The time step is 10 s and there
are 16 computational levels in the vertical terrain-following coordinate system (v). The dynamical, microphysical, and
chemical processes are fully interactive in the model. The
simulation lasts for 3 hours and is two-dimensional.
Microphysical Scheme
The microphysical pararneterization uses the Berry- Reinhardt [1974] scheme. This scheme appears to be a good compromise to fulfill the requirements of both the accuracy of description of the drop-size distribution of rain, and the reductions in computational costs [Huret et al., 1994]. Particularly, as a quasi-spectral scheme it gives a more realistic description of the evaporation process than the well- known scheme of Kessler [ 1969]. Differences between the two
25,952 AUDIFFREN ET AL.' EFFECTS OF POLYDISPERSE CLOUD
Table 2. List of the Gas-Aqueous Phase Equilibria With Corresponding Henry's Law
Constants and of Aqueous Equilibria With Corresponding DissociationConstants [from
Lelieveld and Crutzen, 1991 ].
Gas-Aqueous
and
Aqueous
Phase
Equilibria
Henry's
Law
and
Dissociation
Constants
K'298
E 1
H20
• H
+ + OH'
HI 03 (gas) <--> 03 (ac0 H2 H202 (gas) <--> H202 (aq)
E2 H202
(ac0
<-'>
HOe'+
H
+
H3 CH302H (gas) <---> CH302H (aq) H4 CH20 (gas) <-> CH2(OH) 2 (aq) H5 HNO 3 (gas)<-> HNO 3 (aq)E3 HNO
3 (aq)
<->
H
+ + NO
3'
H6 HO 2' (gas) <-> HO:- (aq).
E4 HO
2' (aq)
<->
H
+ + O
2 (aq)
H7 OH' (gas) <-> OH- (aq) H8 NO 2 (gas) <-> NO 2 (aq) H9 NO (gas) <-> NO (aq) H10 CH302' (gas)<-> CH302' (aq) H 11 HCO2H (gas) <-> HCO2H (aq)
E5 HCO2H
(aq)
<->
H
+ + HCO
2'
1.0 x 10 exp(-6716 (1/T-1/298)) -2 1.1 x 10 exp(2300 (1/T-1/298)) 4 7.4 x 10 exp(6615 (1/T-1/298)) -12 2.2 x 10 exp(-3730 (1/T-1/298)) 2 2.2 X 10 exp(5653 (1/T-1/298)) 6.3 x 10 exp(6425 (1/T-1/298)) 2.1 x 10 exp(8700 (1/T-1/298)) 15.4
2.0 x 10⁻⁴
exp(6600
(1/T-1/298))
3.5 x10 9.0 x10 -.4 6.4 x 10 exp(2500 (1/T-1/298)) 1.9 x 10 exp(1480 (1/T-1/298)) 0-4 2.0 x 1 exp(6600 (1/T-1/298))3.7 x 10-4
exp(5700
(1/T-1/298))
-4 1.8 x 10 exp(-1510 (1/T-1/298)) -1 -1 -1* Henry's law constants in mol x I atm and dissociation constants in mol x I at 298 K.
schemes are detailed in the appendix. Moreover, for the
parameterization of the microphysical processes, the Berry- Reinhardt scheme allows for better accuracy by taking into
account more detailed features of the cloud. Cloud water can be converted into rainwater even for small values of its mixing
ratio. For example, the autoconversion rate depends on the type of air mass and on the cloud water mixing ratio. This dependence is represented by a coefficient named a 2 which expression is directly linked to the total number of cloud
droplets
Nc• and
their
standard
deviation
c•
c. This
coefficient
is
particularly important because it takes into account the nature
of the air mass and enables parameterizations for more or less
precipitating clouds: The higher the value of a 2 the more
precipitating the cloud is.
Two runs are driven with different types of orographic
clouds. They differ in the type of air mass which is considered.
A continental air mass gives rise to a cloud with small drops (hereafter named continental cloud), while the maritime
orographic cloud corresponds to an maritime air mass. The
maritime cloud has two populations of drops: droplets of cloud water and big drops of rainwater. The total liquid water
contents of these two clouds are identical, only the partitioning
Table 3. List of the Reactions in the Aqueous Phase With Corresponding Rate Constants [from Lelieveld and Crutzen, 1991 ].
Aqueous
Phase
Reaction
Scheme
Rate
Constants
at 298
K '
A1 A2 A3 A4 A5 A6 A7 A8 A9 A10 All
H202
+ hv
--•
2OH'
G5
x 1.6
(in
s
'•)
-1 03+ hv•H,,O:+O 2 G1 xl.6(ins )CH2(OH)2 + OH' + 02 -• HCO? + HO 2' + H20 2.0 x 10 exp(-1500 (1/T-1/298))
HCO2H + OH' + 02 --} CO 2 + HO 2' + H20 . HCO 2 + OH' + 02 --• CO 2 + HO 2' + OH .
O
3+O
2 H•-O>oH'+OH'+202
_ . HO 2'+O 2 +H20--•H202+OH +O 2 H202 + OH' • HO 2' + H20 _CH302'
+ O
2 + H20
--• CH302H
+ OH'
+ 02
CH302H + OH' --> CH302' + H20CH302H + OH' --• CH2(OH) 2 + OH'
0 • 1.6 x 1 exp(-1500 (1/T-1/298)) 0 v 2.5 x 1 exp(-1500 (1/T-1/298))
1.5
x 10
u
exp(-1500
(1/T-1/298))
1.0
x 10
• exp(-1500
(1/T-1/298))
/ 2.7 x 10 exp(-1715 (1/T-1/298)) / 5.0 x 10 exp(-1610 (1/T-1/298)) / 2.7 x 10 exp(-1715 (1/T-1/298)) / 1.9 x 10 exp(-1860 (1/T-1/298)) -1 -lAUDWFREN ET AL.: EFFECTS OF POLYDISPERSE CLOUD 25,953
Table 4: Initial Values of the 12 Species
O 3 H202 CH302H CH20 CO HNO 3
30 ppb 2 ppb 0 ppb 0 ppb 100 ppb 100 ppt
HO 2 OH NO 2 NO CH302 HCOOH
0 ppt 0 ppt 5 ppt 5 ppt 0 ppt 0 ppt
specified by the primary autoconversion process of cloud into rain is different. This provided us an idealized situation for
cloud chemistry study.
Continental cloud. Its specmun is characterized by a
value
of o c equal
to 0.16 and
a mean
diameter
of 20 grn.
The
orographic
cloud
has
a maximum
qc•
value
of 0.73
g kg
'1, but
it is almost
nonprecipitating
(0.0012
g kg
'1 for the maximum
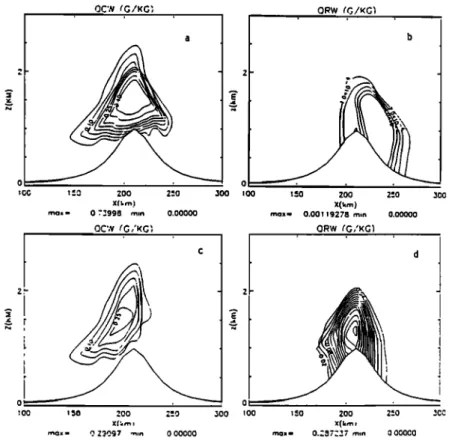
rainwater mixing ratio, see Figures 2a, 2b). This leads to a value of a 2 = 0.17.
Maritime cloud. For this case, the value of a 2 is 0.28, so
this cloud reaches higher values of rainwater mixing ratio
(maximum
value
equal
to 0.28 g kg'l). However,
it has a
lower
maximum
value
of the cloud
mixing
ratio
of 0.3 g kg
'1
than the continental cloud (see Figures 2c, 2d). The spatial evolution of the raindrops diameter is shown in Figure 3.
After 3 hours of simulation, the main characteristics are as follows: A large longitudinal extent and a high maximum value for continental cloud water with low rain content,
whereas the maritime cloud shows lower cloud water contents and higher values of rain content.
The complete chemical scheme is for the case of
polydisperse clouds: dC g
dt - Pg
- DgCg
- xwc
ktl
(Cg
-
xwc Her
Ccl )
f RT
Cr )
- xwr
ktr
(Cg
- xwr
HeffRT
d
dtCcl
= Pcl
- DclCcl
+
xwc
ktl
(Cg
-
xwc Hef
Cct )
f RT
d Cr C rdt = Pr
- DrCr
+ xwc
ktr
(Cg
-
xwc Hef
f RT
)
where C_ and Cct, C r are, respectively, the gaseous, cloud
water, and rainwater concentrations, expressed in molecules
per
cubic
centimeter
of air.
Pg,
Pct, Pr' D, D cl, D r are
the
product
and
desla-uction
rates,
respectively
g,
for
gaseous
and
aqueous phases. Here xwc and xwr are the cloud water content
and
rainwater
content
(v/v); ktl and
ktr
are
the
mass
transfer
coefficient [Schwartz, 1986] to cloud water and rainwater, respectively. Coupling the chemical module with dynamical and microphysical models has been realized by using time- splitting. A quasi-steady state approximation has been adopted but the transfer is resolved separately of the chemical variations. The chemical module has a time step which hasbeen fit to our scenario: it is the twentieth of the time step used for the dynamical and microphysical processes. This choice ensures the conservation of chemical species during the
simulation.
Results
Chemical Box Model
The liquid water content (Figure 1) is equal to zero during
the first 15 min. Some initial chemical concentrations are
equal to zero; there is a chemical adjustment during the first
minutes leading to an increase in concentrations for most of
the species. During this chemical adjustment, ozone slightly
decreases. For the remaining duration of simulation, most
species show a net sensitivity to the fluctuations of liquid
water content and not only to its bulk behavior. It is noteworthy that this sensitivity is higher in the case of small
drops.
Since the two simulations differ only with respect to the
drop size, the box model results highlight the sensitivity to
this parameter. The effect of various solubilities can be seen.
However, the classification of the species according to their sensitivity to drop size does not necessarily match the classification made according their solubility which is, in a
decreasing
order: HNO
3, HCOOH,
H202, CH20,
radicals
HO-, and
CH-O
2, OH,
CH3OAH,
NO and
ozone.
Moderately
or •ow soluble
species
will be •ound
to have
strong
sensitivities to the drop diameter.
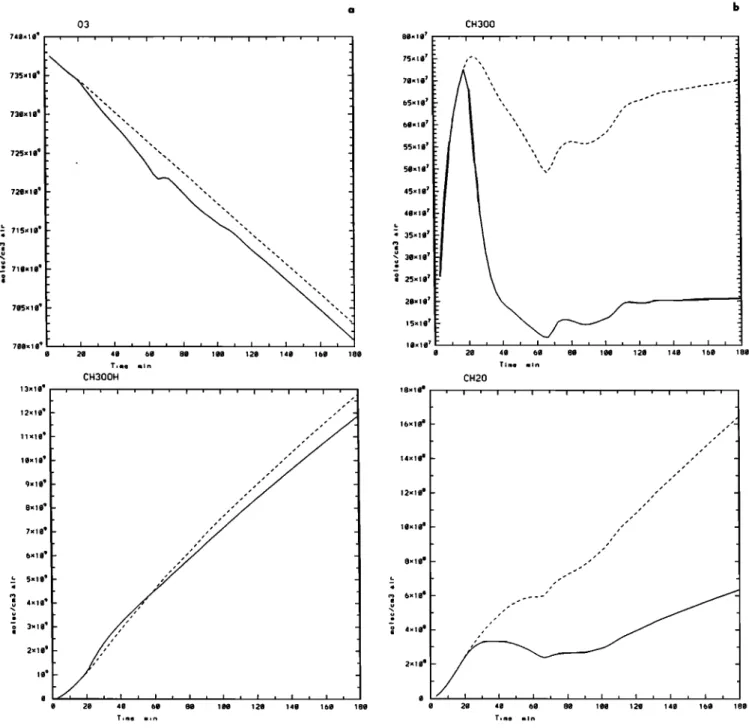
Ozone
and
CH302
H (Figure
4a) are almost
unaffected
while
the
radicals
CH30
2 (Figure
4b) and
HO
2 (not
shown)
show
a net sensitivity
to the
drop
diameter
as CH20,
OH, and
HCOOH do (Figure 4b, 4c). Gaseous concentrations of all
these species are higher in the case of large diameters except
for NO gas concentrations (Figure 4d) which are weaker in
this
case.
The RO
2 radicals
HO
2 and
CH30
2 are 5 times
higher, whereas OH is just 1.3 times higher in this last case.
NO and NO
2 are affected
differently:
NO concentrations
decrease
by a factor
of 1.4,
while
NO
2 concentrations
increase
by a factor of 1.1, leading to a 57% decrease in the
[NO]/•O
2] ratio.
These
different
behaviors
of NO and
NO•
are
likely
due
to
the
gaseous
chemical
reactions
G18
and
G
lO
(Table 1). The G19 reaction produces formaldehyde, and
i o .0 .8 .I .d .9 .2 .1 0 20 40 60 80 100 120 140 160 180
Figure 1. Box model:
variation
with time of the liquid
25,954 AUDIFFREN ET AL.' EFFECTS OF POLYDISPERSE CLOUD OC',V rG/KG• O•W IGG 1 =.,0 7.00 mox - 0.72998 m,n 0.00000 OC',v rG,'KG• [ , 500 I00 0 , i .•o 200 x(,,,.,.,) max= 0.00119278 m,n 0.00000 ORW (G,'KGI ' ' i ;00 t 50 200 2=.0 500 •00 •=.,0 200 2=-,0 5CC a . Z'..-Q97 ,•,n 0.00000 max- 0.2."7227 •,n O.OGOO0
Figure 2. Mountain wave simulation; (a,c) cloud water content q. (g/kg)and (b,d) rainwater q• (g/kg); (a,b) continental cloud, (c,d) maritime cloud (time=3hours).
hence, in the large-drop case, concentrations of formaldehyde
in the gas phase
are higher.
The [NO]/[NO2]
ratio
characterizes
the conversion
of NO into
NO
2 which
is of
particular importance since the latter leads to formation ofnitric acid and governs the production of ozone.
One can notice that there is a time delay in the response of all the scavenged species in the case of big drops in comparison with the small-drop nm (note the shift in time of
the maxima for instance). This is a noticeable effect of the
maritime cloud t=3h
1 O0 150 200 250 300
X(km)
max= 436.559 min 0.00000
Figure 3. Mountain wave simulation, maritime cloud raindrop diameter.
droplet size which can be explained by a longer time for a bigger drop to reach equilibrium with its gaseous
environment.
Although
HO
2, CH302,
and OH are moderately
soluble
species, they seem to be sensifive to the drop diameter. In
order to understand the different behavior described above, let
us recall that the gas to aqueous phase transfer is defined through the rate Lkt. This term explicitly depends on the liquid water content, the drop diameter, and the accommodation
coefficiem. The latter does not describe the solubility of the
species, but the probability for a transition to occur from gas phase to aqueous phase and vice-versa. Hence, a small value of o[ means a slow equilibration as emphasized by Sander et al. [1995]. Also, o[ is the same, (at least the same order of magnitude) for species of highly different solubilities :
CH302,
CH20,
OH, CH302H,
HCOOH
(see
Table
5). Lkt is
smaller in the case of large drops and proportional to theaccommodation coefficient.
The box model has thus proven to be useful in understanding the role of drop size in chemical processes. However, the sensitivity is likely enhanced because the cloud water is treated as monodisperse. In a real cloud, on the other
hand, only a fraction of liquid water is convened into large
drops. Moreover, this is done progressively. Large drops come from cloud water drops which already comain chemical species. This difference can be of primary importance since it leads to a completely different equilibration between the two
phases. Finally, precipitation efficiently removes the species, while in the box model, a decrease of liquid water content
allows a complete release of the chemical species imo the gas phase. Since more formaldehyde is produced in gas phase in
the large-drop
case,
more
CH20 is transferred
in aqueous
AUDIFFREN ET AL.: EFFECTS OF POLYDISPERSE CLOUD 25,955 740x I 0 + O3 ! i ! i ! i , i , i ! i i i i i , 735x 1 (a $ 725x 1 la e •' 715xlge _• 71gxla e 795x 1 71agx 1 la e Time CH300H CH300 65x 10 • 45xlg • 4gx 1 g7 - 3•x1•7 3•x 1 •7 Time CH20 1Bxllae , i m I ! I i I i I i I i I m I 16xlg e 14xlg ß 12xle e 8x10 e m 6xl la e ß u • 4xtg m / / / / / / / / / / / / / / / / / / / / / / I I I m I 49 60 80 10g 120 149 16e 18g Time min
Figure 4. Results of box model runs (a) Ozone and CH,O,H gas concentrations (at the end of m of 3hours); (b) CH, O, and CH,O gas concentrations; (c) OH and HCOOH gas concentrations; and (d) NO and NO, gas concentrations; (solid line) 20 microns, (dotted line) 200 microns.
phase, leading to a higher production of formic acid b the present acidity conditions (pH<5). It is only during the
decrease of the liquid water content that HCOOH gas
concentrations are higher (t>4000s).
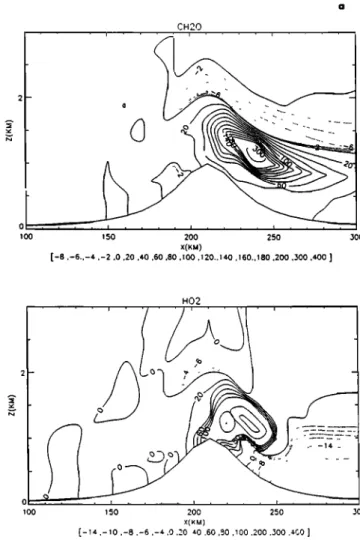
Mountain Wave Simulation: Gaseous Concentrations
Continental case. The continental cloud is monodisperse. Hence, the main differences from the box model are the additional effects of transport along the mountain slope, and of
evaporation, which essentially occurs on the downwind side.
Obviously, we f'md again some general features of the box
model.
Ozone is almost unchanged by the presence of the cloud as
indicated by the slight deformation of the isolines (Figure 5a)
around
the top of the mountain.
H202 is rapidly
depleted
after entering the cloud. With an initial value of 2 ppb, up to80% is scavenged in the middle region of the cloud. The other
species
CH302
H, CH20, and
HO
2, CH302,
OH, HCOOH
(Figure 5b) (initialized to zero), are chemically produced in gas phase and/or aqueous phase. The highest values of
[CH302H]_
are observed
at the top of the mountain
in the
interstitial [ir of the cloud.
On the contrary,
CH302,
HO
2 and OH species
that are
produced in gas phase before entering the cloud in concentrations of 8 ppt, 15 ppt, and 0.1 ppt, respectively, are
25,956 AUDIFTREN ET AL.: EFFECTS OF POLYDISPERSE CLOUD OH
' i , i , i , i , i , i , .
-
"'""
-
''''
"•
-
Time NO ' i ' i ' I [ ! ' I ' i ' x I ; I i I I I Time mln I t I • I I ' 120 140 160 189 HC00H 50x107 i I i 45x 1 0 7 40x 107 35x 1 0 7 25x 10 7 u 15x107 •o 10xIe 7 5x 10 7 ß ß ß i , i i I • I , I • 40 60 00 100 120 140 160 Time mln 19x10 7 17x10 ? 16x10 7 15x10 7 m 13x107 o 12x107 11 x107 10x10 7 NO2 w i I I I I Time Figure 4. (continued)TableS.
Values
of the
sticking
coefficients
Species Stickin[• coefficient
03 2E-3 H:O2 0.18 CH302H 0.05 CH:O 0.05 t-.R,,T• 0. i25 HO2 0.2 OH 0.05 NO2 6.3E4 NO IE4 CH•02 0.05 HCOOH 0.05 Reference Utter etal. [ 1992] Ponche et al. [ 1993] Worsnop etal. [ 1992] Lelieveld and Cmtzen [1991 ]
Van Doren et al. [ 1990] Lelieveld and Cmtzen [1991 ] Lelieveld and Cmtzen [1991] Lelieveld and Cmtzen [ 1991 ] Lelieveld and Cmtzen [ 1991 ] Lelieveld and Cmtzen [ 1991 ] Lelieveld and Cmtzen {1991 ]
efficiently depleted up to 95%, 86%, and 50% of these values.
Such depletion of OH has already been found by previous
authors
[Lelieveld
and Crutzen,
1990]. OH is less soluble
than the radicals and part of its depletion is due to the
depletion of 1-120 2 because of the reaction G5 (see Table 1).
CH20 gas mixing ratio (in par•ts per billion) decreases by
almost a factor of 2 from the upstream region to the cloudy
one.
NO and
NO
2 govern
the ozone
budget.
To appreciate
whether the cloud has an impact on the conversion of NO toNO
2, the
ratio
[NO]/[NO
2] has
been
plotted
(Figure
6). Both
upstream and downstream, outside the cloud, the ratio is 0.5.
It increases to 0.65 in the middle of the cloud. One can notice
that
the
perturbed
[NO]/[NO
2] isolevels
follow
the
isolevels
of
AUDIFFREN ET AL.: EFFECTS OF POLYDISPERSE CLOUD 25,957
2
OZONE (PPB)nuaqe cont hNOx, t=3h
38 34 • 2 100 150 200 250 300 X(KM) max= 169.703 H202 (PPB) ß , H02 (PCT• ß 100 150 200 250 300 X(KM) max= 27.8454 OH (.PPT) -. 0 100 150 200 250 300 100 150 200 250 300 X(KM) X(KM) max= 0 1 •4•83
. _ CH302H
(PPB
CH302
(PPT)
,
.-. 2 2 0 0 t"• ' 1 O0 150 200 250 300 X(KM) max= 0.0517935 CH20 (PPB) ' o.oi2O • ' 2•0
100 2 150 200 250 300 X(KM) max-- 11.7253HCOOH
(PPT)
:
lOO 150 200 250 300 1 co ] 50 200 '/(FM) X(KM) max= 0 017386- max= 3 89964 250 300Figure 5. (a) Continental cloud' O,, H,O,, CH, O,H and CH, O gas concentrations, (dme=3hours). (b)
Continental cloud; HO2, CH,O,, OH, HCOOH gas concentrations, (time=3hours).
mountain
where
below
the
cloud
[NO]/•O2]
ratio
still
shows
an effect. On the upwind side of the mountain, the
[NO]/[NO
2] isolevels
match
those
of the
mixing
ratio
(Figure
2a) drawn for values greater than or equal to 0.1g/kg. This is likely due to the advection of the small drops on the lee side.
Hence, the presence of the cloud leads to a decrease in
gaseous concentrations of most of the species, except for
CH302H
ßwhich
is enhanced.
As OH is involved
as a reactant
tn most of all the gas phase chemical reactions its depletion
into the cloud (up to 50% of the upstream value) has strong
consequences for other moderately soluble species like
CH302,
HO
2, via the reactions
G7, G10, Gll, G14. A
decrease of the production rate of the peroxyl radicals due to the depletion of OH likely contributes to their depletion. The
gas phase
production
of CH302H
depends
on HO
2 and
CH302
(reaction
G8) while
its destruction
depends
mainly
on
OH (reactions
G10
and
Gll). Although
HO
2 and
CH302
are
efficiently depleted, the inhibition of the reactions G10 and G11 by the removal of OH from gaseous phase is even more efficient, leading to an increase of the gaseous concentrations
of CH302H.
On the other
hand,
the efficient
production
of an
aqueous phase certainly contributes to the occurrence of the
highest gas concentrations in the middle part of the cloud. Owing to its low solubility, the net amount of this species produced in cloud water is immediately released from the
aqueous phase. As previously said in the introduction, it is
also
the
depletion
of HO
2 and
CH302
that
is responsible
for
the
variations
of the
ratio
[NO]/•O2] because
NO and
NO,
have
very
low solubilities.
This
is done
via the
reactions
G
and G19.HCOOH is essentially produced in aqueous phase. Hence,
it begins to appear in gas phase in the interstitial air of the cloud and its maximum gaseous phase concentration (3.9 ppt) is found downwind where evaporation of cloud droplets has
occurred releasing HCOOH into the air.
Polydisperse cloud ß maritime case. From these results,
one could expect that a different scavenging of radicals may
lead to another behavior. The simulated maritime cloud has
almost the same total liquid water content, in order to examine the influences of both the partitioning in two different drop-
25,958 AUDWFREN ET AL.' EFFECTS OF POLYDISPERSE CLOUD
size populations, and of the precipitation. For this purpose,
the relative difference (expressed in percent) of the gas phase
concentrations between the two cloud cases have been plotted
(Figure 7). The continental case has been chosen as the
reference.
The
Figure
7a clearly
shows
that
CH20,
HO
2 are
the most
semifive
species
to the cloud
type.
ca302H, OH,
I-I20•2
gas_
mixing
ratios
(Figures
7b, 7c) differ
from
the
continental case primarily on the downwind side. The relative differences reach, respectively, 6%, 20% and 80%, in an order that follows the increasing solubility of these species.
CH302
H gas
mixing
ratio
is slightly
lower
in the maritime
case and the difference with respect to the continental case is
maximized on the downwind side. For the first part of the downwind slope of the mountain, (X<240 km) OH gas mixing ratio is higher in the maritime case, becoming lower downstream. The maximum difference with respect to the continental case is reached far downstream (X=270 km). Near the top of the mountain, (X=210 km and 220 km), the OH
mixing ratio is (up to 12%) higher in the maritime case. Ten
and twenty kilometers farther downstream, a strikingly
i , i I, • • • • I • • , • I , • , 150 200 250 300 X(KM) 2 o 1 oo 30• CH20 • .. 150 200 250 X(KU) .-6.,-4. ,-2 ,0.,20 ,40.,60 ,80, 100., 120., • 40,160., 180.,200.,300 HO2 ß 2 • --
-} .5/:
...
o I • I 100 150 260 250 X(•M)[- 14 - 10 ,-8 ,-6 ,-4,0.20 ,dO .60 ,BO, 1 O0.200,500 .4C0 ]
Figure 7. Relative differences between the maritime case
and the continental case (expressed in percent; continental
case taken as reference) (a) CH20, HO:; (b) CH, O:H, OH and (c) CH,O:, H,O,.
30•
....
DNO(NO2
O0 150 200 250 300
X(KM)
Figure 6. (top) continental cloud; [NO]/[NO,],
(6me=3hours); (bottom) relative difference of the [NO]/[NOd ratio between the maritime case and the continental case (expressed in percent; continental case
taken as reference).
different behavior is observed in the vertical direction. In the
maritime case, between altitudes of 1.5 km and 1 km the
mixing ratio is higher (X=230 km and X=240 km) while
below lkm they are lower. According to the evolution of cloud
and rain waters (Figure 2) this modification corresponds to a difference in drop-size populations. At these locations, the continental cloud is evaporating with no more cloud water
below the altitude 1 km, whereas the maritime cloud, with no more cloud water since 1.5 km high, is only experiencing
precipitation. Hence, in the continental case, between 1 km up
to 1.5 km, OH is efficienfiy removed from gas phase and released at lower locations or downstream (X >240 km) while
it is drained off by precipitation in the maritime case. Far downstream, even if there is no more precipitating water, the recovery in the maritime case is slower than in the continental
case. Therefore, the differences between the two cloud cases
increase downstream (X>250 kin) owing to the wash out of
OH and
HO
2. Here
one
again
finds
an indirect
effect
of the
radicals: the recovery of the main gaseous phase reactant OH is delayed because of their scavenging/wash-out.
HO
2 experiences
the same
evolution
as OH from
upstream
to downstream, However, the difference between the two
AUDIFFREN ET AL.: EFFECTS OF POLYDISPERSE CLOUD 25,959 CH302H
'-i
...
":
...
:::"¾:?"'"::'
..
..
. .'.'•
F"X, / • ;,,(../,-%, ...
100 150 200 250 X(KU) mox= 2.4702Ore,n-- -t00 .311 OH o 1 oo 150 200 250 300 X(KU) [-20 ,-18 .-16 ,-14 .-12 .-10 ,-8 ,-6 ,-4. ,-2 ,0 .2 .4 ,6 ,8 ,10 .12 ] CH302 1 i i i • O0 150 200 250 X(KM) =[-80 -70 ,-60 ,-50 ,-.•0 .-30 ,-20 ,- 10 ,0, IO 23 ,$0 ,-,0 ,50 .60,70 .gO ] Figure 7. (continued)locations
X=220
km, HO
2 maritime
gaseous
mixing
ratio
is
up to 4 times greater than in the continental-cloud case. For
H202, the absolute
magnitude
of deviation
of the maritime
case from the continental case is as great (80%) around the
top of the mountain (positive difference) as far downstream
(negative
difference).
H20• has spatially
a slightly
different
behavior
than
OH and
•-IO
2 because
its variations
are
essentially driven by its high solubility.
The sensitivity
of CH20 to the cloud
type
is noticeably
different from these three last species. Although the maximum difference is reached around X=230 km, 240 km (with higher concentrati6ns in the maritime case) for the flow that enters
the center of the cloud, significant differences are observed
downstream. Along the flow that passes through only the
highest part of the cloud without any rainwater, a slight
difference
is observed
in gas concentrations
of CH20 with
slightly greater concentrations in the continental case. This
feature
also
remains
far downstream.
CH302
also
follows
the
same behavior (Figure 7c). In the upper part of the clouds,
CH302
is more
efficiently
scavenged
by the maritime
cloud
whereas below 2 km, its gas mixing ratio is higher in the maritime case with a maximum difference centered at X=230
km. However,
as opposed
to CH20, after
X=250 km the
differences
between
the
two
cloud-cases
disappear
for CH302.
Hence, the greatest .differences are observed for the species
CH302,
CH20 and
HO
2. Their
gaseous
mixing
ratios
in most
parts of the maritime cloud are above those of the confinereal
case. Differences up to 3004.00% are located on the
downwind side of the mountain. This strong effect can not be
explained by only the solubility of the species since CH302,
for example,
being
less
soluble
than
I-I202,
seems
to have
a
higher sensitivity to the cloud type.
The difference is greatest and positive downstream where the continental cloud water evaporates, while the maritime
cloud is reduced to only precipitating rainwater. The zone with
positive differences is located where rainwater is present both upstream and downstream. However, whereas the distribution
of q• is symmetric
with respect
to the top of the mountain
(see Figure 2), the maximum difference of the gaseous concentrations is shifted to the downwind s•de. While
continental cloud water remains on the downwind side, maritime cloud water has given way to rainwater with large
drops.
Moderately
soluble
species
like CH302,
and
HO
2 more
rapidly reach their equilibrium between phases than higher
soluble
species
like H202.
For
these
moderate
soluble
species,
the drop-size sensitivity cannot explain such a difference
between the two cloud cases. On the other hand, a sensitivity
to the bulk water content is likely responsible for gaseous
mixing ratios of these species being greater in the maritime
case than in the continental one. In fact, on the downwind
slope, the amount of liquid water in the form of rain is weak
25,960 AUDIFFREN ET AL.: EFFECTS OF POLYDISPERSE CLOUD
X=240 km and qr• is about 0.06 g/kg). Therefore, the rapid decrease of the rainwater content downwind leads to higher
CH302,
OH and
HO
2 mixing
ratios.
The other
reason
is the
decrease of the gas phase production of these species as a feedback consequence of the depletion of OH.
Observation of higher radicals concentrations in the
maritime
case
supports
a decrease
of the [NO]/[NO
2] ratio.
Reaction
G19
for the conversion
of NO into
NO
2 is favored
compared to the continental case (Figure 6b). In the maritimecase,
INO
2] is higher,
while
[NO] is lower.
The enhanced G19 reaction produces more formaldehyde
CH20.
Therefore,
for CH20 downstream,
we observe
a longer
extent of the deviation from the continental case than for
CH302, even
far away
from rain. One could
expect
that
because
CH20 is a soluble
species
of the chemical
system
(after the acids), increased gas phase production would lead to an increase of its aqueous concentrations until Henry's law is reached. However, the process of mass transfer is govemed by the term Lk t in the equations. Figure 8 presents the transfer of
H202 to cloud
water
and
to rainwater
(•=0.2) for the case
of
the
maritime
cloud.
Leaving
aside
the
dependence
on
ot
of Lk
t,
this figure shows the transfer speed of a species, regardless of
its solubility, as a function of the combined variation of the
liquid water content LWC and the drop size. Clearly, the
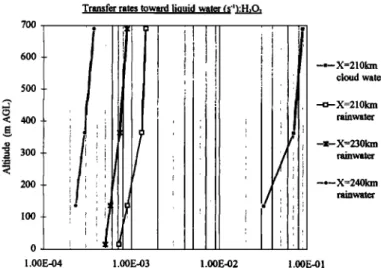
transfer is more rapid toward cloud water than toward rain. Particularly, the transfer rate decreases around X=240 km
where liquid water is almost solely composed of rainwater
with large drops. Compared to X=210 km, there is a 100-fold
difference between these two speeds. This variation of the transfer speed to aqueous phase with the drop size explains
why, experimentally, cloud water is found to be more concentrated in acids than rainwater.
The impact of the term Lkt decreases with the solubility of the species because the transfer is limited overall by the solubility (Henry's law). It becomes important in the case of
highly soluble species like c54_O and •40 '"--2 -'½ 2' The differences
of behaviors between the two radicals IS likely due to the
aqueous
reactions
: A7 and A8, HO
2 being
more
rapidly
destroyed
in aqueous
phase
than
CH302.
The concentrations
in rainwater
of OH, CH3OOH,
NO,
CI-I20,
H202 and
HCOOH
are
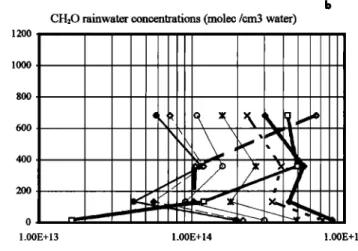
given
in molecules
per
volume
700 600 5OO 400
300
200 I00Transfer rates toward liquid water (s"):H•O,
1.00E-03 0
1.00E-04 1.00 E-02 1.00 E-01
Figure 8. Transfer rate Lk toward liquid water (cloud and rainwater) at various locations along the mountain, maritime case, a=0.2.
of water (cubic centimeters) in Figures 9a and 9b for different
vertical
sections
along
the
mountain.
OH, CH3OOH,
and
NO
show common features: except for the incipient raindrops on
the upstream edge of the cloud, their concentrations in
rainwater do not vary along the mountain. The behavior of
HCOOH,
CH20, and
I-I202
is quite
different
than
that
of the
former species. Their rainwater concentrations decrease fromalmost the middle of the mountain to the fight side. Far
downwind, the raindrops are diluted by a factor of 10 relative to their upwind concentrations.
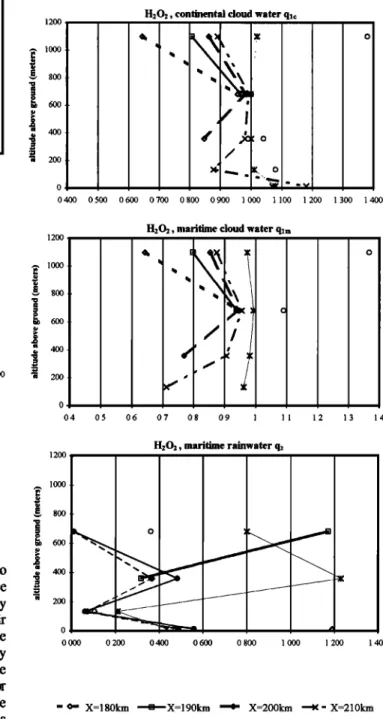
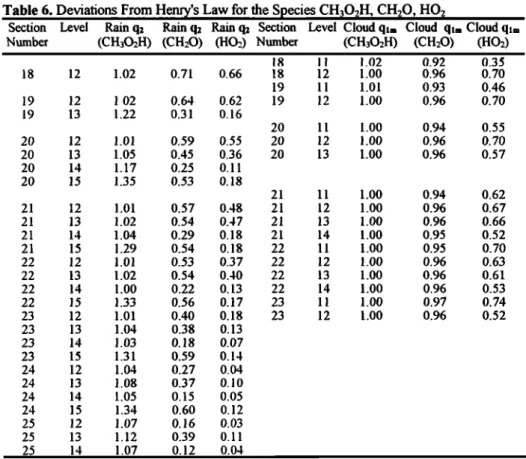
Deviations From Henry's Law
Winiwarter et al. [1992] reported that sampling in a chemically homogeneous droplet population in a cloud system
where the liquid water content varies with time leads to
subsaturation of the aqueous phase for nondissociating species. Pandis and Seinfeld [1992] gave additional explanations for the results of these samplings. Independent of
sampling duration, the variation with time of the LWC is, in
their case, the main reason for producing an apparent deviation from Henry's law equilibrium due to the non linearity of the aqueous sampling (samplings on
discontinuous time intervals).
Most of the theoretical discussions to explain deviations from Henry's law [Pandis and Seinfeld, 1992] take place in the context of a system which is characterized by (1) a constant
gas concentration of the species, (2) all droplets of the same
size have the same aqueous phase concentration at the same moment, (3) the system is spatially homogeneous and Henry's law equilibrium is obeyed at any moment. Furthermore, (4)
they assume that no mass exchange occurs between the bulk
sample and the atmosphere. However, the first assumption does not remain valid as soon as some removal processes (by
rain for example) exist. In addition, since real clouds are
composed of a large range of drop sizes, whether or not
processes like precipitation and evaporation are active, assumptions (2) and (3) cannot hold anymore.
Hence, measuremeres in polydisperse clouds can lead to deviations from Henry's law for the bulk sampling which vary with the location in the cloud. In monodisperse clouds (continental cloud in our case) one may surmise that sampling in the middle of the cloud or on the edges would give the same results. This is what we seek to verify. The ratio
C•q / LH•ffRTCg gives a measure of the deviation from Henry's law. C,q can be either the cloud water concentration
or the rainwater concentration (molec per cubic centimeter air)
-.--X=210km
cloud water and L the corresponding liquid water content. This ratio has
been
plotted
for both
the
soluble
species
H202
(Figure
11) and
-c}- X=210km
rainwater HCOOH (Figure 10). The formic acid is produced mainly in
aqueous
phase,
while H202 is essentially
produced
in gas
-•-X=230km
rainwater phase. This characteristic could lead to a completely different
-.-X=240km
response
to variations
of liquid
water
contents
and
drops
size.
rainwater In the case of a species mainly produced in gas phase, this ratio can have a value less than 1 due to by one of the following events: (1) - Gas phase production rate faster than
the transfer to aqueous phase, (2) - effect of large drops or increasing drop size, (3) - effect of evaporation (primarily
valid in the case of cloud water). On the other hand, a ratio greater than 1 could be caused by either decreasing LWC or increasing the aqueous production. For soluble species
![Table 1. List of the Reactions and Equilibrium m the Gas Phase With Corresponding Rate and Equilibrium Constants [from Lelieveld and Crutzen, 1991 ]](https://thumb-eu.123doks.com/thumbv2/123doknet/14796534.604080/4.904.133.774.130.828/table-reactions-equilibrium-corresponding-equilibrium-constants-lelieveld-crutzen.webp)
![Table 2. List of the Gas-Aqueous Phase Equilibria With Corresponding Henry's Law Constants and of Aqueous Equilibria With Corresponding DissociationConstants [from Lelieveld and Crutzen, 1991 ]](https://thumb-eu.123doks.com/thumbv2/123doknet/14796534.604080/5.904.184.725.146.539/aqueous-equilibria-corresponding-constants-equilibria-corresponding-dissociationconstants-lelieveld.webp)