Acoustic Articulatory Evidence for Quantal Vowel Categories:
The Features [low] and [back]
by
Youngsook Jung
B.S., Korea Advanced Institute of Science and Technology 2000 M.S., Korea Advanced Institute of Science and Technology 2002 Submitted to the Harvard-MIT Division of Health Sciences and Technology in partial fulfillment of the requirements for the degree of
Doctor of Philosophy in Speech and Hearing Bioscience and Technology
at the
MASSACHUSETTS INSTITUTE OF TECHNOLOGY September 2009
© Massachusetts Institute of Technology 2009. All rights reserved.
The author hereby grants MIT permission to reproduce and to distribute publicly paper and electronic copies of this thesis document in whole or in part.
Author__________________________________________________________________ Harvard-MIT Division of Health Sciences and Technology
August 21, 2009 Certified by______________________________________________________________
Kenneth N. Stevens Clarence J. LeBel Professor of Electrical Engineering and Computer Science and Professor of Health Sciences and Technology
Thesis Supervisor Accepted by_____________________________________________________________
Ram Sasisekharan, Ph. D. Edward Hood Taplin Professor of Health Sciences & Technology and Biological Engineering Director, Harvard-MIT Division of Health Sciences and Technology
Acoustic Articulatory Evidence for Quantal Vowel Categories: The Features [low] and [back]
By Youngsook Jung
Submitted to the Harvard-MIT Division of Health Sciences and Technology on August 31, 2009 in Partial Fulfillment of the
Requirements of the Degree of Doctor of Philosophy
ABSTRACT
In recent years, research in human speech communication suggested that the inventory of sound units that are observed in vowels across languages is strongly influenced by the acoustic properties of the human subglottal system. That is, there is a discrete set of possible vowel features that are constrained by the interaction of the acoustic/articulatory properties of the vowels and a small set of attributes that are observed in the subglottal region. This thesis tests the hypothesis that subglottal resonances govern vowel feature boundaries for three populations: adult speakers of English; adult speakers of Korean; and children learning English.
First, we explored the relations among F1 of vowels, the first subglottal resonances (SubF1) and the feature [low] in English. For the diphthong [ɑɪ], F1 peaks for vowels showed an acoustic irregularity near the speaker’s SubF1. For monophthongs, analysis of F1 frequency distributions shows a boundary between [+low] and [-low] vowels at the speakers’ SubF1. Second, we studied the relations among F2 of Korean vowels, SubF2 and the feature [back], to test whether the relation between subglottal resonances and the feature boundary, demonstrated earlier for English, also can be applied to other languages. Results show that the F2 boundary between [back] and [front] vowels was placed near SubF2 in Korean, as in English. Third, we explored the development of vowel formants in relation to subglottal resonances for 10 children in the age range of 2;6–3;9 years using the database of Imbrie (2005). Results show that at the earlier ages, formant values deviated from the expected relations, but during the six month period in which the measurements were made, there was considerable movement toward the expected values. The transition to the expected relations appeared to occur by the age of 3 years for most of these children, in a developmental pattern that was inconsistent with an account in terms of simple anatomical increase.
These three sets of observations provide evidence that subglottal resonances play a role in defining vowel feature boundaries, as predicted by Stevens’ (1972) hypothesis that contrastive phonological features in human languages have arisen from quantal discontinuities in articulatory-acoustic space.
Thesis Supervisor: Kenneth N. Stevens
Title: Clarence J. LeBel Professor of Electrical Engineering and Professor of Health Sciences and Technology
Acknowledgements
I thank my advisor Ken Stevens who has been an ideal teacher, researcher and mentor, and also my spiritual father. He has been a role model to me. If I become a research advisor of someone in future, I want to be like him. I could not have had a more wonderful advisor. He truly has been blessings to my life. I thank Stefanie Shattuck-Hufnagel who is a woman of encouragement. Several times with her helps, I could make a big jump and breakthrough. She has provided me a guidance of how to combine ideas into one big picture. I thank a thesis committee member Adam Albright for his brilliant feedback on my research from different perspectives I never have thought. Also, I thank Jim Glass for sparing his precious time to serve as my oral exam committee member. I thank faculty members of HST Speech and Hearing program for their support and patience, for example, by giving me a chance to take a written qualifying exam even when I was sick. Especially I thank my academic advisor John Guinan, Louis Braida, Bertrand Delgutte, Jennifer Melcher and Joseph Perkell. Without their helps, I would not have finished my PhD study.
I thank the Speech Communication group people – Arlene, Chi-youn, Jae Young, Nancy, Elisabeth, Yoko, Xuemin, Steven, Shanqing, Satrajit, Miwako and Sherry. They are simply the best. Especially I thank Chi-youn, Jae Young, Nancy and Steven for discussions and feedbacks on my research. Also, I thank friends of Speech and Hearing program – especially to Amanda, Courtenay, Lauryn, Steven and Chris.
I thank my church friends and members of “Before the Throne” for their prayers and friendship. I especially thank Jinsook, Boeun, Jiyoun, Eunkyoung, Sunghoon and Younkyung.
I thank my Dad, Mom, brother Seil, sister Seyoung and boyfriend Woojin for their unfailing love toward me. Through their prayers and encouragement, I could have survived at MIT.
Finally, I thank my Heavenly Father who has been my faithful friend and helper during my PhD period. Everything has been always enough with Him and in Him.
This research has been supported by an NIH Grant R01-DC00075 and Korean Government Scholarship for Future IT Leader.
Contents
Chapter 1. Introduction ……… 1.1 Overview .………... 1.2 General background ………... 1.2.1 Quantal theory and distinctive feature……….. 1.2.2 Vowel features and subglottal coupling……… 1.3 Objectives and significance………... 1.3.1 Aim #1………... 1.3.2 Aim #2………... 1.3.3 Aim #3………... 1.3.4 Significance………... Chapter 2. First subglottal resonance and the feature [low] ……… 2.1 Introduction………. 2.2 Experiment #1: English ………..……… 2.2.1 Method ………. 2.2.2 Results ……….. 2.3 Experiment #2: Across languages ………. 2.3.1 Method ………. 2.3.2 Results ……….. 2.4 Discussion and summary ………
Chapter 3. Second subglottal resonance and the feature [back] in Korean ………. 3.1 Introduction………. 3.2 Experiment #1: Korean monophthong vowels ………..……. 3.2.1 Method ………. 3.2.2 Results ……….. 3.3 Experiment #2: Korean diphthong vowels ………..……….. 3.3.1 Method ………. 3.3.2 Results ……….. 3.4 Experiment #3: F2 shift in /a/ and SubF2…...…………...………. 3.4.1 Method ………. 3.4.2 Results ……….. 3.5 Discussion and summary ……… Chapter 4. Development of vowel production in young children ………. 4.1 Introduction……… 4.2 Experiment #1: Subglottal resonances and F3…..………. 4.2.1 Method ………. 4.2.2 Results ……….. 15 15 16 16 17 21 21 24 27 28 30 30 31 31 33 41 41 41 47 52 52 53 53 54 58 58 59 63 63 64 69 74 74 75 75 81
4.3 Experiment #2: Formant frequency changes in relation to subglottal
resonances ………... 4.3.1 Method ………. 4.3.2 Results ……….. 4.4 Experiment #3: Predictions: vocal tract growth vs. quantal relations...…..…… 4.4.1 Method ………. 4.4.2 Results ……….. 4.5 Discussion and summary ……… Chapter 5. Summary and future directions………. 5.1 Summary and conclusion ………... 5.2 General discussion and possible future research…………...……….. 5.3 Applications……… Appendix ……… 86 86 88 104 104 107 113 117 117 121 128 130
List of Figures
Figure 1.1 Non-linear relationship between articulatory parameters and acoustic
parameters in quantal theory………
Figure 1.2 (a) Equivalent circuit model of the vocal tract coupled to the subglottal system.
(b) Simulated frequencies of the pole-zero pair due to subglottal coupling near the second subglottal resonance………...
Figure 1.3 The quantal relations between vowel formants and subglottal resonances……… Figure 2.1 F1 frequencies of English monophthong vowels for female speakers………….. Figure 2.2 Distributions of (F1 – SubF1) values across [+low] vowels and across [–low]
vowels for eight speakers of English………
Figure 2.3 An example of the trajectories of F1 frequency and F1 amplitude for a female
speaker F1, from the diphthong /ɑɪ/ in “hide” ………
Figure 2.4 The same example as in Figure 2.3. (a) F1 amplitude trajectory and F1
amplitude attenuation (ΔA1), (b) F1 frequency trajectory, F1high (the frequency on the
higher side at a frequency jump), F1low (the frequency on the lower side at a frequency
jump) and the speaker’s SubF1………
Figure 2.5 F1-F2 plot of vowels produced by male speakers from ten languages in the
world. Each points represent averaged formant values of a certain vowel for each
language...
Figure 2.6 F1-F2 plot of vowels produced by female speakers from five languages in the
world. Each points represent averaged formant values of a certain vowel for each
language...
Figure 2.7 Distribution of F1 frequencies across vowels from ten languages for male
speakers………
Figure 2.8 Distribution of F1 frequencies across vowels from five languages for female
speakers………
Figure 3.1 SubF2 vs. height across eight adult Korean speakers……… Figure 3.2 Examples of discontinuities in F2 as it passed through SubF2 in the
spectrograms for speaker F1(top), M1(middle), and M3(bottom)………...
Figure 3.3 Spectra taken from the middle of /a/ produced by a male speaker (M1)………... Figure 3.4 F1-F2 plot of /a/ tokens produced by the male speaker M5 and the female
speaker F1……… 16 19 23 34 35 37 39 43 44 46 46 55 61 65 66
Figure 3.5 The mean frequencies of F2 of the vowel /a/ when adjacent consonants are
labial and velar vs. when the consonants are alveolar/post-alveolar for the speakers M1, M5, and F1………
Figure 4.1 The age distributions of children……… Figure 4.2 An example of subglottal resonance measurements. (a) The spectrogram of the
utterance, “and Y and”, produced by a 2-year old child. (b) The F2 frequencies on the high frequency side (F2high) and on the low frequency side (F2low) of the discontinuity were
measured……….….
Figure 4.3 Examples of frequency discontinuities due to subglottal coupling for one
subject from Imbrie’s database……….
Figure 4.4 The mean frequency values of SubF1, SubF2 and F3 across children at Time 1
and Time 2………
Figure 4.5 The means of SubF1, SubF2 and F3 for children C01-C10 with chronological
age in months………
Figure 4.6 The mean values of F1 and F2 across children for vowels /æ/ and /ɑ/ at Time 1
and Time 2………
Figure 4.7 The means of F1 and F2 for the vowel /æ/ for children C01-C10 with
chronological age in months……….
Figure 4.8 The means of F1 and F2 for the vowel /ɑ/ for children C01-C10 with
chronological age in months……….
Figure 4.9 Mean F1 and mean F2 frequency changes over a 6-month period for the vowel
/æ/ for children C01-C10………
Figure 4.10 Mean F1 and mean F2 frequency changes over a 6-month period for the vowel
/ɑ/ for children C01-C10………
Figure 4.11 F1-F2 plot for vowels /æ/ and /ɑ/ for a subject C01 at Time 1 and at Time 2,
with ellipses of 1.5 standard deviations………
Figure 4.12 F1-F2 plot for vowels /æ/ and /ɑ/ for a subject C01 at Time 1 and at Time 2,
with ellipses of 1.5 standard deviations………
Figure 4.13 F1, F2, SubF1, and SubF2 frequency changes with age for the subject C04 in
Significant Change Group………
Figure 4.14 F1, F2, SubF1, and SubF2 frequency changes with age for the subject C09 in
Non-significant Change Group……….
Figure 4.15 The percentage following quantal relations in the vowel /æ/ at Time 1 and
Time 2 for Significant Change Group and for Non-significant Change
67 76 79 80 83 84 89 90 90 93 94 95 96 97 98
Group………
Figure 4.16 The percentage following quantal relations in the vowel /ɑ/at Time 1 and
Time 2 for Significant Change Group and for Non-significant Change Group………..
Figure 4.17 The percentage following quantal relations for the vowel /æ/ and the vowel /ɑ/
with age from ten children………
Figure 4.18 The percentage following quantal relations for F1 and F2 with age…………... Figure 4.19 The percentage following quantal relations for the vowel /æ/. Significant
Change Group vs. Non-significant Change Group………..
Figure 4.20 Prediction method based on quantal relations……….. Figure 4.21 Prediction method based on the vocal tract growth……… Figure 4.22 The distance between predicted centers and the ground truth centers of real
data for the vowels /æ/ and /ɑ/……….
Figure 4.23 F1-F2 plots and p-values from real data at Time 2 for the subject C01 and
from the predictions for them. (a) the real data vs. predictions based on quantal relations (b) the real data vs. predictions based on vocal tract growth………
Figure 4.24 F1-F2 plots and p-values from real data at Time 2 for the subject C04 and
from the predictions for them. (a) the real data vs. predictions based on quantal relations (b) the real data vs. predictions based on vocal tract growth………...
Figure 5.1 Features according to the degree of constrictions in the vocal tract…..…………
99 100 101 102 103 106 107 108 110 111 122
List of Tables
Table 1.1 Feature values for English vowels………. Table 1.2 Korean vowel IPA symbols and [back] value………... Table 1.3 IPA symbols and feature values for Korean consonants………... Table 2.1 IPA symbols of English vowels, feature values for [low] and carrier words………
Table 2.2 The mean and standard deviation values of SubF1………... Table 2.3 The percentage of tokens following the quantal relation between SubF1 and F1
for eight adult speakers of English……….
Table 2.4 F1 amplitude attenuation (ΔA1), high frequency side of F1 frequency jump
(F1high), low frequency side of F1 frequency jump (F1low), average of F1high and F1low (F1middle), and SubF1………...
Table 3.1 The mean and standard deviation values of SubF2, and height for each speaker…. Table 3.2 The percentage of tokens following quantal rules for eight Korean speakers……... Table 3.3 Target word list with their IPA symbols, backness, and meaning………. Table 3.4 Mean values of F2 frequencies on the high frequency side (F2high) and on the low
frequency side (F2low) of frequency discontinuity near SubF2, averaged values of F2high and
F2low (F2middle), and SubF2 measured from subglottal signals for comparisons……….
Table 4.1 American English vowel symbols, vowel feature values and target words in
Imbrie’s database (Imbrie, 2005)………...
Table 4.2 Mean F3, SubF1 and SubF2 frequencies and standard deviations in parentheses
for ten children………..……….
Table 4.3 The estimated values for the developmental slope across children in the ages 2
years and 6 months to 3 years and 8 months………..
Table 4.4 The number of measurements for F1 and F2 of vowels /ɑ/ and /æ/ at Time 1 and
Time 2……….
Table 4.5 Mean F1, F2 frequencies and standard deviations in parentheses for the vowel /æ/
at Time 1 and Time 2 for each child………...
Table 4.6 Mean F1, F2 frequencies and standard deviations in parentheses for the vowel
/ɑ/ at Time 1 and Time 2 for each child………. 18 25 26 32 33 36 40 55 56 59 62 76 83 85 86 88 89
Table 4.7 The estimated values for the developmental slope for F1 and F2 across children
in the ages 2 years and 6 months to 3 years and 8 months……….
Table 4.8 P-values of F1 and F2 of vowels /æ/ and /ɑ/ for each child for the test whether the
F1 or F2 frequency values between Time 1 and Time 2 were different or not. ………
91
Chapter 1. Introduction
1.1 Overview
Speech can be analyzed as a sequence of discrete sounds. Phonologically distinctive features were introduced to describe the attributes of discrete sound units and to categorize the sound segments (Jakobson et al., 1952; Chomsky and Halle, 1968). Binary features are assumed and assigned to the sound segment. Concerning binary distinctive features, efforts have been made for several decades to connect phonetics and phonology. Quantal theory, suggested by Stevens (1989), might provide good explanations for phonologically binary features drawn from non-linear relationships between articulatory parameters and acoustic parameters in the human speech production system.
Following ideas from quantal theory, this thesis provides evidence for binary feature aspects of speech sounds in acoustic production of vowels, in relation to subglottal resonances, in three different directions: (1) the quantal nature in F1 frequencies of vowels, relative to the feature [low], (2) the quantal nature in Korean, which has different vowel inventories from English, and (3) the quantal development in young children’s vowels. The third investigation is the primary study of this thesis research. The backgrounds, objectives and significances of this thesis study are provided in Chapter 1. We explore the quantal nature of vowels in relation to the first subglottal resonance and the universal vowel feature [low] in Chapter 2. We explore the quantal nature of Korean vowels in relation to subglottal resonances and vowel features, as the first step toward across-language studies in Chapter 3. We study the quantal development of vowels in young children in Chapter 4. Conclusions and future directions are addressed in Chapter 5.
1.2 General Background
1.2.1 Quantal Theory and Distinctive Features
In quantal theory, there are two discrete stable states, where the acoustic output in the sound production system is relatively insensitive to articulatory parameter changes, as shown in Figure 1.1. In the transition state, the acoustic output greatly varies with the articulator movement, and the placement of the articulator is hypothesized to avoid this unstable region. Therefore, the sound output tends to be quantally represented. One of the quantal stable states is matched to the [+feature], and another state corresponds to the [– feature] (Halle and Stevens, 1991).
Articulatory Parameter
Acoustic Param
eter
-feature
+feature
Figure 1.1 Non-linear relationship between articulatory parameters and acoustic parameters in
quantal theory. Region I and III: stable states, Region II: transition state. One of the quantal stable states is matched to the [+ feature], and another side corresponds to the [–feature]. (Modified from Stevens, 1989.)
This theory implies that there may be disfavored places for the articulators where the acoustic result relatively sensitive to the articulatory configuration. The acoustic sound
output may show discontinuities when the articulator moves from one stable state to another stable state when it crosses the unstable region (Halle and Stevens, 1991).
One of the examples of the evidence for quantal theory is found in the feature [anterior]. For phonation of a fricative consonant /s/ ([+anterior]), the vocal tract is excited primarily in the frequency ranges of F4 and F5, while it is excited primarily in the range of F3 for the consonant /š/ ([-anterior]). The tongue blade tends to be placed at a certain distance from the lips for the production of these consonants, because of acoustic coupling between the front of the vocal tract and back cavities which are formed by the constriction of the tongue blade in the vocal tract. This coupling effect may bring unstable regions at certain frequencies, and therefore, the tongue blade is placed to avoid the unstable regions (Stevens, 2003).
1.2.2 Vowel Features and Subglottal Coupling
Vowel Features
The vowel sounds can be modeled as the output from the vocal tract filter with the source due to the vocal fold vibration. The shape of the vocal tract varies with the placement of the articulators, which changes the characteristics of the filter. The specific position of the tongue body and lips in the mouth determines the shaping of the formants in vowels.
Linguists have divided vowels into several categories according to the features they have. The primary articulator for producing vowels is the tongue body. The articulator-bound features, [high], [low], and [back] are assigned for the tongue body. The features [high] and [low] are related to the height of the tongue body, whereas the vowel feature [back] is related to the backness of the tongue body in the mouth during the phonation. These feature values for [low] and [back] are the focuses of this thesis. The set of English vowels are listed in Table 1.1. Interestingly, the vowel categories are very similar across languages and the vowel features are hypothesized to be universal.
Table 1.1 Feature values for English vowels (from Stevens, 1998) Feature i ɪ e ɛ æ ɑ ɔ o ʌ ʊ u ɚ Low – – – – + + + – – – – – Back – – – – – + + + + + + – High + + – – – – – – – + + – Subglottal Coupling
In the modeling of vowel production, only the vocal tract above the larynx is usually taken into consideration because the glottal impedance is assumed to be very large comparing to the impedance of the subglottal system (Hanson and Stevens, 1995; Hunt, 2009). The glottal impedance is infinite when the glottal opening is zero. However, in reality because the larynx does not close completely during phonation, there is acoustic coupling between the vocal tract and the subglottal system which consists of the trachea, bronchi and lungs. The resonances of the vocal tract, usually called formant frequencies, vary with the vocal tract shape. On the other hand, the resonances of the subglottal system are assumed to be constant for a speaker during the phonation of speech. The reported values of the first two subglottal resonances are about 600, 1550 Hz for male speakers and 700, 1650 Hz for female speakers, respectively (Fant et al., 1972; Ishizaka et al., 1976; Cranen and Boves, 1987).
The equivalent circuit model of the vocal tract coupled to the subglottal system is shown in Figure 1.2(a) (Hanson and Stevens, 1995). There is a volume velocity source at the glottis Uo during phonation of vowels. The same amount of airflow through the glottis assumes to pass through the vocal tract and goes to the vocal tract and to the trachea. Um is the volume velocity at the mouth. Zsg is the impedance into the subglottal system at the glottis and Zvt is the impedance into the vocal tract.
Zsg Zg Zvt Um Subglottal Oral Uvt Glottis
Figure 1.2(a) Equivalent circuit model of the vocal tract coupled to the subglottal system. Zsg is
the impedance of the subglottal system, Zg is the glottal impedance, Zvt is the impedance of the vocal tract, Uo is the volume velocity source, Uvt is the volume velocity at the vocal tract, and
Um is the volume velocity at the mouth (Modified from Hanson and Stevens, 1995).
Figure 1.2(b) Simulated frequencies of the pole-zero pair due to subglottal coupling near the second subglottal resonance. Glottal area increased from 0.03 to 0.2 cm2, and a pole-zero pair was separated (Chi and Sonderegger, 2007).
sg vt g g o vt Z Z Z Z U U + +
= , where Uvt is the volume velocity at the vocal tract.
If Zg is finite, the subglottal coupling is not negligible. For example, at the frequencies of the subglottal resonances, the vocal tract transfer function becomes zeros because Zsg becomes a maximum. The resonances of the subglottal system introduce additional pole-zero pairs to the vocal tract transfer function. When the glottis is closed, the pole-pole-zero pairs are cancelled out. If the glottis is open, the locations of pole-zeros are separated (see Figure 1.2(b), Chi and Sonderegger, 2007). The poles which are the natural frequencies of the subglottal system remain at the same frequencies. On the other hand, the zeros are shifted to higher frequencies and the amount of the shift is depending on the size of glottal openings. The poles of the subglottal system appear as zeros in the transfer function of the coupled system (vocal tract and subglottal system together), whereas the zeros of the subglottal system appear as poles in the transfer function (Fant et al., 1972; Stevens, 1998). These pole-zero pairs bring additional prominences or attenuations into the formant spectra near the subglottal resonances. Therefore, acoustically irregular regions where formant amplitude attenuations or formant frequency jumps appear are formed near the subglottal resonances.
Quantal theory hypothesizes that the acoustically irregular region or unstable region arising from subglottal coupling may construct the vowel feature boundaries. Therefore, constrictions by the tongue body might be made to avoid the unstable region during the phonation of vowels.
1.3 Objectives and Significance
In recent years, research in human speech communication has suggested that the inventory of sound units that are observed in vowels across languages is strongly influenced by the acoustic properties of the human subglottal system (Stevens, 1998; Chi and Sonderegger, 2004, 2007; Lulich et al., 2007; Lulich 2009). That is, there is a discrete or quantal set of possible vowel features that are constrained by the interaction of the acoustic/articulatory properties of the vowels and a small set of attributes that are observed in the subglottal region below the vocal tract. In this thesis, the hypothesis that subglottal resonances govern feature boundaries was tested, by exploring the relations among subglottal resonances, vowel formants and features for three populations: adult speakers of American English (Aim #1) ; adult speakers of Korean (Aim #2) ; and children learning American English (Aim #3).
1.3.1 Aim #1
Stevens first proposed that vowels seem to be divided into [+low] vowels and [-low] vowels according to the first subglottal resonance, and into [+back] vowels and [-back] vowels according to the second subglottal resonance (Stevens, 1998). Recent research has suggested that the subglottal system plays significant roles in speech production and perception by constraining the frequency band of the speech output. Evidence of quantal relation among the second formant frequencies (F2), the second subglottal resonances (SubF2) and the feature [back] has been provided (Chi and Sonderegger, 2007; Lulich et al., 2007, Lulich, 2009).
Chi and Sonderegger predicted subglottal coupling effects such as frequency jumps and amplitude attenuations on F2 due to SubF2 by using a model with a simplified subglottal system (Chi and Sonderegger, 2007). They found acoustic irregularities such as frequency jumps or amplitude attenuations in the formant trajectories of F2 near SubF2 for adult English speakers. In addition, they found that for each speaker, the second subglottal resonance is located between the F2 frequencies of back vowels and those of front vowels (Chi and Sonderegger, 2004). Sonderegger collected F2 frequency data
between [+back] vowels and [-back] vowels is close to the mean values of SubF2, which were obtained from experiments. Lulich and colleagues carried out perception experiments by changing the locations of amplitude attenuation, characteristics of SubF2, and the results showed that the perception boundary for the backness of vowels changes depending on the modified locations of SubF2 (Lulich et al., 2007).
The results from the studies about SubF2 and the feature [back] have raised a possibility that SubF1 may play a role in defining another feature in vowels – the feature [low], as suggested by Stevens (1998). The quantal hypothesis for the feature [low], however, has not been tested in acoustic data.
One motivation for this study is to verify that it is not a coincidence that a second subglottal resonance happens to lie near the frequency boundary between back vowels and front vowels. If these observations also apply to the first subglottal resonance and the feature [low], we may provide stronger evidence for the quantal hypothesis.
Objective
The objective of the first part in this thesis research is to explore the role of the first subglottal resonance (SubF1) in defining the feature contrast of [low]. The hypothesis of this study is that SubF1 plays a role in defining the feature contrast of [low], similar to the way SubF2 plays a role in defining the feature contrast of [back]. Predictions based on this hypothesis are (1) acoustic irregularities will be observed near speaker’s SubF1 in
F1 trajectories of vowels, (2) The boundary between F1 frequencies of [+low] vowels
and those of [–low] vowels will be placed at about speaker’s SubF1, and therefore, the vowels will follow the quantal relation between F1 and SubF1, as shown in Figure 1.3. It was hypothesized that the first subglottal resonance (SubF1) lies between [+low] and [-low] vowels, while the second subglottal resonance (SubF2) forms a boundary between [+back] and [-back] vowels. There are many other vowel features, which are not shown in this figure, such as [high] and [tense]. For example, the F1 boundary between [+high] vowels and [-high] vowels is expected to lie between /i, u/ and /e, o/ in the figure.
In this part, the following questions are addressed. (i) How are the acoustic characteristics of F1 formant frequency and amplitude near SubF1 for English vowels? (ii) How do F1 frequencies relate to the speaker’s SubF1 for English? (iii) How are F1 distributions of [+low] vowels vs. [-low] vowels from various languages?
F1 F2 /i/ /u/ /o/ /e/ /æ/ /a/
[+low]
[-low]
[+back]
[-back]
SubF2 SubF1Figure 1.3 The quantal relations among vowel formants, subglottal resonances and vowel
features. It was hypothesized that the first subglottal resonance (SubF1) lies between [+low] and [low] vowels, while the second subglottal resonance (SubF2) forms a boundary between [+back] and [-back] vowels. There are many other vowel features, which are not shown in this figure, such as [high] and [tense].
1.3.2 Aim #2
As discussed in the previous section, research has suggested that the second subglottal resonance plays a role in defining the vowel feature [back] for English. These subglottal quantal effects on speech signals are theoretically expected to be universal and independent of language since the subglottal coupling is related to physics of speech production system. However, there have been few acoustic studies of the relations between subglottal resonances and vowels in other languages apart from English. For several Spanish child speakers, frequency discontinuities near SubF2 were found in Spanish front/back diphthongs (Wang et al, 2008). Quantal relations between formants and subglottal resonances were examined in German and Swabian (Madsack et al, 2008). The acoustics of subglottal coupling effects on speech spectra have not been examined in detail.
Vowel inventories are different for different languages. There are languages that have only one low vowel, so that there is no contrast of [+back] and [-back] for the low vowel (e.g., German, Mandarin Chinese, Japanese and Korean). The results of the quantal hypothesis test on German show that F2 values for the low back vowel /a/ have large variability depending on the speaker in relation to SubF2 (Madsack et al, 2008). Except for /a/, other vowels generally follow quantal relations. Large variability in F2 of the vowel /a/ was reported depending on the following nasal consonants in Mandarin Chinese (Mou, 2006). If the vowel /a/ is followed by an alveolar nasal coda /n/, F2 of the vowel is fronted, whereas F2 is low if it is followed by a velar nasal coda /ŋ/.
The question arises whether in such languages the vowel /a/ is made in a way that avoids the second subglottal resonance. Possible views are: (1) the low vowel is always [+back],
SubF2 is avoided for F2 of the low vowel, or (2) SubF2 is avoided but the low vowel is
front or back depending on the adjacent consonant. We test which of these hypotheses is correct for the low vowels in Korean which has only one low vowel.
Korean Vowels and Consonants
Korean has nine monophthong vowels, /i, e, ɛ, ø, ɨ, a, ʌ, o, u/, and their [back] features are given in Table 1.2. The vowel /ɨ/ can be replaced by the back vowel /ɯ/. The Korean vowel /ɨ/ is categorized into a central or front vowel. The vowel /a/ is categorized into a central or back vowel (Ahn, 1998; Ahn, 2006). Thus, for these vowels, the feature of [back] is not specified in Table 1.2. The front /ø/ can be removed from this list when it is regarded as a diphthong, and /e/ and /ɛ/ can be merged into /e/ vowel (Yang 1996; Ahn, 1998; Ahn and Iverson, 2005). In this thesis research, however, we follow nine vowel systems.
Table 1.2 Korean vowel IPA symbols and [back] value. ‘*’ represents ‘not specified’.
Vowel [back] /i/ – /e/ – /ø/ – /ɛ/ – /ɨ/ * /a/ * /ʌ/ + /o/ + /u/ +
Korean consonants are broadly divided into three groups depending on the place of constrictions: labial (/m, p, ph/), velar (/ŋ, k, kh/), and alveolar (/n, th, t, s/) or post-alveolar (/tʃ, tʃ h/). The primary articulator is the lips for labial consonants, the tongue body for
feature values concerning primary articulators, place of constrictions, nasality for Korean consonants are summarized in Table 1.3.
Table 1.3 IPA symbols and feature values for Korean consonants.
Feature m p ph ŋ k kh n th t s tʃ tʃ h Lips + + + Tongue blade + + + + + + Tongue body + + + Anterior + + + High + + + Low – – – Back + + + Nasal + + + Objective
The objective of the second part in this thesis research is to explore the role of the second subglottal resonance in defining the feature contrast of [back] in Korean which has different vowel inventory from English. This is a preliminary cross language study of the role of SubF2 in defining quantal feature values in different vowel systems.
The hypothesis is that SubF2 plays a role in defining feature contrast of [back] in other languages as well as in English. Predictions based on this hypothesis are (1) acoustic irregularity will be observed near speaker’s SubF2 in Korean, (2) F2 of front vowels will be placed above speakers’ SubF2, while F2 of back vowels will be placed below SubF2 in Korean.
In this part, the following questions are addressed. (i) How are the acoustic characteristics of F2 formant frequency and amplitude near SubF2 for Korean vowels? (ii) How do F2 frequencies relate to the speaker’s SubF2 for Korean? (iii) How do F2 frequency shift of the vowel /a/ due to adjacent consonants relate to SubF2 for Korean?
1.3.3 Aim #3
As discussed in the previous section, for adult speakers, the quantal relation between F2 and SubF2 was observed (Chi and Sonderegger, 2004; Madsack et al, 2008). For several children under 16 year olds (only one child younger than 6 years), the quantal relation between F2 and SubF2 was observed (Lulich, 2009). Previous observations that older children and adults already show the quantal relations raises the question when younger children begin to follow the quantal relation.
Concerning the development of vowel production in children, much research has been performed based on the analysis of changes in the vowel formant frequencies with age. (Peterson and Barney, 1952; Eguchi and Hirsh, 1969; Kent and Murray, 1982; Pentz and Gilbert, 1983; Childers and Wu, 1991, Lee et al.,1999) Studies on the development of children’s speech have been mainly focused on three areas: (1) anatomical development, (2) articulation skill development and (3) phonological development. Previous studies based on the acoustic data of vowel formant frequencies have shed light on how the anatomic development of articulatory organs relate to formant changes with age, and how children’s articulatory abilities develop with age. More direct studies of anatomical development of children’s articulation have been performed using technologies such as MRI. The dimensions of several articulation organs (e.g., vocal tract, tongue etc.) have been examined from birth to adulthood (Fitch and Giedd, 1999; Vorperian et al., 2005). The results show that the vocal tract growth rate in the first 2 years is faster than other periods of life. Beyond 2 years old, the vocal tract uniformly grows with relatively slow speed. In addition, there is acoustical evidence that vowel categories are largely in place until 24 months (Fitch and Giedd, 1999; Ishizuka et al., 2007). Ishizuka and colleagues concluded that the formant frequencies of vowels might be dominantly determined by the effect of the anatomical development of articulatory organs in the first 24 months; after 24 months, fine tuning remains, and the patterns of changes in the frequencies are different for each speaker. However, there have been few detailed acoustic studies on how fine tuning is developed.
Vorperian and Kent (2007) summarized the significant results of various studies which have been done by several researchers concerning acoustics of children’s vowels, especially vowel space. The results were summarized in relating to the anatomical changes in three parts: supralaryngeal, laryngeal and velopharyngeal systems. However, there has been very little work on the characteristics of anatomy and acoustics of subglottal system of children.
Objective
The objective of the third part of this thesis research is to explore the roles of subglottal resonances in defining the vowel features for young children in ages 2-3 years. The hypothesis is that adult-like quantal relations between subglottal resonances and formant frequencies in the vowels will be developed in this age range.
In this part, the following questions are addressed. (i) How do the first and second subglottal resonances change in the age range of 2-3 years? (ii) How do F1 and F2 change relative to the subglottal resonances in this age range for each child? (iii) Do quantal relations better predict F1 and F2 changes than vocal tract length?
1.3.4 Significance
As far as we know, the first part of this thesis research is the first acoustic study about subglottal coupling effects on F1 formant peaks and a quantal relation between F1 and
SubF1. The second part is the first detailed acoustic study about subglottal coupling
effects of SubF2 on F2 formant beside English. The third part is the first longitudinal study on the vowel production in relation to the subglottal resonances in the ages of 2-3 year olds. Preliminary results related to this thesis research were presented at the conferences of the Acoustical Society of America (Jung and Stevens, 2007; Jung et al., 2009, Jung, 2009).
The finding of these studies can be applied to clinical areas such as speech testing for maturity and/or disorders, and speech therapy. Second, the finding of this study can give insights into why natural vowel categories exist in the world and into modeling of sound acquisition in young children. Third, the finding can give us more understanding of the subglottal system, because little acoustic data is currently available for the subglottal system. Last, subglottal resonances can be used in automatic speech recognition for speaker normalization. The detailed applications are explained in Chapter 5.
Chapter 2. First Subglottal Resonance and the
Feature [low]
2.1 Introduction
In this chapter, we explore the role of the first subglottal resonance (SubF1) in defining the feature contrast of [low]. Previous research suggested that the second subglottal resonance (SubF2) defines the vowel feature contrast of [back] for English (Chi and Sonderegger, 2007; Lulich et al. 2007, Lulich 2009). The results from study on SubF2 and the feature [back] raise the possibility that SubF1 may play a role in defining another feature contrast in vowels.
The hypothesis of this study is that SubF1 plays a role in defining the feature contrast of [low], similar to the role played by SubF2 in defining the feature contrast of [back]. Predictions based on this hypothesis are (1) acoustic irregularities will be observed near a speaker’s SubF1 in F1 trajectories of vowels, (2) The boundary between F1 frequencies of [+low] vowels and those of [–low] vowels will be placed near the speaker’s SubF1. Testing this hypothesis is achieved by two experiments. In the first experiment, using Chi’s database (Chi and Sonderegger, 2007), we measured SubF1 and F1 for several adult English speakers. We examined whether acoustic irregularities such as amplitude attenuations and frequency discontinuities are observed near speaker’s SubF1 in F1 trajectories of vowels, and whether the boundary between F1 frequencies of [+low] vowels and those of [–low] vowels agree with speaker’s SubF1. In the second experiment,
F1 frequencies from several languages were collected. And we examined how the
boundary between F1 frequencies of [+low] vowels and those of [–low] vowels across languages, relates to SubF1 values obtained from the first experiment and reported in the literature.
2.2 Experiment #1: English
2.2.1 Method
Database
The database we used for this study was collected and reported by Chi and Sonderegger (2004, 2007). The recordings of speech and subglottal signals were made from nine adult (three males and six females) speakers of English, who were students or affiliates at MIT. They are denoted as M1–M3 for male speakers and F1–F6 for female speakers. All subjects except for one subject (a male speaker M1, who is a speaker of Canadian English) are American English speakers. To measure the subglottal resonances of a speaker, an accelerometer was attached to the neck of the speaker, and subglottal signals were obtained using the accelerometer, following the method demonstrated by Cheyne (2002). The sentence, “hVd, say hVd, again.” was produced, where V is an English monophthong or a diphthong vowel. The vowel list with the feature values for [low], and carrier words is shown in Table 2.1.
Acoustic Measurements
The xkl speech analysis tool was used for acoustic measurements for this experiment.
A. First Subglottal Resonance
From the subglottal signals which were captured from an accelerometer, DFT spectra using a one-pitch period length of Hamming window were obtained in the steady regions of monophthong vowels for each speaker. From the spectra, the first formant peaks were manually measured for the first subglottal resonances.
B. Monophthong Analysis
From the speech signals, the first formant peaks were measured using the 12th order LPC with a 25.6 ms Hamming window in the middle of monophthong vowels for each speaker.
Table 2.1 IPA symbols of English vowels, feature values for [low] and carrier words.
IPA Feature [low] Word
/æ/ + “had” /ɔ/ + “hawed” /ɛ/ – “head” /ɚ/ – “heard” /i/ – “heed” /ɪ/ – “hid” /ɑ/ + “hodd” /o/ – “hoed” /ʊ/ – “hood” /ʌ/ – “hud” /u/ – “who’d” /e/ – “hade” /ɑɪ/ +/ – “hide” /oɪ/ – / – “hoid” /ɑʊ/ +/ – “how’d” /ju/ – / – “hued” C. Diphthong analysis
The time courses of the frequencies (F1) and the amplitudes (A1) for the first formant peak were measured from diphthong vowels. A DFT spectrum was obtained using a window with one pitch period length. The analysis window was shifted by one pitch
period. From the spectra, the first formant frequencies and amplitudes were manually measured.
2. 2. 2 Results
First Subglottal Resonances
For nine speakers (three male and six female), the first subglottal resonance values were obtained. The mean values and the standard deviations of the frequencies of SubF1 are summarized in Table 2.2. The range of the means of SubF1 frequencies was 530–550 Hz for male speakers and 610–690 Hz for female speakers. The ranges of SubF1 are similar but slightly lower than directly measured SubF1 values which were about 600 Hz for adult male speakers and about 700 Hz for adult female speakers (Ishizaka et al., 1976; Cranen and Boves, 1987).
Table 2.2 The mean and standard deviation (in parenthesis) values of SubF1. The measurements
were obtained from 11 tokens (11 monophthongs) per speaker.
Male Female Speaker SubF1 (Hz) Speaker SubF1 (Hz) M1 547(38) F1 648(50) M2 535(48) F2 664(57) M3 540(44) F3 645(61) F4 610(60) F5 650(52) F6 690(59) Mean 541 Mean 651
Monophthong Analysis
A. Distribution of F1 in Relation of SubF1
For eight speakers (M1, M3, F1–F6) of English, the first formant frequencies were measured and compared to the speaker’s SubF1. Figure 2.1 shows F1 frequency plots along with their SubF1 values for female speakers F5 and F6, showing conforming to predictions. Each measurement point was obtained by averaging F1 values across four tokens for each vowel. Horizontal lines represent speakers’ mean SubF1 values from Table 2.2. For these two speakers, for English [+low] vowels, their F1 frequencies were above speakers’ SubF1, while F1 frequencies were below speaker’s SubF1 for [–low] vowels. This relation between F1 and SubF1 was almost always observed for other speakers. Some variation of F1 relative to SubF1 was found in the vowel /ɛ/ depending on speakers (For other speakers, see Appendix A). Quantitative analysis on this variation is given in the following section.
0 1 2 3 4 5 6 7 8 9 10 11 300 400 500 600 700 800 900 1000 F req(H z) Speaker F5: SubF1 vs F1 0 1 2 3 4 5 6 7 8 9 10 11 300 400 500 600 700 800 900 1000 F req( H z) Speaker F6: SubF1 vs F1 SubF1 SubF1 /æ/ /e/ /ɔ/ /ɛ/ /i/ /ɪ/ /ɑ/ /o/ /ʊ/ /u/ /æ/ /e/ /ɔ/ /ɛ/ /i/ /ɪ/ /ɑ/ /o/ /ʊ/ /u/ Speaker F5 Speaker F6 300 1000 1000 300 Freq (Hz) Freq (Hz)
Figure 2.1 F1 frequencies of English monophthong vowels for female speakers F5 (left) and F6
(right). Each point represents the averaged F1 value from four tokens. Horizontal lines represent
SubF1 values from Table 2.2, which were 650 Hz for the speaker F5 and 690 Hz for the speaker
The distributions of (F1 – SubF1) across [+low] vowels and across [-low] vowels are given in Figure 2.2 for each speaker. The mean values of (F1 – SubF1) across [+low] vowels were always positive (p < 0.05), whereas those of (F1 – SubF1) across [–low] vowels were always negative for each individuals (p < 0.05). This result implies that the distribution of F1 frequencies is quantally represented according to speakers’ SubF1.
F1-SubF1 -400 -300 -200 -100 0 100 200 300 400 500 F1 F2 F3 F4 Fr e q ( H z) [+low] [-low] F1-SubF1 -400 -300 -200 -100 0 100 200 300 400 F5 F6 M1 M3 Fr e q ( H z) [+low] [-low]
Figure 2.2 Distributions of (F1 – SubF1) values across [+low] vowels and across [–low] vowels
for eight speakers of English (Upper panel: subjects F1–F4, lower panel: subjects F5, F6, M1, M3).
B. Percentage Following Quantal Relation
The percentage of tokens following the quantal relation between SubF1 and F1 was calculated for eight speakers (M1, M3, F1–F6) of English, and the result is summarized in Table 2.3. For English [+low] vowels, all of /ɑ/ and /æ/ tokens and most of the /ɔ/ (expect only one case) tokens, their F1 frequencies were above speakers’ SubF1. In contrast, for [–low] vowels /i, ɪ, o, ʊ, u, e/ except for /ɛ/, F1 frequencies were always below speakers’ SubF1. F1 frequencies of the vowel /ɛ/ were often higher than speakers’
SubF1 depending on speakers: half of the speakers (four out of eight speakers) made F1
of /ɛ/ vowels above SubF1.
Table 2.3 The percentage of tokens following the quantal relation between SubF1 and F1 for
eight adult speakers of English. The total number of tokens was 292.
[+low] [–low] F1 – SubF1 > 0 F1 – SubF1 < 0 /ɑ , æ, ɔ / 99.8% /i, ɪ, o, ʊ, u, e/ 100% /ɛ/ 65.2% Total (/ɛ/ included) 96.1% 99.8% Total (/ɛ/ excluded) 100%
Diphthong Analysis
For six speakers of English (M1–M3, F1–F3), the time courses of the frequencies (F1) and amplitude (A1) for the first formant peak were obtained from the diphthong vowel /ɑɪ/. In this diphthong, the feature for [low] changes from [+low] to [–low]. The example of the time course of F1 and A1 is given in Figure 2.3. During the phonation of /ɑɪ/, F1 frequency decreases as the tongue body moves upward. At the time of about 1260 ms, F1 passes through the speaker’s SubF1. At the same time, two events occur simultaneously:
(1) there is a frequency jump in F1 formant frequency and (2) F1 amplitude becomes a local minimum. Similar observations were reported related to the second subglottal resonance (Chi and Sonderegger, 2004, 2007). In the diphthongs, where the feature changes from [+back] to [–back], frequency discontinuities or amplitude attenuations in
F2 trajectories were observed when F2 passed through the speaker’s SubF2. These
results show that the acoustic irregularities such as frequency jumps or amplitude dips in the first two formants are probably due to the subglottal coupling effect.
Figure 2.3 An example of the trajectories of F1 frequency and F1 amplitude for a female speaker
F1, from the diphthong /ɑɪ/ in “hide” (Upper: Spectrogram; Middle: F1 formant time course; Lower: F1 amplitude time course). When F1 passes through the speaker’s SubF1, there is a frequency jump in F1 formant frequency, and simultaneously, F1 amplitude becomes a minimum.
11000 1150 1200 1250 1300 1350 1400 500 1000 F 1 F re que nc y 1100 1150 1200 1250 1300 1350 1400 30 40 50 Time (ms) F 1 A m pl itud e Time (ms) F req ue nc y ( H z) 1100 0 1150 1200 1250 1300 1350 1400 1000 2000 3000 4000 5000
To quantify the subglottal effects arising from the first subglottal resonances on speech spectra, the amount of F1 amplitude attenuation (ΔA1) defined as in Figure 2.4(a), was measured from the time course of A1 in the diphthong. In addition, values of F1high and F2low were measured at the frequency jump in F1 trajectory, as indicated in Figure 2.4(b).
The measurements of ΔA1, F1high, F1low and F1middle (the average of F1high and F1low ) for
each speaker are summarized in Table 2.4. For comparisons, SubF1 values obtained from subglottal signals are also given from Table 2.2.
1150 1200 1250 1300 1350 30 35 40 45 Time(ms) A m pl itu de( dB ) A1 time course A1min ΔA1 A1max (a) 1150 1200 1250 1300 1350 400 500 600 700 800 900 1000 Time(ms) F req uenc y( H z)
F1 time course and SubF1
F1 high
F1 low
SubF1
(b)
Figure 2.4 The same utterance as in Figure 2.3. (a) F1 amplitude trajectory and F1 amplitude
attenuation (ΔA1=A1max – A1min). A1max is a local maximum of the amplitude of F1aroundthe
place of A1 min. A1min is a local minimum of the amplitude of F1 which occurs near SubF1. (b)
F1 frequency trajectory, F1high (the frequency on the higher side at a frequency jump), F1low (the
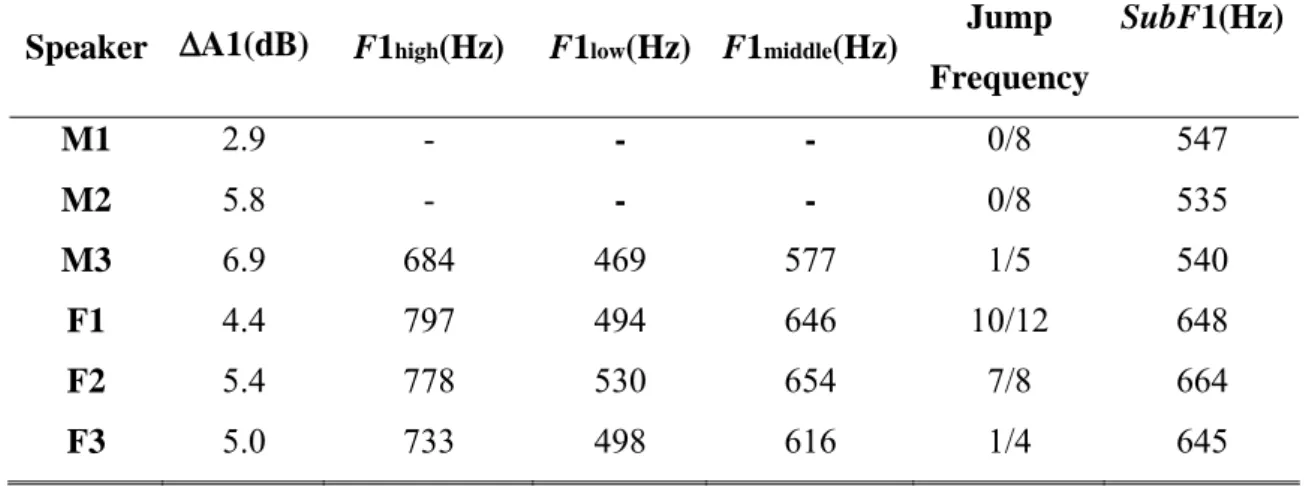
Table 2.4 F1 amplitude attenuation (ΔA1), high frequency side of F1 frequency jump (F1high),
low frequency side of F1 frequency jump (F1low), average of F1high and F1low (F1middle), and SubF1. Jump frequency represents how often F1 jump was found in the diphthongs.
Speaker ΔA1(dB) F1high(Hz) F1low(Hz) F1middle(Hz)
Jump Frequency SubF1(Hz) M1 2.9 - - - 0/8 547 M2 5.8 - - - 0/8 535 M3 6.9 684 469 577 1/5 540 F1 4.4 797 494 646 10/12 648 F2 5.4 778 530 654 7/8 664 F3 5.0 733 498 616 1/4 645
Table 2.4 shows that the amplitude attenuation in the first formant peak near the first subglottal resonance was observed for all speakers. Even when there was no F1 frequency jump, the amplitude attenuation was found. This implies that amplitude attenuation is more robust cue of subglottal coupling effects. F1 frequency jumps were more often found for female speakers than for male speaker. The values of F1middle which
were taken from the frequency discontinuities in F1 trajectories were within 40 Hz from
SubF1 values obtained from an accelerometer.
In sum, previous research about SubF2 and the feature [back] raised the possibility that
SubF1 may play a role in defining the feature [low] contrast, similar to the role of SubF2
in defining feature contrast of [back]. Testing this hypothesis for the feature [low], we measured SubF1 and F1 from English monophthong vowels for several adult speakers of English, using Chi’s data (Chi and Sonderegger, 2004; 2007). Time courses of F1 frequency and F1 amplitude were obtained from English diphthong vowels. Results show that acoustically irregular region was found near speaker’s SubF1. The boundary between
F1 frequencies of [+low] vowels and those of [–low] vowels agreed with the speaker’s SubF1.
2.3 Experiment #2: Across Languages
The results from study of the first subglottal resonance and the vowel feature [low] for English in the previous section raised possibilities that SubF1 may play a role in defining the boundary of the universal vowel feature [low] for different languages. The acoustic coupling between the oral cavity and the subglottal system are theoretically expected, independent of languages, since the coupling arises from the physical characteristics of the human speech production system. We hypothesized that SubF1 plays a role in defining the vowel feature contrast of [low], independent of language in this part. To test this hypothesis, we examined whether F1 frequencies of [+low] vowels and [–low] vowels from the various languages show the quantal relation between F1 and SubF1. To test the quantal hypothesis by using individual data of F1 and SubF1 frequencies is ideal, as in the experiment for English and Korean in this chapter and Chapter 3, respectively. Due to the limitation of data collection, the hypothesis was indirectly tested in this section, for various languages in the world.
2.3.1 Method
From a variety of reports in the literature (see Section 2.3.2.), the first formant frequencies of vowels were collected in various languages for adult male speakers and for adult female speakers, separately. The collected data of F1 were divided into two groups: a [+low] vowel group and a [–low] vowel group. We determined the F1 boundary between two groups using the method of Support Vector Machine (SVM) and compared the boundary with the value of SubF1 obtained from the first experiment and the average value of SubF1 reported in the literature.
2.3.2 Results
The results presented in this thesis research are preliminary data from ten languages – Spanish, American English, Hindi, Portuguese, Bengali, Japanese, German, Dutch, Korean and French in the 15 most widely spoken languages in the world, except for Dutch (Cervera et al., 2001; Yang, 1996; Khan et al., 1994; Escudero et al., 2009; Ray
and Ghoshal, 1996; Tohkura et al., 1992; Heid et al.,1995; Pols et al., 1973; Gendrrot and Adda-Decker, 2005) The more detailed information of number of subjects and averaged values of the first two formant frequencies of standard vowels for each language is given in Appendix B.
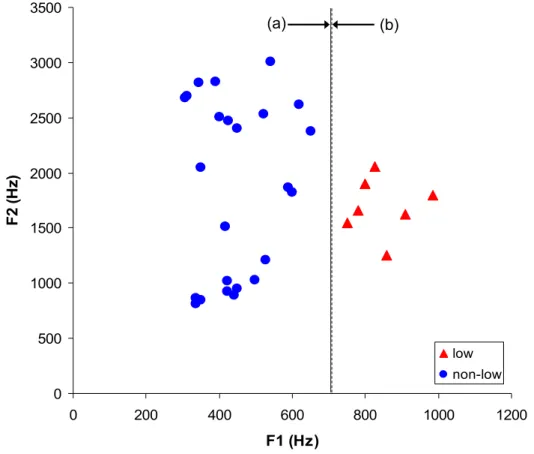
The first two formant frequencies of vowels from the languages as listed above were collected. The F1-F2 plots of the collected formant frequencies are shown in Figure 2.5 for male speakers, and in Figure 2.6 for female speakers, respectively. In Figure 2.5, there is an avoided region in F1 frequencies between 535 Hz and 650 Hz (center around 590 Hz), and by the frequency, F1 formant frequencies of low vowels and those of non-low vowels were well separated. The mean value of first subglottal resonances measured using an accelerometer from Experiment #1 for male speakers falls into this frequency gap between low vowels and non-low vowels. The boundary between low vowels and non-low vowels determined by Support Vector Machine (SVM) was F1 = 592.5 Hz. This frequency boundary agrees with the average SubF1 of 603 Hz reported in the literature (Cranen and Boves, 1987; Cheyne, 2002; Harper et al, 2001; Habib et al., 1994; Chi, 2005; Stevens, 1998).
0 500 1000 1500 2000 2500 3000 0 200 400 600 800 1000 F1 (Hz) F2 ( H z) low non-low (a) (b)
Figure 2.5 F1-F2 plot of vowels produced by male speakers from ten languages in the world.
Each points represent averaged formant values of a certain vowel for each language. Red circle: non-low vowels /e, i, o, u/, blue triangle: low vowels /a, ɑ, æ/. (a) Solid line: a boundary between low vowels and non-low vowels of collected data at 592.5Hz, (b) dashed line: average of SubF1 of males from the literature by direct measurements at 603 Hz (Cheyne, 2002; Harper et al, 2001; Habib et al., 1994; Chi, 2005).
Similar observations were made in Figure 2.6 for female speakers. There was an avoided region in F1 frequencies between 650 Hz and 750 Hz, and F1 formant frequencies of low vowels and those of non-low vowels were well separated by the avoided region. For low vowels, the F1 frequencies were higher than the avoided region, whereas the F1 frequencies were lower than the avoided region for non-low vowels.
0 500 1000 1500 2000 2500 3000 3500 0 200 400 600 800 1000 1200 F1 (Hz) F2 ( H z) low non-low (a) (b)
Figure 2.6 F1-F2 plot of vowels produced by female speakers from five languages in the world.
Each points represent averaged formant values of a certain vowel for each language. Red circle: non-low vowels /e, i, o, u/, blue triangle: low vowels /a, ɑ, æ/. (a) Solid line: a boundary between low vowels and non-low vowels of collected data at 700 Hz, (b) dashed line: average of SubF1 of males from the literature by direct measurements at 703 Hz (Cheyne, 2002; Habib et al., 1994; Chi, 2005).
The mean value of the first subglottal resonances measured using an accelerometer from Experiment #1 for female speakers falls into this frequency gap between low vowels and non-low vowels. Also, this frequency gap agrees with the reported value of 703 Hz of females (Cheyne, 2002; Habib et al., 1994; Chi, 2005; Stevens, 1998). The boundary between low vowels and non-low vowels determined by SVM was F1 = 700 Hz.
Figure 2.7 and Figure 2.8 show the distributions of F1 frequencies across vowels from various languages for male speakers and for female speakers, respectively. In Figure 2.7, there was a dip in F1 distributions at around 600 Hz. This frequency agrees with the average value 600 Hz of the first subglottal resonances of males as reported in the literature (Stevens, 1998; Cheyne, 2002; Harper et al, 2001; Habib et al., 1994; Chi, 2005).
Similarly, in Figure 2.8, there was a dip in F1 distributions at around 700 Hz. This frequency agrees with the average value 700 Hz of the first subglottal resonances of females as reported in the literature (Stevens, 1998; Cheyne, 2002; Habib et al., 1994; Chi, 2005). It is noteworthy that the overall pattern of F1 distributions across languages for male speakers was similar with the pattern for female speakers.
In sum, we indirectly tested a quantal hypothesis that SubF1 plays a role in defining the vowel feature contrast of [low], independent of language in this part. From the literature, the first formant frequencies of vowels were collected from various languages for adult male speakers and for adult female speakers, separately. The collected data of F1 were divided into two groups: a [+low] vowel group and a [–low] vowel group. The result shows that the boundary between these two groups agreed with the average value of
SubF1 from the laboratory study with English, and the reported values in the literature. In
addition, there was a disfavored frequency region in the F1 distributions near the average value of SubF1.
200 300 400 500 600 700 800 0 1 2 3 4 5 6 7 8 9 10
F1 distribution of male speakers across languages
Freq (Hz)
592Hz
Figure 2.7 Distribution of F1 frequencies across vowels from ten languages for male speakers.
There is an empty zone at around 590 Hz. The dashed vertical line represents the averaged SubF1 of males from literature.
300 400 500 600 700 800 900 1000 0 1 2 3 4 5 6 7
F1 distribution of female speakers across languages
Freq (Hz)
700Hz
Figure 2.8 Distribution of F1 frequencies across vowels from five languages for female speakers.
There is an empty zone at around 700 Hz. The dashed vertical line represents the averaged SubF1 of females from literature.
2.4 Discussion and Conclusions
The objective of this part in this thesis research was to explore the role of the first subglottal resonance (SubF1) in defining the feature contrast of [low]. Previous research suggested that the second subglottal resonance (SubF2) defines the vowel feature contrast of [back] for English (Stevens, 1989; Chi and Sonderegger, 2004, 2007; Lulich et al., 2007; Lulich, 2009). The results from study on SubF2 and the feature [back] raised the possibility that SubF1 may play a role in defining another feature contrast in vowels. It was hypothesized that SubF1 plays a role in defining the feature contrast of [low], as similar as to SubF2 plays a role in defining the feature contrast of [back]. The following questions were addressed. (i) How are the acoustic characteristics of F1 formant frequency and amplitude near SubF1 for English vowels? (ii) How do F1 frequencies relate to the speaker’s SubF1 for English? (iii) How are F1 distributions of vowels from various languages relative to the average of SubF1?
In the first experiment of this chapter, we determined whether acoustic coupling between the first subglottal resonance (SubF1) and the F1 frequency for vowels creates a region near SubF1 in which the F1 prominence shows an irregularity. The time course of F1 in relation to SubF1 was examined for diphthongs produced by a number of speakers of English using the database of Chi and Sonderegger (2004, 2007). A discontinuity in F1 or a dip in amplitude of the F1 prominence was observed as it passed through SubF1. These findings are similar to previous observations that a discontinuity in F2 or a dip in amplitude of the F2 prominence was observed as it passed through SubF2 (Chi and Sonderegger, 2004; Chi and Sonderegger, 2007; Lulich, 2009). This result implies that a frequency discontinuity or amplitude attenuation of the F1 prominence near SubF1 may be caused by the subglottal coupling.
Amplitude attenuations were a more robust cue than frequency discontinuities. Amplitude attenuations were always found near speaker’s SubF1 for each speaker, while frequency discontinuities were not always found. These observations agree with the results for F2 and SubF2 (Chi and Sonderegger, 2004; 2007). The range of amplitude
attenuations in F1 near SubF1 was 3–7 dB. The range of frequency jumps was 220–300 Hz from this study. On the other hand, the results for F2 and SubF2 show that the range of amplitude attenuations in F2 near SubF2 was 5–12 dB. The range of frequency jumps was 50–300 Hz, which is similar to that of current study of SubF1 and F1. However, frequency jumps occurred more often in F2 near SubF2 than in F1 near SubF1. In addition, the frequency jump near SubF2 was more visible in the spectrogram.
These observations may imply that the subglottal coupling effects of SubF2 on F2 are more prominent than the subglottal coupling effects of SubF1 on F1. This result agrees with the theoretical expectations that the coupling effect arising from the first subglottal resonances is less prominent because the acoustic energy loss occurs due to the glottal opening (Stevens, 1998). Variations of the amount of the frequency jump or amplitude attenuation were found depending on speakers, which may arise from the individual differences in the glottal impedance. Sometimes though the amplitude attenuation occurred, no frequency jump was found. Both acoustic observations of frequency jumps and amplitude attenuations arise from the subglottal coupling effects. However, the origins of these two acoustic results are slightly different. Amplitude attenuations of formants near subglottal resonances can occur due to the zeros introduced by the subglottal poles. At these frequencies, the sound energy in the oral cavity is expected to be absorbed by the subglottal system, causing a reduction of the amplitude of formants. On the other hand, frequency discontinuities or frequency jumps of formants near subglottal resonances may arise from the pole-zero separation due to the coupling between the oral cavity and the subglottal system. The amount of pole-zero separations is assumed to depend on the glottal opening size. Therefore, for some speakers and for a certain condition of phonation, it can be expected that the first formant peak is broader, and a pole and a zero are not well separated (Stevens, 1998; Chi and Sonderegger, 2007).
F1 frequency jumps are more often found for female speakers. In theory, larger subglottal
coupling effects would occur as the size of the glottal opening is larger. Usually female speakers have larger and longer glottal openings (Hanson, 1997). Thus, it might be expected that for females’ speech the subglottal coupling effects are more prominent. However, it is not clear whether this is related to gender differences due to limited data.


![Table 2.1 IPA symbols of English vowels, feature values for [low] and carrier words.](https://thumb-eu.123doks.com/thumbv2/123doknet/13833211.443444/32.892.330.561.222.883/table-symbols-english-vowels-feature-values-carrier-words.webp)