ISSN 1897-1695 (online), 1733-8387 (print) © 2007 GADAM Centre, Institute of Physics, Silesian University of Technology.
All rights reserved.
GEOCHRONOMETRIA 28 (2007), pp 1-8 DOI 10.2478/v10003-007-0024-z
Available online at
versita.metapress.com and www.geochronometria.pl
RESIDUAL DOSES IN RECENT ALLUVIAL SEDIMENTS FROM THE
ARDENNE (S BELGIUM)
DIMITRI VANDENBERGHE1, a, CILIA DERESE1 and GEOFFREY HOUBRECHTS2, b
1Laboratory of Mineralogy and Petrology (Luminescence Research Group), Geological Institute, Ghent University,
Krijgslaan 281 (S8), B-9000 Gent, Belgium
2Unité de Géographie physique et Quaternaire – Hydrographie et géomorphologie fluviatile, Institut de Géographie,
B-4000 Liège, Belgium
Received 28 June 2007 Accepted 21 August 2007
Abstract: We report on our first investigations into the potential of optical dating for determining the rate of river flood sedimentation in the Ardenne region (S Belgium). Two samples collected from a recent alluvial deposit were used to investigate the extent of resetting in different particle size frac-tions of quartz (4-11 µm, 63-90 µm, 90-125 µm, 125-180 µm, 180-212 µm and 212-250 µm) as well as in polymineral fine (4-11 µm) grains. Both samples show satisfactory OSL and IRSL characteris-tics. The IRSL signals from the polymineral fine grains yield an equivalent dose (De) of 3-4 Gy, while
a De of 0.3-0.6 Gy was measured using large aliquots of quartz. Small aliquot analyses of 63-90 µm
and 212-250 µm quartz grains confirm that the coarser fraction contains more grains with lower De’s.
Furthermore, for a modern sample (< 3 years old), ~60% of the aliquots yields a De consistent with
zero, indicating that these contain only well-bleached grains. These findings suggest that it might be possible to extract the true burial dose from dose distributions measured using small aliquots of coarse–grained (e.g. 212-250 µm) quartz.
Keywords: optical dating, resetting, alluvial deposits, Ardenne
1. INTRODUCTION
Knowledge on the rate by which sediment is stored in floodplains is essential for understanding the impact of environmental and climatic forcing on the hydro-sedimentary dynamics of rivers. In the Ardenne region (S Belgium; Fig. 1), several tracers have been used to estimate the age of the deposits in the alluvial plains, such as reworked tephra and metallurgical slag. By means of iron slag, for instance, it has been shown that sedimenta-tion in the floodplains has been particularly important from the Middle Ages onwards (Houbrechts, 2005; Hou-brechts and Petit, 2006). The sedimentation rates vary between 10 to 20 cm/century (depending on rivers and study sites), values which can be explained by important soil erosion related to the production of charcoal for the iron metallurgy between the 15th and the 19th century.
Through the use of these tracers, however, only relative ages for sediment deposition are obtained; precise
sedi-mentation rates cannot be determined, nor can fluctua-tions in sedimentation be recognised. Radiocarbon dating is often not applicable, either owing to the lack of suitable organic material or because the age range of interest is not covered by the technique. In any case, radiocarbon dating determines the time of sediment deposition indi-rectly as it uses associated material and/or intercalated horizons. The general absence of precise age information strongly hampers the interpretation of the deposits, as it prevents comparison of sedimentation rates between different historical periods, and hence evaluating the rivers’ response to variations in climate and land-use.
Optical dating uses the constituent mineral grains of the sediment itself, and it allows determining the time of sediment deposition and accumulation directly. The tech-nique rests on the assumption that the luminescence clock in the minerals is completely reset (or zeroed) during their exposure to sunlight prior to deposition. In fluvial environments, however, the sediment grains may have received only a limited exposure to daylight. A situation of incomplete resetting may lead to age overestimation,
Corresponding author: D. Vandenberghe e-mail: [email protected]
aPostdoctoral Fellow of the Research Foundation – Flanders (FWO-Vlaanderen) bPostdoctoral Researcher – National Foundation of Scientific Research (NFSR) –
especially in the case of relatively young sediments for which any remnant signal might be a significant propor-tion of the signal acquired during burial. Significant im-provements in both instrumentation and measurement technology have been made over the last few years, al-lowing the problem of incomplete resetting to be exam-ined in great detail. This, in turn, has resulted in an in-creased number of studies in which optical dating could be successfully applied to fluvial deposits. Comprehen-sive reviews on the application of optical dating to fluvial deposits, and its intricacies, have been presented by Wallinga (2002), Murray and Olley (2002) and Jain et al. (2004).
Encouraged by the recent developments in optical dat-ing technology, we initiated an explorative study, which aims at establishing whether or not the technique has potential for determining the rate of river flood sedimen-tation in the Ardenne region. In this paper, the first results of this pilot study are presented; more specifically, we
examine the extent of resetting in two recent alluvial samples from this specific deposition environment. 2. GEOLOGICAL CONTEXT AND SAMPLING
Rivers from the Ardenne (S Belgium; Fig. 1) are sin-gle channel rivers. They have quite a marked slope (vary-ing from 0.001 m/m for larger rivers to 0.02 m/m for headwater streams), and generally develop meanders in narrow floodplains. The specific stream power of these rivers, for the bankfull discharge, is comprised between 25 and 150 W/m² (Petit et al., 2005). Their bedload con-sists mainly of phyllites, quartzites, schists and sand-stones from the Cambrian and Eodevonian periods. Ac-cording to rivers, the D50 varies from 1.5 cm to 15 cm.
The rivers are slowly moving laterally and are reworking the gravel layer inherited from the last cold periods (Juvi-gné, 1979). This layer is overlying the bedrock and is covered by sandy-silt deposits of one to two meters thick.
The samples used in this study were collected from a recent sandy alluvium deposited at the exit of a cut-off meander of the Chavanne River. The Chavanne is a small Ardenne river (catchment area 21 km2) belonging to the
Meuse catchment (Fig. 1). In the upstream part, the Cha-vanne River is a gravel bed river (D50 = 4.0 cm) confined
to a single channel. The bedload consists mainly of phyl-lites, quartzites and arkoses from Ordovician and Eode-vonian periods. The sampling site is situated 5 km from the spring. In this sector, the Chavanne River develops meanders in a narrow floodplain (~50 m wide). The width of the river is about 4 m and the specific stream power is of the order of 40 W/m2 for the bankfull
dis-charge. The floodplain deposits consist mainly of sand and silt. According to the sedimentation study by Hou-brechts and Petit (2006), ~80 cm of sediment has been deposited on the floodplain since the 16th century.
Ap-proximately 2 km downstream of the study site, the char-acteristics of the river suddenly change. The slope, which was comprised between 0.5 and 1% in the upper part, increases up to 2%. The channel layout becomes sub-rectilinear and a step-pool system starts to appear. The D50 of the bed material increases to 10.0 cm and some
boulders of arkose are disseminated in the bed.
The sampling surroundings and the sampling site are Fig. 1. Map showing the location of the Chavanne River in the
Ardenne, S Belgium.
01
02
Fig. 3. Detail of the
sam-pling. The dashed white line shows the level of the sedimentation mark on 05/07/2006.
a b
c
Fig. 2. Photographs of the
pling surroundings (a), the sam-pling site (b), and the sedimenta-tion mark that was installed at the sampling site on 16/10/2003 (c).
shown in Figs 2a and 2b, respectively. A sedimentation mark was installed at the sampling site on 16th October
2003 (Fig. 2c). On the 5th of July 2006, a small profile pit
was dug and two samples were collected by hammering stainless steel cylinders in the sediment. The first sample (GLL-061301) was collected immediately above the level of the sedimentation mark; the second sample (GLL-061302) was collected some 20 cm below it (Fig. 3). While the first sample is known to be less than three years old, the latter is of unknown age. However, based on the high sedimentation rate as observed since the placement of the sedimentation mark (about 8 cm in less than three years), it is believed to be less than a few dec-ades old.
3. SAMPLE PREPARATION AND ANALYTICAL FACILITIES
In the laboratory, different particle size fractions of quartz (4-11 µm, 63-90 µm, 90-125 µm, 125-180 µm, 180-212 µm, 212-250 µm) as well as polymineral fine (4-11 µm) grains were extracted from the inner material of the sampling tubes using conventional sample prepara-tion techniques (Frechen et al., 1996; Lang et al., 1996; Mauz et al., 2002). The purity of the quartz extracts was confirmed by the absence of a significant infrared stimu-lated luminescence (IRSL) response to a large regenera-tive beta dose. For measurement, coarse (> 63 µm) quartz grains were mounted on stainless steel discs; the fine (4-11 µm) grains were deposited on aluminium discs through settling from a suspension in acetone.
Luminescence measurements were performed in automated Risø readers. Quartz was stimulated with blue (470±30 nm) light and the luminescence emissions were detected through a 7.5 mm thick Hoya U-340 filter. Po-lymineral fine grains were stimulated using IR-diodes (875 nm) and the IRSL-emission was detected through a BG39/CN7-59/GG-400 filter set. Details on the meas-urement apparatus can be found in Bøtter-Jensen et al. (2003).
4. LUMINESCENCE CHARACTERISTICS
The luminescence characteristics of all grain and min-eral fractions were investigated using large (8-10 mm diameter) aliquots and using the single-aliquot regenera-tive-dose (SAR) procedure (Murray and Wintle, 2000).
The quartz measurements were carried out using a preheat of 10 s at 180°C and a cutheat to 160°C. The SAR procedure involved four regenerative doses (0.5, 0.9, 1.4, and 1.9 Gy) and a zero dose, a repeated first regenerative dose (0.5 Gy) and a fifth regenerative dose (2.3 Gy). Additionally, a second measurement of the response to the highest regenerative dose was made; this time the sensitivity to stimulation with infrared light was checked before stimulation with the blue diodes. The purpose of this treatment was to allow identification of aliquots with a significant feldspar contamination. The size of the test dose was equal to the highest regenerative dose (2.3 Gy). Optical stimulation was for 40 s at 125°C and the initial 0.3 s of the OSL decay curves was used in further calculations, minus a background derived from
the last 4 s of stimulation. The same background as calcu-lated for the natural and regenerated signals was used for the corresponding test dose signals. To minimize possible effects of recuperation, a high temperature stimulation (for 40 s at 280°C) was added after each measurement of the test dose response (Murray and Wintle, 2003).
For the polymineral fine grains, a preheat treatment of 1 min at 250°C was applied after both regenerative and test doses (Auclair et al., 2003). The SAR procedure involved measuring the response to four regenerative doses (3, 6, 9 and 12 Gy), a zero dose, a repeated first regenerative dose (3 Gy) and a fifth regenerative dose (15 Gy). The size of the test dose was 6 Gy. Stimulation of the polymineral fine grains was for 100 s at 40°C using the IR-diodes. Calculations used the initial 0.8 s of the IRSL-decay curve minus a background derived from the last 10 s of stimulation; the same background as calcu-lated for the natural and regenerated signals was used for the corresponding test dose signals. An elevated tempera-ture infrared bleach (40 s at 290°C) was inserted after each measurement of the test dose response.
Representative luminescence decay and growth curves are shown in Fig. 4 for an aliquot of 212-250 µm quartz (a), 4-11 µm quartz (b), and polymineral fine (4-11 µm) grains (c) extracted from sample GLL-061301. All grain and mineral fractions emitted clearly detectable natural luminescence signals. The growth of the signals with dose could be well approximated by linear or single saturating exponential functions. In general, both samples behaved well in the SAR-OSL and SAR-IRSL protocols, with recycling ratios close to unity and recuperation less than a few % of the corrected natural signal. In all ex-periments reported in the following, a measured dose value was accepted if the recycling ratio, the recuperation and the IRSL/BLSL ratio (in the case of quartz) did not exceed a threshold set at 10%.
One of the main problems specific to the dating of young material is thermal transfer, which is the transfer of charge by heating from insensitive (or less light-sensitive) but thermally stable traps, into light-sensitive traps. If significant, it leads to an overestimation of the equivalent dose (De) and hence the age. From the
descrip-tion of the phenomenon, it can be expected to be more of a concern for younger samples, and even more so for those deposited in environments where exposure to sunlight is limited. Thermal transfer has long been con-sidered a limitation to the dating of young samples. In their review of twenty-one studies dealing with the appli-cation of optical dating to young (< 1000 years) sedi-ments, however, Madsen and Murray (personal commu-nication) showed that thermal transfer is usually negligi-ble provided that the preheat is low (< 200°C). The pres-ence and significance of thermal transfer in our quartz samples was tested using the 212-250 µm quartz fractions of samples GLL-061301 and -02. Aliquots were first bleached twice for 100 s using the blue diodes at room temperature; the two bleaching steps were separated by a 10 ks pause. The aliquots were then measured using the SAR protocol as outlined in the above, employing a range of different preheat temperatures. The results are shown in Fig. 5. It can be seen that thermal transfer sets in at preheat temperatures of as low as 200°C, and becomes
increasingly important at higher preheat temperatures. Based on these findings, a preheat regime of 10 s at 180°C was adopted in all further experiments. The ther-mally transferred dose from this preheat treatment was found to be 0.008±0.008 Gy and 0.024±0.008 Gy for samples GLL-061301 and -02, respectively. It can be added that the amount of charge transferred by the 180°C preheat was also quantified for the 63-90 µm quartz ex-tracts; samples GLL-061301 and -02 yielded values of 0.006±0.003 Gy and 0.002±0.003 Gy, respectively. The difference in results obtained for sample GLL-061302 (about an order of magnitude) is not understood at pre-sent.
For the polymineral fine grains, a similar experiment was carried out in which aliquots were first bleached for 1 hour in a Hönle SOL 2 solar simulator, and were subse-quently measured using SAR as outlined in the above. These experiments, however, were carried out for a pre-heat of 1 min at 250°C only. A residual SAR-IRSL dose of 2.1±0.2 Gy was measured for sample GLL-061301; sample -02 yielded a dose of 2.7±0.3 Gy.
The overall performance of the SAR protocol was evaluated through dose recovery tests (Murray and Wintle, 2003). The experiments were carried out for both samples, and for quartz grains from the 4-11, 63-90 and 212-250 µm fraction, as well as for the polymineral 4-11 µm grains. Aliquots of quartz were bleached twice using the blue diodes for 100 s at room temperature, separated by a 10 ks pause; polymineral fine grains were bleached for 1 hour in a Hönle SOL 2 solar simulator. After bleaching, the aliquots were given a dose equal to the expected natural dose, and were measured using SAR. The results are summarised in Fig. 6. For both samples and all fractions, the given doses can be recovered to within 5%. The overall (n=2) average measured to given
0.0 0.5 1.0 1.5 2.0 2.5 0.0 0.4 0.8 1.2 a) 212-250µm Q Correc ted OSL (0.16s -1 ) Dose (Gy) 50 100 10 20 30 Natural Regen (~0.5 Gy) Time (s) Co u nts (0 .1 6s ) -1 0.0 0.5 1.0 1.5 2.0 0.0 0.5 1.0 b) 4-11µm Q C o rrected OSL (0 .1 6s -1 ) Dose (Gy) 200 400 10 20 30 Natural Regen (~0.3 Gy) Time (s) C o unt s ( 0. 16 s) -1 0 5 10 15 0 1 2 c) 4-11µm pfg Corrected IRSL ( 0.4s -1 ) Dose (Gy) 100 200 20 40 60 80 Natural Regen (~3.0 Gy) Time (s) C ount s ( 0. 4s -1)
Fig. 4. SAR growth curves and illustrative luminescence decay curves
(inset) for an aliquot of a) 212-250 µm quartz, b) 4-11 µm quartz and c) polymineral fine (4-11 µm) grains extracted from sample GLL-061301. The solid and open squares represent regenerative dose and recycling points, respectively; the open diamond is the natural signal and the solid circle the response to a zero dose.
160 180 200 220 240 260 280 0.0 0.2 0.4 0.6 The rm al tr ansfer ( G y) Preheat temperature (°C) GLL-061301 GLL-061302 212-250µm Q
Fig. 5. Dependence of thermally transferred dose on preheat
tempera-ture for 212-250 µm quartz grains extracted from samples GLL-061301 (solid circles) and -02 (solid squares). Shown are the averages ±1 standard error. The dashed line (eye guide) represents a thermally transferred dose equal to 0 Gy.
4-11 63-90 212-250 0.0 0.8 1.0 1.2 Ratio measur ed / g iven dose Grain size (µm) , : GLL-061301 , : GLL-061302
filled symbols: quartz open symbols: pfg
Fig. 6. Data from the dose recovery experiments for samples
GLL-061301 (circles) and -02 (squares). The open symbols refer to the results obtained on the polymineral fine (4-11 µm) grains. Shown are the averages ±1 standard error. The solid and dashed lines are meant as eye guides and represent a measured/given dose ratio equal to unity and a 5% deviation of this ratio from unity, respectively.
dose ratio obtained with the SAR-OSL protocol is 1.01±0.02. The SAR-IRSL protocol yields an overall dose recovery of 1.00±0.09, but it should be noted that the 2-3 Gy residual dose (see above) was subtracted from the measured dose values. The results from the dose re-covery tests indicate that the SAR-OSL and SAR-IRSL protocols are suitable for determining the De in the
sam-ples.
5. EQUIVALENT DOSE DETERMINATION Large aliquots
In a following series of experiments, the SAR proto-col was used to determine the De in large aliquots of
polymineral fine grains (10 mm diameter aliquots) and of quartz of different grain sizes (8 mm diameter aliquots). These experiments aimed at establishing whether or not grains of different size and mineralogy are bleached to a different degree. At least 16 aliquots were measured for each grain size fraction, with the exception of the 4-11 µm quartz fraction, for which 11 aliquots were measured. Equivalent dose determination used the SAR protocol as outlined in Chapter 4.
In Fig. 7a the average De’s (±1 standard error) are
plotted versus grain size. For both samples, the polymin-eral fine grains clearly yield significantly higher equiva-lent doses (the residual dose of 2-3 Gy has been sub-tracted from all SAR-IRSL De’s plotted in Fig. 7). Quartz
yields much lower De values, and no systematic variation
of average dose with grain size is apparent. The individ-ual De values for all grain and mineral fractions are
shown in Fig. 7b. It can be seen that all aliquots yield measurable doses. The results for the 4-11 µm fraction are very reproducible, although the poor luminescence sensitivity of the polymineral fine grains limited the measurement precision (see inset of Fig. 4c). Each of the coarser (> 63 µm) fractions exhibits some spread in the measured doses. It indicates that all aliquots consist of a mixture of grains which have been reset to various de-grees. Obviously, the average number of grains on each aliquot depends on the size of the grains. Whereas there may be tens of thousands of 4-11 µm grains on a large aliquot, the number of 212-250 µm grains is probably only of the order of a few hundred. As the scale of analy-sis increases, one may expect that the effects of incom-plete resetting are progressively averaged out within each disc, resulting in more reproducible results which sys-tematically overestimate the true burial dose. This is nicely illustrated by comparing the data obtained for the 4-11 µm quartz with those for the coarser quartz frac-tions. It is interesting to note, however, that the effect of dose heterogeneity being averaged out is not reflected within the 63 to 250 µm range. Apart from some obvious outliers, the results for the coarser grains generally appear at least as reproducible as for the finest sand-sized quartz, and they verge towards lower De values.
The most recent sample (GLL-061301) provides most information on the degree of resetting. An average SAR-IRSL De value (±1 standard error) of 3.3±0.2 Gy was
obtained for the polymineral fine grains, while the aver-age OSL-De for the fine-grained quartz is 0.33±0.01 Gy.
Rejecting the four obvious outliers (> 1 Gy) for the
212-250 µm fraction results in an average De of
0.07±0.01 Gy; including them gives an average dose of 0.4±0.2 Gy.
Small aliquots
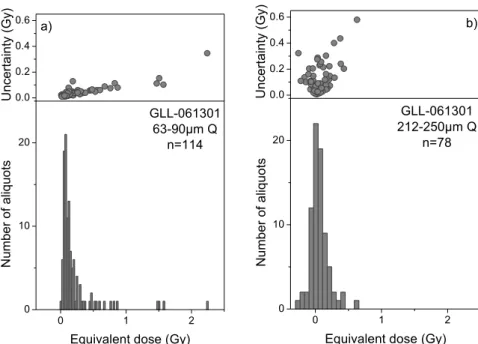
To examine the issue of incomplete resetting to greater detail, the distribution of De in quartz from two
particle size fractions (63-90 and 212-250 µm) was inves-tigated using small (2 mm diameter) aliquots. These in-vestigations were carried out on the modern sample GLL-061301 (< 3 years old). On average (estimated by count-ing the number of grains on 10 discs), the 63-90 µm ali-quots contained ~500 grains; the 212-250 µm aliali-quots contained ~30 grains. The De distributions were measured
using the SAR protocol as outlined in the above. For each grain size fraction, 120 small aliquots were analysed. In addition to the aforementioned criteria, De values were
included in the distributions if the relative error on the test dose signal did not exceed 30%. The results are rep-resented as histograms in Fig. 8.
The results obtained on the 63-90 µm fraction are clearly more scattered and spread out over a larger dose range, leading to an asymmetric distribution (Fig. 8a).
4-11 63-90 90-125 125-180 180-212 212-250 0 2 4 6 a) Equivalent dose (Gy) Grain size (µm) 4-11 63-9090-125125-180180-212212-250 0.0 0.4 0.8 4-11 63-90 90-125 125-180 180-212 212-250 0 2 4 6 , : GLL-061301 , : GLL-061302 open symbols: pfg filled symbols: quartz
b)
Equiva
lent d
ose (Gy)
Grain size (µm)
Fig. 7. a) Average De values (±1 standard error) in large aliquots of
polymineral fine grains (open symbols), and quartz of different particle sizes (filled symbols). The circles refer to the data for sample GLL-061301, the squares to those for sample GLL-061302. The dashed line at an equivalent dose equal to zero is meant as an eye guide. The inset shows the same data for different grain sizes of quartz only. b) Individual De’s of the data shown in a); error bars represent 1 sigma
and arise from counting statistics and the fitting procedure (for details see Vandenberghe, 2004).
The unweighted average De (±1 standard error) is
0.22±0.03 Gy; the median value is 0.11 Gy. The De’s
obtained for the coarser 212-250 µm fraction, on the other hand, appear symmetrically distributed around a central value close to zero (Fig. 8b). The unweighted average De is 0.06±0.02 Gy, with a median of 0.04 Gy.
Within 1 sigma uncertainty (which includes counting statistics and the uncertainty in the growth curve that has been fitted), ~60% of the 212-250 µm aliquots yield a De
consistent with 0 Gy; in the case of the 63-90 µm ali-quots, this is only 2%. The small aliquot results confirm that the coarser fraction contains more grains with lower De’s, and that a relatively large percentage of these
coarser grains was completely reset. The average dose (±1 standard error) and median value of the lowest 60% of the 212-250 µm aliquots are 0.009±0.017 Gy and 0.005 Gy, respectively.
To test the general performance of the measurement procedure for application to small aliquots, a dose recov-ery test was performed as well. This test was applied to 120 small aliquots of 212-250 µm quartz grains extracted from sample GLL-061301, and it was carried out exactly as outlined in Chapter 4. The results are shown in Fig. 9. The distribution of measured doses is symmetric, with an unweighted average (±1 standard error) of 0.45±0.02 Gy and a median of 0.44 Gy. The ratio of the unweighted average measured dose to the given dose is 0.97±0.03. The dose recovery results demonstrate that the measure-ment procedure yields accurate De values for small
ali-quots. Compared to the natural doses, the given doses were measured with a higher precision owing to the lar-ger dose of 0.47 Gy that was administered in the labora-tory. Therefore, the measured dose distribution is some-what tighter. Apart from that, the shape of the dose distri-bution obtained on quartz grains which were completely zeroed in the laboratory is quite similar to that of the natural dataset (Fig. 8b).
In a final experiment, the De distribution in sample
GLL-061302 was also measured using 120 small aliquots
of 212-250 µm quartz grains. The results are shown as a histogram in Fig. 10. The unweighted average (±1 stan-dard error) of this distribution is 0.39±0.20 Gy with a median of 0.06 Gy. Rejecting the four obvious out-liers (De > 2 Gy) yields an unweighted average (±1
stan-dard error) of 0.11±0.02 Gy and a median of 0.05 Gy. Apart from these outliers at higher doses, the shape of the De distribution is very similar (if not identical) to that
obtained for the 212-250 µm aliquots of sample -01 (Fig. 8b). The lowest 60% of the aliquots give an un-weighted average De of 0.013±0.010 Gy and a median
value of 0.031 Gy; 60% is the fraction of aliquots which, within 1 sigma, yielded a dose consistent with zero in sample GLL-061301.
6. DISCUSSION AND CONCLUSIONS
The luminescence characteristics of two recent allu-vial samples from the Ardenne region (S Belgium) were investigated in terms of behaviour in the SAR protocol, dose response and dose recovery. It is concluded that the employed SAR-IRSL and SAR-OSL protocols are suit-able for determining the De in polymineral fine, and fine
and coarse quartz grains, respectively. Sensitivity changes occurring throughout a SAR measurement se-quence are accurately corrected for, and a known dose given prior to any heating can be accurately measured. A relatively low preheat of 10 s at 180°C does not appear to cause a significant transfer of charge in the quartz samples. In the case of the polymineral fine grains, how-ever, residual doses of 2-3 Gy were obtained after pre-heating laboratory-zeroed samples for 1 min at 250°C. Dose recovery results lend some validity to an empirical correction procedure in which this residual dose is simply subtracted from the measured dose.
The results from the large and small aliquot analyses (Figs 7 and 8) indicate that the coarsest quartz grains (212-250 µm) yield the lowest De values. This grain size
dependency has been reported before (summarised by
0 1 2 0 10 20 a) GLL-061301 63-90µm Q n=114 Nu mb er o f a liq uo ts
Equivalent dose (Gy)
0.0 0.2 0.4 0.6 U ncer ta inty (Gy) 0 1 2 0 10 20 b) Number of aliquots
Equivalent dose (Gy) GLL-061301 212-250µm Q n=78 0.0 0.2 0.4 0.6 Uncertainty (Gy )
Fig. 8. De results obtained using small
aliquots of 63-90 µm and 212-250 µm quartz grains extracted from sample GLL-061301. For each grain size, 120 aliquots were measured; n is the number that could be accepted. A plot of uncertainty versus De is shown above each
histo-gram; the median from this uncertainty distribution was used for binning the data (Lepper et al., 2000).
Wallinga, 2002; see also Truelsen and Wallinga, 2003 and Alexanderson, 2007). IRSL signals from polymineral fine grains yield equivalent doses which are at least one order of magnitude higher than those measured using quartz. The same observation has been reported by Fuchs et al. (2005) in their study of recent river flood sediments in Saxony (Germany).
In general, the small aliquot distributions measured using 212-250 µm quartz grains are wide but relatively symmetric (Figs 8b and 10). Outliers towards the high dose end of the distribution can be attributed to the pres-ence of incompletely reset grains. Comparison of Figs 8b and 10 with previously published De distributions for
young fluvial material (e.g. Olley et al., 1997, their Fig. 2) suggests that the two samples investigated in this study are much better reset notwithstanding the much smaller scale of the fluvial system. For the modern allu-vial sample (< 3 years old, sample GLL-061301), about 60% (1 sigma) of the small aliquots yields a De consistent
with zero, and the distributions of both samples show similarity to those measured for aeolian sands (see e.g. Olley et al., 1997; Vandenberghe et al., 2003; accepted; Vandenberghe, 2004). It is not understood why the reset-ting process appears to have been more efficient than in larger drainage systems. One plausible explanation is that a large proportion of the sediment grains has been repeat-edly reworked, hereby receiving a cumulative exposure to light which resulted in a complete resetting of the lumi-nescence clock.
As the purpose of this study was to examine the ex-tent of resetting rather than obtaining optical ages for the samples, no precise determination of the dose-rate was carried out. Nevertheless, it is interesting to have an esti-mate of the ages that corresponds to the observed doses. Assuming a dose rate of 2.84±0.05 mGy year-1 (based on
Vandenberghe, unpublished gamma-ray spectrometry data), the overall large aliquot value of 0.4±0.2 Gy for the 212-250 µm grains of sample GLL-061301 (see Chap-ter 5, Large aliquots) corresponds to an optical age of
154±65 years; rejecting the four aliquots with a De > 1
Gy leads to an age of 24±4 years. The age calculated from the lowest 60% of the small aliquot dose distribu-tion gives an age of 3±6 years for this sample. For sample GLL-061302, the overall unweighted average De of the
small 212-250 µm aliquot distribution (0.11±0.02 Gy) leads to an age of 139±73 years. Rejecting the four obvi-ous outliers (De > 2 Gy) gives an age of 38±8 years, and
the unweighted average and median of the lowest 60% of the aliquots results in ages of 5±4 years and ~11 years, respectively. Apart from the age of about 140 years, all small-aliquot age estimates for sample GLL-061302 fall well within the expectations (see Chapter 2). As the low-est 60% of small aliquots of the representative modern analogue yields a dose (and hence age) consistent with zero, it is likely that the same way of analysing the data gives the best estimates of burial dose and age for sample GLL-061302 as well. However, it remains to be estab-lished whether this procedure is generally applicable to alluvial sediments deposited in the Ardenne region.
It is concluded that optical dating of coarse quartz grains holds potential for establishing the chronology of alluvial deposits in the Belgian Ardenne. The findings for the two samples investigated in the present study indicate that conventional large aliquot SAR analyses would al-low obtaining accurate chronologies from about 1000 years onwards. For younger samples, luminescence analysis using small aliquots is the best approach. It is acknowledged that further research is necessary both to improve our understanding of resetting of the lumines-cence clock in Ardennes’ alluvial sediments and to im-prove the accuracy of dose distribution analysis. To this purpose, small-aliquot and single-grain investigations on known-age samples will be carried out in the near future. ACKNOWLEDGEMENTS
Thanks are due to Gilles Velghe and Nicole Selen for their valuable technical assistance. We greatly
appreci-0 1 2 0 5 10 15 20 25
Recovered dose (Gy)
0.0 0.2 0.4 0.6 U n ce rtai n ty (G y) GLL-061301 212-250µm Q n=72 Numb er of a liquo
ts Fig. 9. Results from dose
recov-ery experiments using small ali-quots of 212-250 µm quartz grains extracted from sample GLL-061301. The given dose (0.47 Gy) is indicated in the histogram by the dashed line. 0 5 10 15 0 10 20 30 Numbe r of aliq uot s
Equivalent dose (Gy)
0.0 0.5 1.0 0 10 20 30 0 2 4 GLL-061302 212-250µm Q n=85 Unc e rt aint y (Gy ) 0.0 0.5 1.0 Fig. 10. De results obtained using small aliquots of 212-250 µm quartz grains extracted from sample GLL-061302. The inset shows an enlarge-ment of the same data up to 1.0 Gy.
ated Eric Hallot’s assistance in the field. Grateful ac-knowledgement is made to the Fund for Scientific Re-search – Flanders (DV), the Special Fund of the Ghent University (CD) and the National Foundation of Scien-tific Research (GH) for financial support. Anni Madsen and Andrew Murray are thanked for providing us with an unpublished manuscript of their review paper. We also thank Jan-Pieter Buylaert and Andrew Murray for stimu-lating discussions.
This paper is dedicated to Prof. Dr. Frans De Corte, as a souvenir to his retirement and in recognition of almost ten years of close, fruitful and amicable collaboration. REFERENCES
Alexanderson H, 2007. Residual OSL signals from modern Greenlandic river sediments. Geochronometria 26: 1-9, DOI 10.2478/v10003-007-0001-6.
Auclair M, Lamothe M and Huot S, 2003. Measurement of anomalous fading for feldspar IRSL using SAR. Radiation Measurements 37(4-5): 487-492, DOI 10.1016/S1350-4487(03)00018-0. Bøtter Jensen L, Andersen CE, Duller GAT and Murray AS, 2003.
Developments in radiation, stimulation and observation facilities in luminescence measurements. Radiation Measurements 37(4-5): 535-541, DOI 10.1016/S1350-4487(03)00020-9.
Frechen M, Schweitzer U and Zander A, 1996. Improvements in sample preparation for the fine grain technique. Ancient TL 14(2): 15-17. Fuchs M, Straub J and Zöller L, 2005. Residual luminescence signals of
recent river flood sediments: a comparison between quartz and feldspar of fine- and coarse-grain sediments. Ancient TL 23: 25-30 Houbrechts G, 2005. Utilisation des macroscories et des microscories
en dynamique fluviale: application aux rivières du massif arden-nais (Belgique) (Using macroscopic and microscopic slags in
flu-vial dynamics: application to Ardenne’s rivers (Belgium)). PhD thesis, University of Liège: 328 pp (in French).
Houbrechts G and Petit F, 2006, Utilisation des microscories métallur-giques comme traceur de la sédimentation dans les plaines alluvia-les ardennaises (Use of metallurgic microscopic slags as tracer for sedimentation in the alluvial plains of the Ardenne). L’érosion
entre société, climat et paléoenvironnement, Collection Nature et
Société, Presses universitaires Blaise Pascal 3: 93-98 (in French). Jain M, Murray AS and Bøtter-Jensen L, 2004. Optically stimulated
luminescence dating: how significant is incomplete light exposure in fluvial environments? Quaternaire 15: 143-157.
Juvigné E, 1979. L’encaissement des rivières ardennaises depuis le
début de la dernière glaciation (Downcutting of Ardenne’s rivers since the beginning of the last glaciation). Zeitschrift für
Geomorphologie 23: 291-300 (in French).
Lang A, Lindauer S, Kuhn R and Wagner GA, 1996. Procedures used for optically and infrared stimulated luminescence dating of sedi-ments in Heidelberg. Ancient TL 14(3): 7-11.
Lepper K, Agersnap Larsen N, McKeever SWS, 2000. Equivalent dose distribution analysis of Holocene eolian and fluvial quartz sands from Central Oklahoma. Radiation Measurements 32(5-6): 603-608, DOI 10.1016/S1350-4487(00)00093-7.
Mauz B, Bode T, Mainz E, Blanchard H, Hilger W, Dikau R and Zöller L, 2002. The luminescence dating laboratory at the University of Bonn: equipment and procedures. Ancient TL 20(2): 53-61. Murray AS and Olley JM, 2002. Precision and accuracy in the optically
stimulated luminescence dating of sedimentary quartz: a status re-view. Geochronometria 21: 1-16.
Murray AS and Wintle AG, 2000. Luminescence dating of quartz using an improved single-aliquot regenerative-dose protocol. Radiation
Measurements 32(1): 57-73, DOI
10.1016/S1350-4487(99)00253-X.
Murray AS and Wintle AG, 2003. The single aliquot regenerative dose protocol: potential for improvements in reliability. Radiation
Measurements 37(4-5): 377-381, DOI
10.1016/S1350-4487(03)00053-2.
Olley JM, Caitcheon G and Murray AS, 1998. The distribution of apparent dose as determined by optically stimulated luminescence signals in small aliquots of fluvial quartz: implications for dating young sediments. Quaternary Science Reviews 17(11): 1033-1040, DOI 10.1016/S0277-3791(97)00090-5.
Petit F, Gob F, Houbrechts G and Assani AA, 2005. Critical specific stream powers in gravel-bed rivers. Geomorphology 69(1-4): 92-101, DOI 10.1016/j.geomorph.2004.12.004.
Truelsen JL and Wallinga J, 2003. Zeroing of the OSL signal as a function of grain size: investigating bleaching and thermal transfer for a young fluvial sample. Geochronometria 22: 1-8.
Vandenberghe D, 2004. Investigation of the optically stimulated
lumi-nescence dating method for application to young geological sedi-ments. PhD thesis, Ghent University: 358pp.
Vandenberghe D, Hossain SM, De Corte F and Van den haute P, 2003. Investigations on the origin of the equivalent dose distribution in a Dutch coversand. Radiation Measurements 37(4-5): 433-439, DOI 10.1016/S1350-4487(03)00051-9.
Vandenberghe D, Vanneste K, Verbeeck K, Paulissen E, Buylaert JP, De Corte F. and Van den haute P, accepted. Late Weichselian and Holocene earthquake events along the Geleen fault in NE Bel-gium: OSL age constraints. Quaternary International.
Wallinga J, 2002. Optically stimulated luminescence dating of fluvial deposits: a review. Boreas 31(4): 303-322, DOI 10.1080/030094802320942536.