https://publications-cnrc.canada.ca/fra/droits
L’accès à ce site Web et l’utilisation de son contenu sont assujettis aux conditions présentées dans le site LISEZ CES CONDITIONS ATTENTIVEMENT AVANT D’UTILISER CE SITE WEB.
READ THESE TERMS AND CONDITIONS CAREFULLY BEFORE USING THIS WEBSITE. https://nrc-publications.canada.ca/eng/copyright
NRC Publications Archive Record / Notice des Archives des publications du CNRC :
https://nrc-publications.canada.ca/eng/view/object/?id=48a42a3e-a7c4-4df2-8f5a-9fd2b2e51687 https://publications-cnrc.canada.ca/fra/voir/objet/?id=48a42a3e-a7c4-4df2-8f5a-9fd2b2e51687
NRC Publications Archive
Archives des publications du CNRC
Access and use of this website and the material on it are subject to the Terms and Conditions set forth at
Road and rail noise: effects on housing
R o a d
a n d R a il N o is e :
E ffe c ts
o n H o u s in g
P r ic e : $ 6 .0 0 A u s s i d is p o n ib le e n fr a n p a is s o u s le litr e d eLe bruit du trafic routier et
ferroviaire: ses effets sur I'habitation
P r e p a r e d b y th e T e c h n ic a l R e s e a r c h D iv is io n o f C M H C in c o o p e r a tio n w ith th e D iv is io n o f B u ild in g R e s e a r c h o f N a tio n a l R e s e a r c h C o u n c il o f C a n a d a
First published 1977 Revised 1981
C O N T E N T S
Introduction... 1
Part 1 - Noise... 3
Part 2 - General Principles of Noise Control... 11
Part 3 - Road Traffic Noise... 15
Part 4 - Rail Traffic Noise... 34
Part 5 - Combining Noise Levels... 51
Part 6 - Adequate Sound Insulation Levels... 54
Part 7 - Appendices... 61
Glossary of Technical Terms... 113
Selected Bibliography... 115
NOTE: A detailed Table of Contents is attached to each of the above Parts.
Organization of Document
Each Part is organized to cover an entire subject with a minimum of cross-referencing to other Parts or publications. To achieve this, some overlapping and repetition has been necessary.
Depending on local circumstances, one or more Parts will have to be studied in order to determine the recommended solutions.
Acknowledgments
This revision was prepared by the Technical Research Division of CMHC in
cooperation with J.D. Quirt and R.E. Halliwell, Division of Building Research, National Research Council of Canada.
All phases of the project were supervised by a CMHC management committee : Arthur Walton, Project Manager.
I N T R O D U C I I O N
1. Public Concern
The inconveniences caused by urban traffic noise are fast being recognized by growing numbers of the general public. Social surveys from various parts of the world indicate that the noise from sur face traffic gives rise to more neigh bourhood dissatisfaction than aircraft noise does. One reason for this is that surface traffic noise is not restricted to specific areas, as aircraft noise is, but pervades most built-up areas in towns and cities.
2. Canadian Action
All three levels of government have re sponsibilities in noise abatement. The federal government is responsible for the abatement of aircraft and industrial noise, and sets noise standards for all manufactured goods.
Provinces deal with highway noise abate ment and share responsibility for in dustrial noise abatement with the federal government. Various highway traffic acts concern the noise produced by horns, faulty mufflers and squealing brakes. In addition, provincial governments authorize municipalities to create anti noise by-laws but such legislation is extremely varied among communities. Nuisance by-laws which prohibit "loud, unusual or disturbing sounds in a neigh bourhood" are difficult to enforce be cause of their subjective nature. Where the by-laws establish quantitative decibel limits for specific offensive noises, it is difficult to obtain noise measurements for traffic, which are defensible in court. Existing legislation is concerned with noise made by individuals and not the total noise produced by a stream of traffic.
to support methods which seek to protect residential areas from the effects of such noise; to encourage the cooperation of all levels of government to develop ways of alleviating the problems associ
ated with such noise; to discourage the construction of new residential develop ment on sites which are exposed to high levels of noise, and to introduce sound insulation in residential development on sites subject to lower levels of noise. The Corporation has published this docu ment to deal specifically with new resi dential development which may be adversely affected by noise from roads and railways. It suggests methods for determining the noise level at a building site and, where it is too high, for reducing the noise to acceptable limits within the various parts of the building where it occurs. It is hoped that developers and all levels of government will take into consideration the criteria established in this document when preparing comprehensive land-use plans.
4. CMHC's Involvement
The Corporation's involvement is related to the security of its financing and to the quality of housing conditions en couraged by its financial support. 4.1 Market Housing
Builders should be aware that this document is advisory in nature. There are no mandatory requirements to obtain NHA insurance.
4.2 Social Housing
For public, non-profit and coopera tive housing, where CMHC is providing either direct financing or subsidies, the Corporation has decided to use a number of the recommendations set out in this docu ment as mandatory standards. For these
4.2.1
• The Corporation will apply the follow ing policy in relation to the cate gories detailed in Part 1, Section D. 4.2.1.1
• In the upper zone, where the noise level exceeds 75 dB, social housing projects shall be denied financing under the National Housing Act 4.2.1.2
• In the intermediate zone, where the noise level is between 55 dB and 75 dB, the social housing projects shall be denied financing under the National Housing Act, unless adequate sound insulation is provided
4.2.1.3
• In the lower zone, where the noise level is below 55 dB, housing con struction which meets Residential Standards 1980 will provide adequate sound insulation, and financing under the National Housing Act will be available for social housing projects 4.2.2 Adequate Sound Insulation
(See Part 6, Section A)
• Where noise levels are between 55 dB and 75 dB, the Corporation recommends or requires adequate sound insulation in new dwellings and the provision of suitable outdoor amenity space with a noise level of 55 dB or less
• "Adequate sound insulation" is defined as the sound insulation provided in a dwelling unit in accordance with the Corporation policy established by the recommendations in this document
• To achieve the required noise re
duction, each of the components of the
• All the appropriate components listed in Tables 6.2, 6.3 and 6.4 are the minimum acceptable to the Corporation • The Corporation requires alternative
means of ventilation (see also Appendix C)
• The Corporation recognizes that there are other and more detailed methods of calculating sound insulation. Substantiated proposals, based upon other methods, may be acceptable to the Corporation in lieu of proposals adhering strictly to the method of calculation outlined in this publi cation.
5. National Research Council
The Division of Building Research of the National Research Council has contributed substantially to this publication, which
is based upon the best information avail able . Although it is hoped that the rec ommendations will be appropriate for several years, they will be subject to continuous review and should be updated on the advice of the National Research Council.
P A R T 1 — N O I S E
C o n te n ts S e c tio n A — N o is e
Section A - Noise Introduction Noise Levels
Section B - Traffic Noise Introduction
Evaluation of Traffic Noise Section C - Recommended Levels
of Traffic Noise
Section D - Classification of Areas Adjacent to Roads and Railways
Introduction
Identification of Areas
Need for Detailed Calculations Figures
1. Common noise levels and typical reactions
2. Need for detailed calculations Tables
1. Maximum acceptable levels of road and rail traffic noise in dwellings and in outdoor recreation areas
Introduction
Before attempting to discuss traffic noise, which is primarily a social and community problem, it might be useful to consider briefly what noise is and what its effects are.
Sound is the sensation caused by fluctu ations in air pressure detected by the human ear. When that sound is unwanted by the recipient, it is described as noise.
Noise can affect people in a variety of ways, the most important of which may be damage to hearing, interference with com munication or concentration, disturbance of sleep and general annoyance. Any of these factors could lessen one’s ef ficiency and general well-being.
Reaction to the same sound intensity and source varies considerably from person to person. What may be annoying to one person might well be acceptable to another.
One's environment has a distinct bearing on what may be considered excessive noise. Factory workers may require protection against hearing loss. Noise levels in offices must allow for adequate communi cation or concentration, and, in the home, people are entitled to enjoy their privacy free from interfering noises.
To allow for the great variations in the reactions of individuals to noise, recom mendations to deal with the problems it causes have to be based on the average reaction.
It is not easy to define noise in a wholly satisfactory way but for the purpose of this document an acceptable definition is "sound which is undesired by the re
cipient". This simple description empha sizes the subjective nature of noise and
Noise Levels
While everyone is conscious of noise, very few people have any idea of noise levels. They tend to describe them in terms of annoyance, ranging from acceptable to very annoying. Section B discusses the evalu ation of traffic noises in general terms and presents some examples of the noise levels to which people are normally exposed.
S e c tio n B — T r a ffic N o is e
Introduction
Noise from road traffic fluctuates in a more or less regular fashion throughout the day. The more distant a person is from the traffic, the lower and steadier the noise level; the closer he is, the higher the average level and the more obvious the noise peaks become. This is also true for rail traffic, which gener ates higher levels of a more intermittent nature. In general, road traffic noise is anonymous, coming as it does from a stream of vehicles. On the other hand, rail noise is often attributable to a specific train.
The effects of traffic noise are greater in dwelling units than in some offices and factories, where internal activities frequently generate more noise than enters from the outside. Hospitals and schools can be seriously affected by traffic noise.
Whatever improvements occur to reduce vehicle noise will take a long time and may be offset by the ever-increasing number of vehicles on the roads.
Although traffic engineering recognizes noise problems, it has its own priorities and objectives and can deal with noise only in limited ways, such as the con struction of berms on major highways. The architect and the planner, however, have the most effective means of im proving the environment and particularly the residential environment: careful orientation of housing may easily reduce the apparent noise level.
It is important, therefore, that noise control in new buildings be considered at the planning stages.
Evaluation of Traffic Noise
The noise problem can be considered under three broad headings: source, propagation
moves. The propagation of the noise is influenced by the level of the road or track above or below the surrounding grade, the distance and shielding between the road or track and the receiver, and the type and configuration of the ground between them.
The basic physical measure of noise used in this report is the A-weighted sound level, sometimes labelled "dBA". This is an overall measurement of all compo nents of the sound, over the full range of frequencies - with special weighting of the middle frequencies - to stimulate the way the human ear responds to sounds of different frequencies. The A-weighted level has been found to correlate well with people's judgement of the loudness or annoyance of many kinds of noise, in cluding road and rail traffic. A rough rule-of-thumb is that an increase of 10 dB in sound level doubles the apparent loudness.
It should be noted that aircraft noise is usually described in somewhat different
terms. However, the procedures presented for specifying sound insulation of houses near airports* are essentially the same as those described here.
There are two basic types of identifiable intruding noise which increase the outdoor noise level above the background level:
steady or semi-steady, constant noises, and intermittent, single, unrelated noises. The background noise level is that which remains after all identifiable traffic noises have been eliminated.
* New Housing and Airport Noise,
F ig . 1 — C o m m o n n o is e le v e ls a n d ty p ic a l r e a c tio n s S o u n d S o u r c e N o is e L e v e l A p p a r e n t L o u d n e s s T y p ic a l R e a c tio n C M H C R e q u ir e m e n ts M ilita r y je t J e t ta k e o ff a t 5 0 m J e t ta k e o ff a t 5 0 0 m F r e ig h t tr a in a t 1 5 m H e a v y tr u c k a t 1 5 m B u s y c ity s tr e e t H ig h w a y tr a ffic a t 1 5 m L ig h t c a r tr a ffic a t 1 5 m N o is y o ffic e P u b lic lib r a r y d B 1 3 5 — 1 3 0 1 2 0 1 1 0 100 8 0 S ix ty -fo u r tim e s a s lo u d T h ir ty - tw o tim e s a s lo u d S ix te e n tim e s a s lo u d E ig h t tim e s a s lo u d F o u r tim e s a s lo u d T w ic e a s lo u d B a s e r e fe r e n c e H a lf a s lo u d Q u a r te r a s lo u d E ig h th a s lo u d — P a in fu lly lo u d L im it a m p lifie d s p e e c h M a x im u m v o c a l e ffo r t T e le p h o n e u s e d iffic u lt In tr u s iv e S p e e c h in te r fe r e n c e Q u ie t C a te g o r ie s U n a c c e p ta b le V e r y a n n o y in g - H e a rin g d a m a g e ( 8 h o u r s ) A n n o y in g U n a c c e p ta b le w ith o u t a d e q u a te s o u n d in s u la tio n N o rm a lly a c c e p ta b le ' r 7 5 -5 -5 — - { - 4 0 - 1 M a x im u m A c c e p ta b le L e v e ls O u td o o r R e c r e a tio n K itc h e n s B a th r o o m s L iv in g / D in in g B e d r o o m s
S e c tio n C — R e c o m m e n d e d L e v e ls o f T r a ffic N o is e
The acceptance of noise depends on both the characteristics of that noise and the activities of the listeners. The activi ties most affected by noise fall into two categories, corresponding to two differ ent criteria. For activities similar to speech communication (including listening to radio and television), the first re quirement is that the noise level does not interfere significantly with comfort able speech communication or with
listening to soft music. The other important category is sleeping: noise, especially at night, should not interfere with normal sleep patterns.
To deal with the fluctuating noise level from road or rail traffic, it is conve nient to describe it in terms of the
equivalent level (Leq). This is the
level of a steady sound having the same energy, at a given time, as the fluctu ating sound. For the purposes of this document, the A-weighted 24-hour
equivalent sound level is used as the basic noise descriptor. This noise measure has been extensively tested in numerous social surveys. Of the commonly used noise descriptors, it is among the easiest to measure or to predict accu rately, and no other descriptor has been shown to provide a significantly better prediction of the community response to noise.
Hereafter "noise level" expressed in decibels (dB) should be taken to mean the A-weighted 24-hour equivalent sound level.
The maximum equivalent level that will not impair sustained conversational speech is 40 dB. Noise above this level causes people to raise their voices and therefore is not acceptable for a quiet indoor en vironment. In order to hear quieter passages of music, a level of about 35 dB
Sleep arousal and interference with going to sleep depend on the level of noise and on the fluctuations in level or character that occur. A useful criterion is that the maximum levels should not exceed the indoor background level by more than about 5 dB. Quiet interior levels range from 25 to 35 dB. Normally night-time traffic is less than day-time traffic and the 24-hour average level provides a fair measure of maximum night-time levels. The maximum level acceptable in bedrooms is
35 dB.
Outdoor noise levels should be considered as well as indoor because residential areas ought to include some space for out door recreation, such as patios, balconies and play areas. Experience indicates that somewhat higher noise levels are generally more acceptable outside than inside. An appropriate outdoor noise level is 55 dB, which would correspond typically to an indoor level of 40 dB. These levels would permit conversation at close range or in a slightly raised voice most of the time. Such background noise may serve the purpose of masking more specific sounds, such as conversation on a neighbour's patio.
To meet these various criteria of ac ceptable noise levels, the levels given in Table 1 are recommended:
Table 1
Maximum acceptable levels of road and rail traffic noise in dwellings and in outdoor recreation areas.
Room Noise Level
Bedrooms... 35 dB Living, dining,
recreation rooms... 40 dB Kitchens, bathrooms, hallways,
Note:
In downtown apartment projects where3 because of site restrictions3 adequate noise reduction measures are not always possible3 it is recognized that noise
levels above 55 dB do not make open space completely ineligible for inclusion as amenity space. To provide a flexible approach3 a sliding scale may be used in which for each 2 dB over the acceptable
limit, 10% of the area of a balcony or other open space is ineligible, e.g.3 a balcony of 50 m^ with a level of 61 dB would have 21 m^ eligible amenity area; at 65 dB the eligible area would be
15 .
In an ordinary dwelling complying with Residential Standards, the indoor noise
level should be at least 20 dB below the outdoor level when windows are closed. If the outdoor noise level is not more than 55 dB, then all the proposed require ments could normally be met if the con struction complies with Residential Standards, although it might still be prudent to locate bedrooms on the quieter side of the building.
In noisier locations, some shelter is needed for outdoor recreational space so that it meets the 55 dB requirements. The shelter might take the form of a barrier wall, solid fence, or berm between the road and the recreational space. In some layouts, the building itself, row housing for example, may form an adequate barrier to protect out door space on the sheltered side.
Generally, however, a reduction of 20 dB is the maximum that can be expected from a barrier. It follows that outdoor space which is quiet enough cannot be achieved at sites where the noise level is greater
S e c tio n D — C la s s ific a tio n o f A r e a s
A d ja c e n t to R o a d s a n d R a ilw a y s
Introduction
Statistical analyses of sociological surveys indicate that residents judge their living conditions in four distinct ways: convenience; attractiveness;
intrusion of objectionable features, such as noise; and ease of movement into and out of the neighbourhood. People's reaction to noise may therefore be tempered by these other considerations. Hence, residential areas adjacent to
roads and railways cannot be classified strictly according to people's reactions, except in statistical terms.
Identification of Areas
In order to apply the available noise abatement information to the assessment of noise exposure at a site, the cate gories listed below are recommended. Normal construction in new residential buildings complying with Residential Standards should provide an acceptable indoor environment up to an outdoor noise level of 55 dB. Above this level there is an ever-increasing likelihood that normal construction will be unable to provide adequate sound insulation. An analysis of available information
indicates that residential development with adequate sound insulation could be allowed up to a noise level of 75 dB. Above this, the annoyance caused by road and rail traffic so seriously affects the environment that residential development should not be considered.
S’ Acceptable — n o is e e x p o s u r e b o th in d o o rs a n d o u td o o r s is u n o b tr u s iv e N o is e le v e l a t b u ild in g . f a c e 5 5 d B 7 5 d B Normally acceptable — n o is e e x p o s u re m a y c a u s e s o m e c o n c e r n b u t c o n s tru c tio n c o m p ly in g w ith ‘Residential Standards' s h o u ld p r o v id e a c c e p ta b le in d o o r c o n d itio n s
Normally unacceptable —
n o is e e x p o s u re is s ig n ific a n tly m o r e s e v e r e . In d o o r c o n d itio n s a r e u n a c c e p ta b le u n le s s a d e q u a te s o u n d in s u la tio n is
p r o v id e d . O u td o o r r e c r e a tio n a l s p a c e m a y h a v e to b e s h e lte r e d
In relation to these categories, CMHC considers the following applications appropriate:
a) the upper zone, where the noise
level exceeds 75 dB, is unsuitable for housing
b) the intermediate zone, between 55 dB
and 75 dB, is unsuitable for housing unless adequate sound insulation is provided
c) in the lower zone, where the noise
level is below 55 dB, housing con struction meeting Residential Standards will provide adequate sound insulation.
Cautionary Note: .
Caution should be exercised when building within 100 m of a railway line. At this distance there is a possibility of high vibration levels within the building due to both ground vibration and airborne noise. In such situation it is rec ommended that heavyweight construction be used and that a qualified person be consulted on other forms of vibration control which may be necessary.
Note: The noise from road traffic at a
site is directly related to any combi nation of the following conditions:
average vehicle speed, density of traffic flow, the proportion of heavy vehicles to cars, the number of lanes and the distance to the site.
Therefore, it is not practical to use street classifications to establish the suitability for residential development of land adjacent to roads.
Need for Detailed Calculations
Even taking account of the problems and difficulties previously mentioned, it is possible to build housing near roads and railways and achieve reasonable interior noise levels, provided that proper
measures are taken to ensure that the sound insulation is adequate.
For roads where the speed limit is 50 km/h or less and heavy vehicle traffic is negligible (i.e., restricted to normal residential delivery), it is possible to determine whether the site is acceptable without further reference to the detailed sections of this document. Figure 2 is used for this purpose.
F ig . 2 — N e e d fo r d e ta ile d c a lc u la tio n s A v e ra g e n u m b e r o f v e h ic le s p e r d a y s ° O § O § §
o
§
o
.
O
O
O
O
O
i
/
i
D e ta le d/
ie c e s s a r}/
7
/
>f
/
C aICUlctio n s/
n o n e c e s s a ry ) 1 0 2 0 3 0 4 0 5 0 6 0 m e tr eP A R T 2 — G E N E R A L P R IN C IP L E S O F N O I S E C O N T R O L C o n te n ts G e n e ra l P r in c ip le s General Principles Site Selection Orientation of Buildings Internal Layout
Primary Agents of Sound Transmission Insulation
Subsequent sections of this guide deal in detail with traffic noise problems,
acceptable levels of noise, the classi fication of areas, the prediction of noise levels, and so on.
Before discussing technical details, however, the logical way to ensure that a building has an acceptable noise en vironment is to examine carefully the acoustical design elements in the initial planning stages. The most important elements that should be considered are:
• site selection
• orientation of buildings on the site
• internal layout
• the primary agents of sound transmission.
Site Selection
• Use the natural landscape to the best advantage. Rolling or hilly terrain may provide acoustical benefits not available on a flat or hollow site.
* U n s h ie ld e d S ite
* S h ie ld e d S ite
• Study the surrounding existing and proposed development which may cause ad verse effects, especially where heavy volumes of traffic are involved. Zoning and future development plans for the area should be taken into account, since reflections of sound waves between oppo site buildings generally increase noise levels.
R e fle c tio n
M u ltip le R e fle c tio n
N o n - S e n s itiv e U s e s S h ie ld in g
S e n s itiv e U s e s
• Although no specific correction is allowed in this document for atmospheric effects, the upwind side of a traffic source is generally quieter, especially where large volumes of traffic are
involved and where the distances from the source to the receiver are long.
• Similarly, avoid sites at busy inter sections, especially where accelerating, decelerating and braking take place, and sites where more than one traffic route occurs, such as a railway running along side a road. These sites can be ex tremely noisy.
If this type of site cannot be avoided, use existing buildings as noise barriers or locate non-sensitive uses on the noise side.
O ffic e s
Orientation of Buildings
• Building should be located to take full advantage of any natural features or existing buildings which may provide acoustical shielding.
• Buildings should be located as far as possible from the noise source.
• Buildings should be arranged so that as many dwelling units as possible are shielded from the traffic noise.
P o o r B e tte r S h ie ld in g
• Where a number of long buildings are proposed, they should not be at right angles, nor should they be parallel to one another, in order to avoid the re flection of noise between buildings.
P o o r B e tte r R e fle c tio n o f N o is e
• Long buildings with apartments on only one face or with "through" apartments
(exposed on both sides of the building) are best built parallel to the traffic route. Noise-sensitive areas, such as bedrooms, should be located on the quiet
side of the building, thereby using the building itself as a noise barrier. Less noise-sensitive areas, such as storage rooms, bathrooms and kitchens, should be located on the side facing the traffic. • Precautions must be taken that poor site planning in access and parking areas does not negate the benefits achieved by locating the buildings carefully away from traffic noise.
Internal Layout
Practica], use can be made of the fact that most buildings, particularly multiple dwellings, have a "noisy" side and a "quiet" side, and their internal design can cater to these uses.
Noise-sensitive uses, such as bedrooms and dining rooms, should be located on the quiet side of the building, and non sensitive uses, such as bathrooms and storage areas, should be on the noisy side. In some forms of multiples, there fore, it may be possible to locate non sensitive uses such as elevators, laundry and equipment rooms, hallways and corri dors, along the wall facing the traffic route. In effect, the building can then be used as a noise barrier to improve the conditions at the rear.
Primary Agents of Sound Transmission
The outer shell or envelope of a building consists of the roof, walls, doors and windows; each of these components allows some sound to pass through. Roofs built to National Building Code standards, however, provide sufficient noise re duction that they can be ignored in this guide. Solid double doors provide the best protection against excessive noise; a single hollow core provides the least. The best noise control for windows is provided by the fixed variety and their effectiveness is increased as the air space between panes and the glass thick ness is increased. Wall construction depends mainly on its mass to control noise.
Insulation
Acoustical and thermal energy transfer through walls, doors and windows obey very different physical principles, so very good correlation between noise re duction and thermal transmission should not be expected. However, good acoustical performance usually implies good thermal performance.
P A R T 3 — R O A D T R A F F IC N O I S E
C o n te n ts S e c tio n A — R o a d T r a ffic N o is e
Section A - Road Traffic Noise Introduction
Main Sources of Noise
Section B - Prediction of Outdoor Noise from Road Traffic
Step 1 Traffic Counts Step 2 Base Noise Level
Step 3 Correction for Road Gradient Step 4 Correction for Interrupted
Traffic Flow
Step 5 Determination of Equivalent Source Height
Step 6 Correction for Distance Step 7 Correction for Barriers
. Attenuation for a Barrier of
Infinite Length
. Correction for Actual Barrier Length
. Numerical Example of Work Procedure
Tables
3.1.1 - 3.1.8 Equivalent noise levels at 30 m for various posted speed limits
3.2 Correction for gradient
3.3 Correction for interrupted
traffic flow
3.4 Equivalent source height
for road traffic
3.5 Correction for distance
and height
3.6 Effective barrier length
ratio (w) for asymmetric barriers
3.7 Barrier attenuation (in dB)
for effective values of the effective barrier length ratio (w)
Figures
3a Effective total height above ground 3b Basic barrier model (vertical section) 3c Necessary dimensions for calculation
of barrier attenuation
Introduction
Vehicular noise in cities is present in two main forms — the noise caused by heavy traffic and that caused by light vehicular movement. A heavy volume of traffic along main routes creates a high noise intensity background. Noise from heavy vehicles appears on a graph only as small peaks above the background noise. On other streets, particularly in residential areas, the lower traffic volume creates lower levels of background noise, above which the noise from all types of vehicles appears as higher peaks.
Current trends are for both these forms of noise to increase as the number of
vehicles increases, as new highways are built and as suburbs spread out along existing highways. So noise is a problem in suburban and urban areas alike.
Canadian practice generally has been to minimize the movement of heavy motor vehicles on residential streets by prohi biting through traffic in residential areas or by designating mandatory truck routes. One-way street systems have also been introduced in recent years to improve
the traffic flow. This often leads to increasing volumes of traffic and a deteriorating road.
Main Sources of Noise
There are two major sources of noise from moving motor vehicles: the engine-exhaust system and the tire-roadway interaction. However, a number of factors directly
affect the amount of traffic noise a person hears:
• Density — as the number of vehicles increases, so does the noise level
• Composition — the greater the percent age of heavy vehicles, the greater the noise
S e c tio n B — P r e d ic tio n o f O u t d o o r N o is e fr o m R o a d T r a ffic
• Stopping and moving off — both the character and the levels of noise are affected as vehicles slow down, stop and then accelerate
• Road Gradients — the noise from
vehicles, particularly the heavier ones, increases with the gradient
• Road Width — the width of the road can affect the speed and volume of traffic. The distance from the centreline of the road to a building or site and the ef fectiveness of any noise barriers between it and the building site are related to the width of the road easement
• Ground Surface — the noise level near the ground may be reduced by the nature of the surface over which the sound waves pass
• Road Surface — the noise generated by automobiles and trucks depends on the
type of road surface and its condition. The noise level predicted in Section B is appropriate for asphalt or concrete roads in "average" condition. Because the condition of the surface of any road may vary significantly from year to year, no specific corrections for various road surfaces are used.
This section outlines a procedure for taking account of the variables discussed in Part 3 - Section A.
The basic model assumes a straight and level road on the same grade as the sur rounding land and then provides a series of adjustments to take account of other situations.
Step 1 - Traffic Counts
To determine the noise generated by traffic on a particular road, the
following information about the average daily traffic is required:
1. Traffic speed in kilometres per hour, taken to be the posted speed. 2. Average daily traffic volume
(vehicles per 24-hour day).
3. Percentage of heavy vehicles (all vehicles with more than four wheels or a gross vehicle weight greater than 5000 kg).
Where traffic statistics are available from municipal or provincial authorities, the average daily traffic volume shall be taken to be the Annual Average Daily Traffic (AADT). In general, the highest value of AADT predicted for the next ten years should be used if it is available. Where traffic counts or predictions are not available from provincial or municipal authorities (in the case of smaller mu nicipalities, secondary roads, and so on), it may be necessary to estimate the
traffic flow from direct observation. In such cases the observed results should be adjusted to reflect the best available estimates of seasonal variations and anticipated traffic increases.
R e c e iv e r
Step 2 - Base Noise Level
Determine the base noise level at a re ceiving point 30 m from the centreline of the roadway. If the total width of a multi-lane road (edge of pavement to edge of pavement) is less than the distance from the midpoint to the receiver, then it is treated as one road. Wider road ways should be treated as two or more
roads and their individual noise levels calculated and combined, as detailed in Part 5. Base noise levels for traffic speeds from 40 km/h to 110 km/h are given in Tables 3.1.1 to 3.1.8 for various traffic volumes and percentages of heavy vehicles. F ig . 3 a — E ffe c tiv e to ta l h e ig h t a b o v e g r o u n d S o u r c e N o b a r r ie r — e ffe c tiv e to ta l h e ig h t = s + r * s E ffe c tiv e to ta l h e ig h t = s + p + r
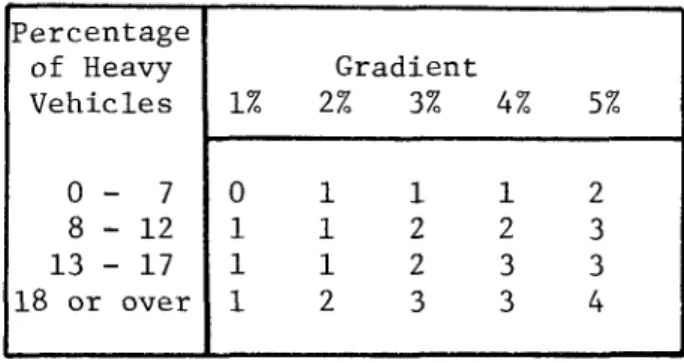
Step 3 - Correction for Road Gradient
For road gradients of one percent or more, add the correction indicated in Table 3.2. Step 4 - Correction for Interrupted
Traffic Flow
When the free flow of traffic is inter rupted by traffic lights, stop signs or corners, necessitating a halt or sub
stantial change in speed, the noise levels increase and a correction must be made. For locations within 150 m of a traffic light or other interruptions in traffic flow, add a correction as indicated in Table 3.3.
r
E ffe c tiv e to ta l h e ig h t = s + t + r
W ith b a r r ie r — e ffe c tiv e to ta l h e ig h t = s + t + p + r
R e c e iv e r # ^ "
Step 5 - Determination of Equivalent Source Height
To determine both ground attenuation and barrier attenuation (Steps 6 and 7), the source height must be established. An "equivalent source height" that takes into account the contribution of wheel noise and heavy vehicle exhaust noise is given in Table 3.4 for a range of traffic speeds and percentages of heavy vehicles. Step 6 - Correction for Distance
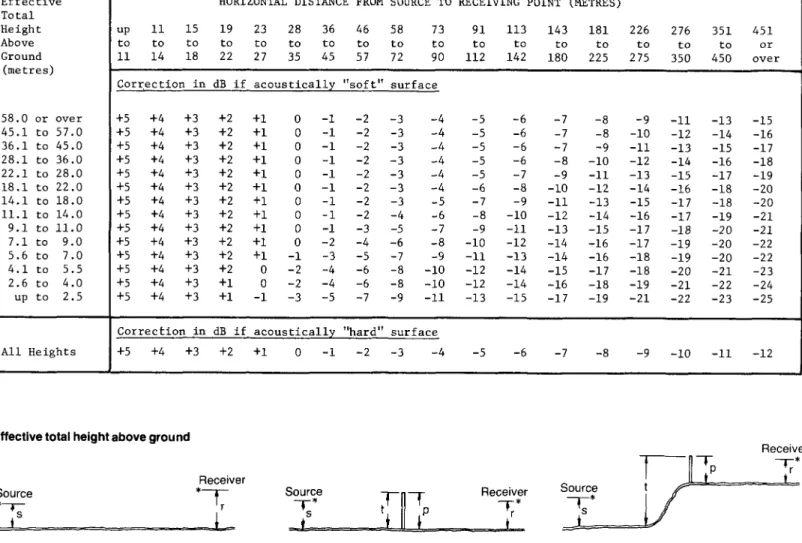
The procedure up to Step 4 gives the noise levels for a receiving point 30 m from the centreline of the roadway, when the ground surface is hard. If the re ceiver position or the ground surface are different from this, the noise level may be higher or lower. In general, the noise level diminishes as the distance between source and receiver is increased. An acoustically "hard" surface is one
that reflects sound well. This would include such surfaces as concrete, as phalt, clay or compacted gravel. If more than half the ground surface between the source and receiver is "hard", the
distance correction should be calculated, using the section of Table 3.5 for "hard" ground.
Because the distance from the source to a receiving point above or below source height is greater than the horizontal distance, lower outdoor noise levels would be expected at the upper storeys of a multi-floor building than at road level. However, this reduction in outdoor noise
levels is offset by the dependence of the building's noise insulation on the angle from which sound arrives. For this reason, the distance correction is based only on the horizontal distance if the ground surface is "hard".
ground. The height of the source and receiver above the ground and the height of any intervening barrier affect the noise reduction associated with a soft surface. An "effective total height" must be calculated from the heights mentioned, using the expression given in the ap
propriate diagram in Fig. 3a. Then, using this effective total height and the hori zontal distance, the distance correction can be calculated from the section of Table 3.5 for "soft" ground surface. Step 7 - Correction for Barriers
The noise from traffic may be reduced by the presence of any obstruction that interrupts the line of sight between the noise source and the receiving point.
(However, trees and shrubs have been found to provide very little shielding.) Note that the noise source may be considerably above the road surface, as is indicated in Table 3.4. The barrier might be a road embankment or cutting, an earth berm, one or more buildings, or a specially con structed wall. If a wall is constructed for this purpose, it must have an im pervious surface with a negligible number of holes or cracks (less than 0.2 percent of the total surface area) . The barrier material should weigh at least 5 kg/m^
(10 kg/m^ if barrier attenuation is greater than 10 dB).
"Barrier attenuation" is the reduction in the noise level at a receiving point rela tive to the noise level that would exist there if the ground surface were "hard" and if nothing interrupted the path from
the noise source to the receiver. Note that the correction for distance when the ground surface is "soft" also depends on
the presence or absence of a barrier. Typically the addition of a barrier pro vides some barrier attenuation, but re
Both the height and the length of a barrier are important to its effective ness in reducing the noise level. There fore, both the vertical cross-section and the plan view must be considered. The procedure here first evaluates the at
tenuation for a barrier of "infinite length" (i.e., a barrier so long that a negligible amount of noise comes from
the ends) considering only the vertical cross-section.
This result is then modified to allow for the barrier's length and its location relative to the road (as shown in a plan view).
Attenuation for a Barrier of Infinite Length
The fundamental barrier geometry is illustrated by Fig. 3b, which is a verti cal section along the line from the noise source to the receiving point. The
distance "s" is the equivalent height of the noise source above the road surface, which is determined in Step 5.
R e c e iv e r
B a r rie r in te r r u p ts lin e o f s ig h t
R e c e iv e r
B a r r ie r n e a r ly in te r r u p ts lin e o f s ig h t
F ig . 3 b — B a s ic b a r rie r m o d e l (v e rtic a l s e c tio n )
For a barrier of infinite length, the attenuation depends on the difference between the straight line distance (c) from source to receiver in Fig. 3b and the combined distance (a + b) from the source to the top of the barrier and then to the receiver. This is called the "path length difference". • -S o u r X c e y R e c e iv e r z 1 ^ . f - . . . _ Q ____ I- -- -- -- -- -- -- -- -- -- -- -- - T 1 R e c e iv e r b e lo w b a r rie r R e c e iv e r X • 4 - --S o u r c e z L _ _ _ _ _ _ f_ _ _ _ _ _ _ . * _ _ _ _ _ _ _ a _ _ _ _ .. _ R e c e iv e r a b o v e b a r r ie r a n d s o u r c e F ig . 3 c — N e c e s s a r y d im e n s io n s fo r c a lc u la tio n o f b a r rie r a tte n u a tio n
Calculating the path length difference is straightforward. The necessary hori zontal and vertical distances are indi cated in Fig. 3c for the two important cases where the barrier interrupts the line of sight and where the barrier nearly interrupts the line of sight. The dis tances "a", "b" and "c" may be calculated using the following expressions:
a = \/x2 + f2
In calculating the value of c, the hori zontal distance used should be the exact sum of the two horizontal distances, and the vertical distance should be the exact sum or difference of x and y, as is indi cated in Figure 3c. All the square roots should be calculated to an accuracy of 0.01 m. Note that this does not mean that this accuracy is required in the original distances, such as f and g.
(Note: inexpensive electronic calcu lators which can compute squares and square roots are readily available.)
The path length difference = a + b - c. If the barrier does not interrupt the line of sight from the source to the receiver and the path length difference is 0.06 m or greater, the barrier at tenuation is zero, and no further calcu lations are required. In other cases, the path length difference may be used with Table 3.7 to obtain the attenuation
for a barrier of infinite length.
The calculations using the path length difference are appropriate for continuous barriers such as berms, specially con structed fences or row housing. However, some attenuation may also be provided by rows of detached buildings that are suf ficiently closely spaced (where the average space between buildings is less
than 50 percent of the average building length). For the first row of building obstruction, the line of sight between the source and the receiving point, allow a barrier attenuation of 4 dB. Further attenuation of 2 dB each may be allowed for the second, third and fourth rows respectively. If both a continuous
barrier and one or more rows of buildings are present, an attenuation of 2 dB per row may be allowed for each of the first three rows of buildings interrupting the line of sight from the top of the barrier
C e n tre lin e o f r o a d u V I 1 1 , 1 u J r 1’ T * 1 B a r r ie r——n g , 1 ' 1 1 1 1 1 1 1 I_4R e c e iv e r F ig . 3 d — P la n v ie w o f r o a d s id e b a r r ie r C e n tre lin e o f r o a d E q u iv a l& p t b a rr ie r x B a r r ie r R e c e iv e ^ . F ig . 3 e — P la n v ie w o f a n e q u iv a le n t p a r a lle l b a rr ie r R e c e iv e r : C e n tre lin e o f r o a d - -- -- - ^
Correction for Actual Barrier Length
A plan view of a barrier is shown in Fig. 3d. A line from the receiving point
to the centreline of the roadway (the shortest distance to the roadway) divides the barrier into two segments, one of length v and the other of length u. If the barrier is not parallel to the roadway, consider an equivalent barrier that is parallel to the road, as shown in Fig. 3e. The equivalent barrier is repre sented by the broken line parallel to the roadway and screening the same portion of the traffic.
The values of the ratios u/g and v/g are used with Table 3.6 to determine the effective barrier length ratio (w). If w is less than 10, a significant amount of noise may reach the receiving point via paths around the ends of the barrier. The value of w and the path length dif ference (or the attenuation for a barrier of infinite length), as determined in the section above, may be used in Table 3.7 to obtain the attenuation for the actual barrier.
Numerical Example of Work Procedure
In the example in Fig. 3f, the source is 3 m below and 7 m horizontally from the top of the barrier. The direct distance from source to barrier top is
a = \jO x 3) + (7 x 7) = 7.62 m.
The vertical and horizontal distance from the top of the barrier to the receiver are 2 m and 20 m respectively; the direct distance is
b = \J{2 x 2) + (20 x 20) = 20.10 m.
The receiving point is 1 m above the source and 27 m away horizontally; the direct source receiver distance is therefore
The barrier does interrupt the line of sight from the source to receiver and the path length difference is
7.62 + 20.10 - 27.02 = 0.70 m. For a barrier of infinite length, the barrier attenuation, as given in Table 3.7, would be 13 dB.
From Fig. 3f it is seen that u = 40 m, v = 120 m and g = 20 m. Therefore:
u/g = 40/20 = 2, v/g = 120/20 = 6
These values can be used with Table 3.6 to obtain the effective barrier length ratio (w), which is found to be 3.
The path length difference (0.70 m) and the effective barrier length ratio (w = 3) can now be used in Table 3.7 to give the barrier attenuation for the actual
barrier, which is 10 dB.
Further numerical examples illustrating other common barrier configurations are given in Appendix B.
Table 3.1.1 - Equivalent noise level at 30 m from centreline if posted speed limit is 40 km/h
Percentage of Heavy Vehicles Traffic Volume (vehicles per 24 h) 0.0 To 1.9 2.0 To 3.7 3.8 To 6.0 6.1 To 8.9 9.0 To 12 13 To 17 18 To 22 23 To 30 31 To 39 40 To 50 51 To 65 66 To 83 84 To 100 1000 45 46 47 48 49 50 51 52 53 54 55 56 57 1250 46 47 48 49 50 51 52 53 54 55 56 57 58 1600 47 48 49 50 51 52 53 54 55 56 57 58 59 2000 48 49 50 51 52 53 54 55 56 57 58 59 60 2500 49 50 51 52 53 54 55 56 57 58 59 60 61 3150 50 51 52 53 54 55 56 57 58 59 60 61 62 4000 51 52 53 54 55 56 57 58 59 60 61 62 63 5000 52 53 54 55 56 57 58 59 60 61 62 63 64 6300 53 54 55 56 57 58 59 60 61 62 63 64 65 8000 54 55 56 57 58 59 60 61 62 63 64 65 66 10000 55 56 57 58 59 60 61 62 63 64 65 66 67 12500 56 57 58 59 60 61 62 63 64 65 66 67 68 16000 57 58 59 60 61 62 63 64 65 66 67 68 69 20000 58 59 60 61 62 63 64 65 66 67 68 69 70 25000 59 60 61 62 63 64 65 66 67 68 69 70 71 31500 60 61 62 63 64 65 66 67 68 69 70 71 72 40000 61 62 63 64 65 66 67 68 69 70 71 72 73 50000 62 63 64 65 66 67 68 69 70 71 72 73 74 63000 63 64 65 66 67 68 69 70 71 72 73 74 75 80000 64 65 66 67 68 69 70 71 72 73 74 75 76 100000 65 66 67 68 69 70 71 72 73 74 75 76 77 125000 66 67 68 69 70 71 72 73 74 75 76 77 78 160000 67 68 69 70 71 72 73 74 75 76 77 78 79 200000 68 69 70 71 72 73 74 75 76 77 78 79 80 250000 69 70 71 72 73 74 75 76 77 78 79 80 81 NOTE :
1) Where actual traffic volume is not presented in the table, use the nearest listed value.
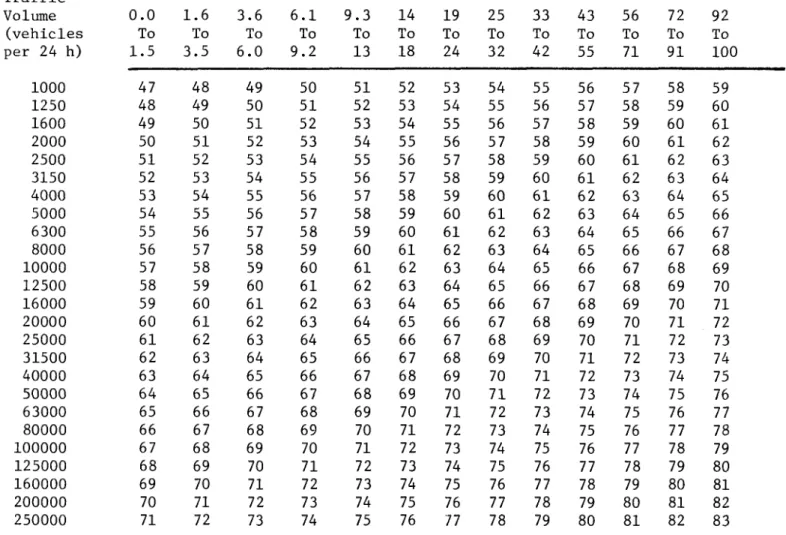
Table 3.1.2 - Equivalent noise level at 30 m from centreline if posted speed limit is 50 km/h
Percentage of Heavy Vehicles Traffic Volume 0.0 1.6 3.6 6.1 9.3 14 19 25 33 43 56 72 92 (vehicles To To To To To To To To To To To To To per 24 h) 1.5 3.5 6.0 9.2 13 18 24 32 42 55 71 91 100 1000 47 48 49 50 51 52 53 54 55 56 57 58 59 1250 48 49 50 51 52 53 54 55 56 57 58 59 60 1600 49 50 51 52 53 54 55 56 57 58 59 60 61 2000 50 51 52 53 54 55 56 57 58 59 60 61 62 2500 51 52 53 54 55 56 57 58 59 60 61 62 63 3150 52 53 54 55 56 57 58 59 60 61 62 63 64 4000 53 54 55 56 57 58 59 60 61 62 63 64 65 5000 54 55 56 57 58 59 60 61 62 63 64 65 66 6300 55 56 57 58 59 60 61 62 63 64 65 66 67 8000 56 57 58 59 60 61 62 63 64 65 66 67 68 10000 57 58 59 60 61 62 63 64 65 66 67 68 69 12500 58 59 60 61 62 63 64 65 66 67 68 69 70 16000 59 60 61 62 63 64 65 66 67 68 69 70 71 20000 60 61 62 63 64 65 66 67 68 69 70 71 72 25000 61 62 63 64 65 66 67 68 69 70 71 72 73 31500 62 63 64 65 66 67 68 69 70 71 72 73 74 40000 63 64 65 66 67 68 69 70 71 72 73 74 75 50000 64 65 66 67 68 69 70 71 72 73 74 75 76 63000 65 66 67 68 69 70 71 72 73 74 75 76 77 80000 66 67 68 69 70 71 72 73 74 75 76 77 78 100000 67 68 69 70 71 72 73 74 75 76 77 78 79 125000 68 69 70 71 72 73 74 75 76 77 78 79 80 160000 69 70 71 72 73 74 75 76 77 78 79 80 81 200000 70 71 72 73 74 75 76 77 78 79 80 81 82 250000 71 72 73 74 75 76 77 78 79 80 81 82 83 NOTE :
1) Where actual traffic volume is not presented in the table, use the nearest listed value.
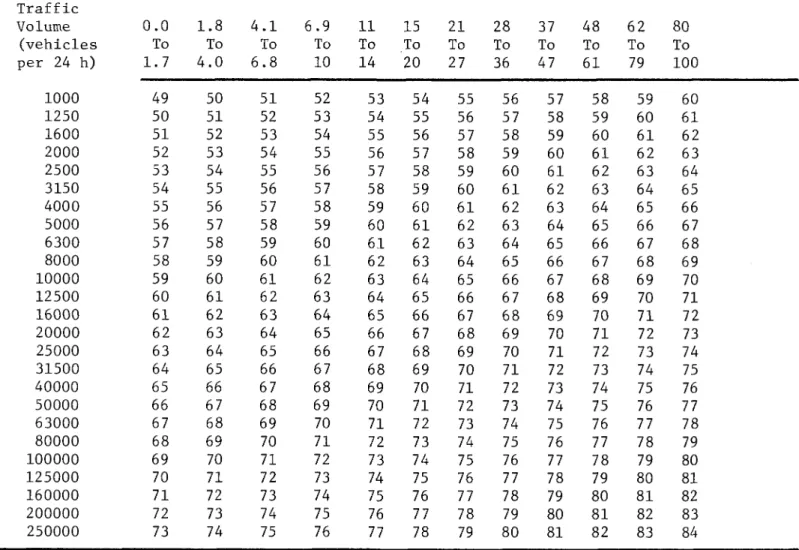
Table 3.1.3 - Equivalent noise level at 30 m from centreline if posted speed limit is 60 km/h
Traffic
Percentage of Heavy Vehicles Volume (vehicles per 24 h) 0.0 To 1.7 1.8 To 4.0 4.1 To 6.8 6.9 To 10 11 To 14 15 To 20 21 To 27 28 To 36 37 To 47 48 To 61 62 To 79 80 To 100 1000 49 50 51 52 53 54 55 56 57 58 59 60 1250 50 51 52 53 54 55 56 57 58 59 60 61 1600 51 52 53 54 55 56 57 58 59 60 61 62 2000 52 53 54 55 56 57 58 59 60 61 62 63 2500 53 54 55 56 57 58 59 60 61 62 63 64 3150 54 55 56 57 58 59 60 61 62 63 64 65 4000 55 56 57 58 59 60 61 62 63 64 65 66 5000 56 57 58 59 60 61 62 63 64 65 66 67 6300 57 58 59 60 61 62 63 64 65 66 67 68 8000 58 59 60 61 62 63 64 65 66 67 68 69 10000 59 60 61 62 63 64 65 66 67 68 69 70 12500 60 61 62 63 64 65 66 67 68 69 70 71 16000 61 62 63 64 65 66 67 68 69 70 71 72 20000 62 63 64 65 66 67 68 69 70 71 72 73 25000 63 64 65 66 67 68 69 70 71 72 73 74 31500 64 65 66 67 68 69 70 71 72 73 74 75 40000 65 66 67 68 69 70 71 72 73 74 75 76 50000 66 67 68 69 70 71 72 73 74 75 76 77 63000 67 68 69 70 71 72 73 74 75 76 77 78 80000 68 69 70 71 72 73 74 75 76 77 78 79 100000 69 70 71 72 73 74 75 76 77 78 79 80 125000 70 71 72 73 74 75 76 77 78 79 80 81 160000 71 72 73 74 75 76 77 78 79 80 81 82 200000 72 73 74 75 76 77 78 79 80 81 82 83 250000 73 74 75 76 77 78 79 80 81 82 83 84 NOTE :
1) Where actual traffic volume is not presented in the table, use the nearest listed value.
Table 3.1.4 - Equivalent noise level at 30 m from centreline if posted speed limit is 70 km/h
Traffic
Percentage of Heavy Vehicles
Volume 0.0 0.7 2.8 5.6 9.0 (vehicles To To To To To per 24 h) 0.6 2.7 5.5 8.9 13 1000 50 51 52 53 54 1250 51 52 53 54 55 1600 52 53 54 55 56 2000 53 54 55 56 57 2500 54 55 56 57 58 3150 55 56 57 58 59 4000 56 57 58 59 60 5000 57 58 59 60 61 6300 58 59 60 61 62 8000 59 60 61 62 63 10000 60 61 62 63 64 12500 61 62 63 64 65 16000 62 63 64 65 66 20000 63 64 65 66 67 25000 64 65 66 67 68 31500 65 66 67 68 69 40000 66 67 68 69 70 50000 67 68 69 70 71 63000 68 69 70 71 72 80000 69 70 71 72 73 100000 70 71 72 73 74 125000 71 72 73 74 75 160000 72 73 74 75 76 200000 73 74 75 76 77 250000 74 75 76 77 78 14 19 26 35 45 59 76 98 To To To To To To To To 18 25 34 44 58 75 97 100 55 56 57 58 59 60 61 62 56 57 58 59 60 61 62 63 57 58 59 60 61 62 63 64 58 59 60 61 62 63 64 65 59 60 61 62 63 64 65 66 60 61 62 63 64 65 66 67 61 62 63 64 65 66 67 68 62 63 64 65 66 67 68 69 63 64 65 66 67 68 69 70 64 65 66 67 68 69 70 71 65 66 67 68 69 70 71 72 66 67 68 69 70 71 72 73 67 68 69 70 71 72 73 74 68 69 70 71 72 73 74 75 69 70 71 72 73 74 75 76 70 71 72 73 74 75 76 77 71 72 73 74 75 76 77 78 72 73 74 75 76 77 78 79 73 74 75 76 77 78 79 80 74 75 76 77 78 79 80 81 75 76 77 78 79 80 81 82 76 77 78 79 80 81 82 83 77 78 79 80 81 82 83 84 78 79 80 81 82 83 84 85 79 80 81 82 83 84 85 86 NOTE :
1) Where actual traffic volume is not presented in the table, use the nearest listed value.
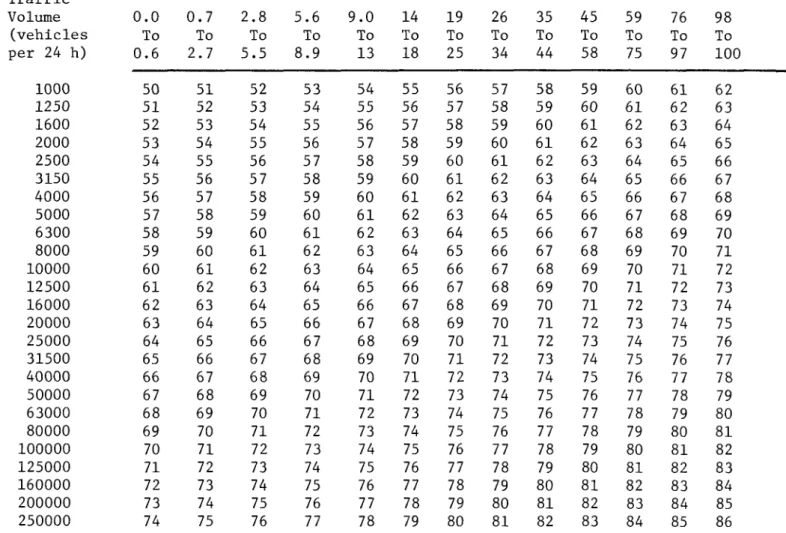
Table 3.1.5 - Equivalent noise level at 30 m from centreline if posted speed limit is 80 km/h
Percentage of Heavy Vehicles Traffic Volume 0.0 2.0 4.7 8.1 13 18 25 33 44 58 75 96 (vehicles To To To To To To To To To To To To per 24 h) 1.9 4.6 8.0 12 17 24 32 43 57 74 95 100 1000 52 53 54 55 56 57 58 59 60 61 62 63 1250 53 54 55 56 57 58 59 60 61 62 63 64 1600 54 55 56 57 58 59 60 61 62 63 64 65 2000 55 56 57 58 59 60 61 62 63 64 65 66 2500 56 57 58 59 60 61 62 63 64 65 66 67 3150 57 58 59 60 61 62 63 64 65 66 67 68 4000 58 59 60 61 62 63 64 65 66 67 68 69 5000 59 60 61 62 63 64 65 66 67 68 69 70 6300 60 61 62 63 64 65 66 67 68 69 70 71 8000 61 62 63 64 65 66 67 68 69 70 71 72 10000 62 63 64 65 66 67 68 69 70 71 72 73 12500 63 64 65 66 67 68 69 70 71 72 73 74 16000 64 65 66 67 68 69 70 71 72 73 74 75 20000 65 66 67 68 69 70 71 72 73 74 75 76 25000 66 67 68 69 70 71 72 73 74 75 76 77 31500 67 68 69 70 71 72 73 74 75 76 77 78 40000 68 69 70 71 72 73 74 75 76 77 78 79 50000 69 70 71 72 73 74 75 76 77 78 79 80 63000 70 71 72 73 74 75 76 77 78 79 80 81 80000 71 72 73 74 75 76 77 78 79 80 81 82 100000 72 73 74 75 76 77 78 79 80 81 82 83 125000 73 74 75 76 77 78 79 80 81 82 83 84 160000 74 75 76 77 78 79 80 81 82 83 84 85 200000 75 76 77 78 79 80 81 82 83 84 85 86 250000 76 77 78 79 80 81 82 83 84 85 86 87 NOTE :
1) Where actual traffic volume is not presented in the table, use the nearest listed value.
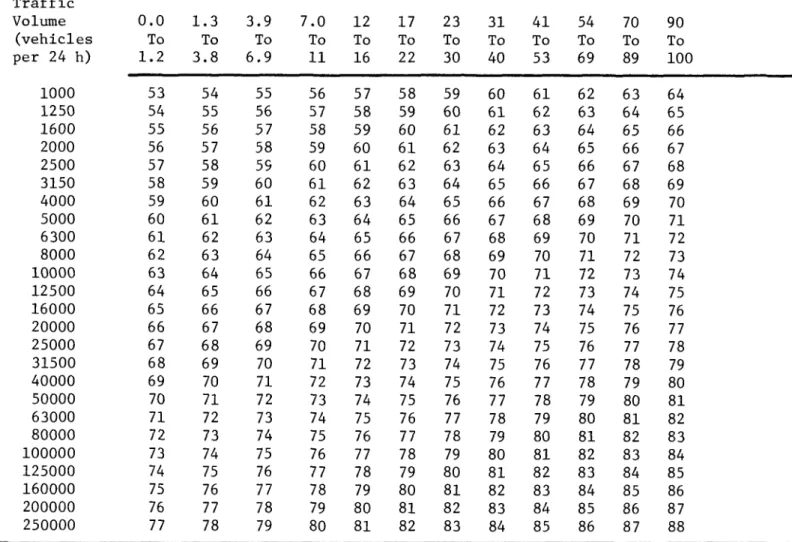
Table 3.1.6 - Equivalent noise level at 30 m from centreline if posted speed limit is 90 km/h
Traffic
Percentage of Heavy Vehicles
Volume 0.0 1.3 3.9 7.0 12 17 23 31 41 54 70 90 (vehicles To To To To To To To To To To To To per 24 h) 1.2 3.8 6.9 11 16 22 30 40 53 69 89 100 1000 53 54 55 56 57 58 59 60 61 62 63 64 1250 54 55 56 57 58 59 60 61 62 63 64 65 1600 55 56 57 58 59 60 61 62 63 64 65 66 2000 56 57 58 59 60 61 62 63 64 65 66 67 2500 57 58 59 60 61 62 63 64 65 66 67 68 3150 58 59 60 61 62 63 64 65 66 67 68 69 4000 59 60 61 62 63 64 65 66 67 68 69 70 5000 60 61 62 63 64 65 66 67 68 69 70 71 6300 61 62 63 64 65 66 67 68 69 70 71 72 8000 62 63 64 65 66 67 68 69 70 71 72 73 10000 63 64 65 66 67 68 69 70 71 72 73 74 12500 64 65 66 67 68 69 70 71 72 73 74 75 16000 65 66 67 68 69 70 71 72 73 74 75 76 20000 66 67 68 69 70 71 72 73 74 75 76 77 25000 67 68 69 70 71 72 73 74 75 76 77 78 31500 68 69 70 71 72 73 74 75 76 77 78 79 40000 69 70 71 72 73 74 75 76 77 78 79 80 50000 70 71 72 73 74 75 76 77 78 79 80 81 63000 71 72 73 74 75 76 77 78 79 80 81 82 80000 72 73 74 75 76 77 78 79 80 81 82 83 100000 73 74 75 76 77 78 79 80 81 82 83 84 125000 74 75 76 77 78 79 80 81 82 83 84 85 160000 75 76 77 78 79 80 81 82 83 84 85 86 200000 76 77 78 79 80 81 82 83 84 85 86 87 250000 77 78 79 80 81 82 83 84 85 86 87 88 NOTE :
1) Where actual traffic volume is not presented in the table, use the nearest listed value.
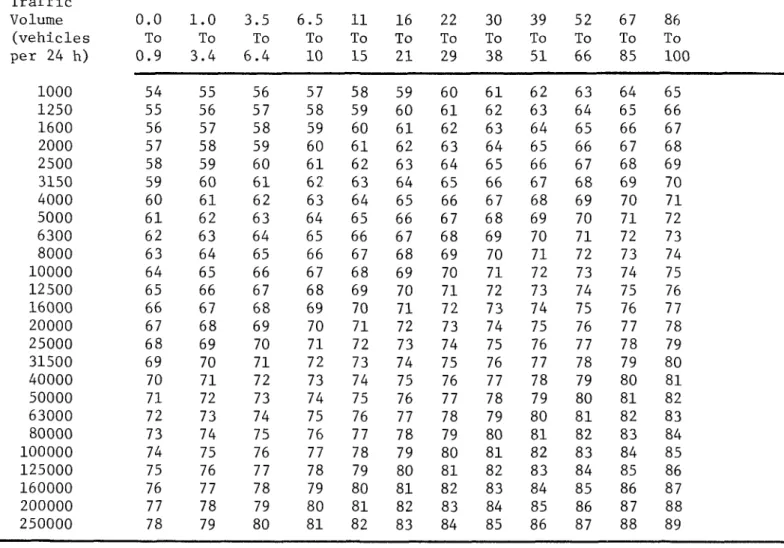
Table 3.1.7 - Equivalent noise level at 30 m from centreline if posted speed limit is 100 km/h
Traffic
Percentage of Heavy Vehicles
Volume 0.0 1.0 3.5 6.5 11 16 22 30 39 52 67 86 (vehicles To To To To To To To To To To To To per 24 h) 0.9 3.4 6.4 10 15 21 29 38 51 66 85 100 1000 54 55 56 57 58 59 60 61 62 63 64 65 1250 55 56 57 58 59 60 61 62 63 64 65 66 1600 56 57 58 59 60 61 62 63 64 65 66 67 2000 57 58 59 60 61 62 63 64 65 66 67 68 2500 58 59 60 61 62 63 64 65 66 67 68 69 3150 59 60 61 62 63 64 65 66 67 68 69 70 4000 60 61 62 63 64 65 66 67 68 69 70 71 5000 61 62 63 64 65 66 67 68 69 70 71 72 6300 62 63 64 65 66 67 68 69 70 71 72 73 8000 63 64 65 66 67 68 69 70 71 72 73 74 10000 64 65 66 67 68 69 70 71 72 73 74 75 12500 65 66 67 68 69 70 71 72 73 74 75 76 16000 66 67 68 69 70 71 72 73 74 75 76 77 20000 67 68 69 70 71 72 73 74 75 76 77 78 25000 68 69 70 71 72 73 74 75 76 77 78 79 31500 69 70 71 72 73 74 75 76 77 78 79 80 40000 70 71 72 73 74 75 76 77 78 79 80 81 50000 71 72 73 74 75 76 77 78 79 80 81 82 63000 72 73 74 75 76 77 78 79 80 81 82 83 80000 73 74 75 76 77 78 79 80 81 82 83 84 100000 74 75 76 77 78 79 80 81 82 83 84 85 125000 75 76 77 78 79 80 81 82 83 84 85 86 160000 76 77 78 79 80 81 82 83 84 85 86 87 200000 77 78 79 80 81 82 83 84 85 86 87 88 250000 78 79 80 81 82 83 84 85 86 87 88 89 NOTE :
1) Where actual traffic volume is not presented in the table, use the nearest listed value.
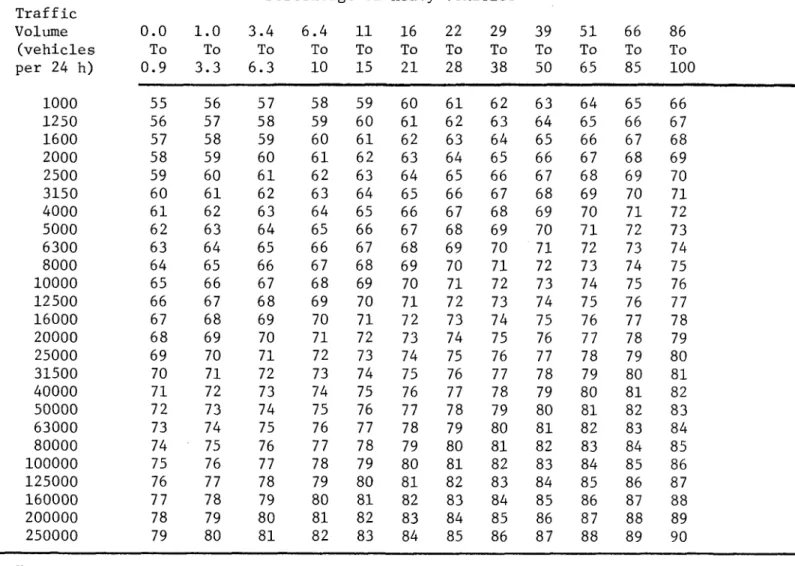
Table 3.1.8 - Equivalent noise level at 30 m from centreline if posted speed limit is 110 km/h
Percentage of Heavy Vehicles Traffic Volume 0.0 1.0 3.4 6.4 11 16 22 29 39 51 66 86 (vehicles To To To To To To To To To To To To per 24 h) 0.9 3.3 6.3 10 15 21 28 38 50 65 85 100 1000 55 56 57 58 59 60 61 62 63 64 65 66 1250 56 57 58 59 60 61 62 63 64 65 66 67 1600 57 58 59 60 61 62 63 64 65 66 67 68 2000 58 59 60 61 62 63 64 65 66 67 68 69 2500 59 60 61 62 63 64 65 66 67 68 69 70 3150 60 61 62 63 64 65 66 67 68 69 70 71 4000 61 62 63 64 65 66 67 68 69 70 71 72 5000 62 63 64 65 66 67 68 69 70 71 72 73 6300 63 64 65 66 67 68 69 70 71 72 73 74 8000 64 65 66 67 68 69 70 71 72 73 74 75 10000 65 66 67 68 69 70 71 72 73 74 75 76 12500 66 67 68 69 70 71 72 73 74 75 76 77 16000 67 68 69 70 71 72 73 74 75 76 77 78 20000 68 69 70 71 72 73 74 75 76 77 78 79 25000 69 70 71 72 73 74 75 76 77 78 79 80 31500 70 71 72 73 74 75 76 77 78 79 80 81 40000 71 72 73 74 75 76 77 78 79 80 81 82 50000 72 73 74 75 76 77 78 79 80 81 82 83 63000 73 74 75 76 77 78 79 80 81 82 83 84 80000 74 75 76 77 78 79 80 81 82 83 84 85 100000 75 76 77 78 79 80 81 82 83 84 85 86 125000 76 77 78 79 80 81 82 83 84 85 86 87 160000 77 78 79 80 81 82 83 84 85 86 87 88 200000 78 79 80 81 82 83 84 85 86 87 88 89 250000 79 80 81 82 83 84 85 86 87 88 89 90 NOTE :
1) Where actual traffic volume is not presented in the table, use the nearest listed value.
Table 3.2 - Correction (in dB) to be added for road gradient Percentage of Heavy Gradient Vehicles 1% 2% 3% 4% 5% 0-7 0 1112 8-12 112 2 3 13 - 17 112 3 3 18 or over 1 2 3 3 4
Table 3.3 - Correction (in dB) to be added for interrupted traffic flow
Distance from
Intersection to Correction
Receiver (metres) (in dB)
0-59 2
60 - 150 1
over 150 0
R e c e iv e r • * '"
Table 3.4 - Equivalent source height (metres) for road traffic
Percentage of Heavy Vehicles 40 50 Traffic 60 70 Speed km/h 80 90 100 110 under 0.7 0.5 0.4 0.4 0.4 0.4 0.3 0.3 0.3 Equivalent 0.8 - 2.0 0.7 0.6 0.5 0.5 0.4 0.4 0.4 0.3 Source 2.1 - 4.0 1.1 0.8 0.7 0.6 0.5 0.5 0.4 0.4 Height 4.1 - 6.0 1.4 1.0 0.8 0.7 0.6 0.5 0.5 0.4 (metres) 6.1 - 8.5 1.5 1.1 0.9 0.7 0.7 0.6 0.5 0.5 8.6 - 12.0 1.6 1.2 1.0 0.8 0.7 0.6 0.6 0.5 13.0 - 16.0 1.7 1.3 1.1 0.9 0.8 0.7 0.6 0.6 17.0 - 22.0 1.8 1.4 1.2 0.9 0.8 0.7 0.6 0.6 23.0 - 50.0 1.9 1.5 1.2 1.0 0.9 0.7 0.6 0.6 51.0 - 100.0 2.0 1.6 1.3 1.1 1.0 0.8 0.7 0.7
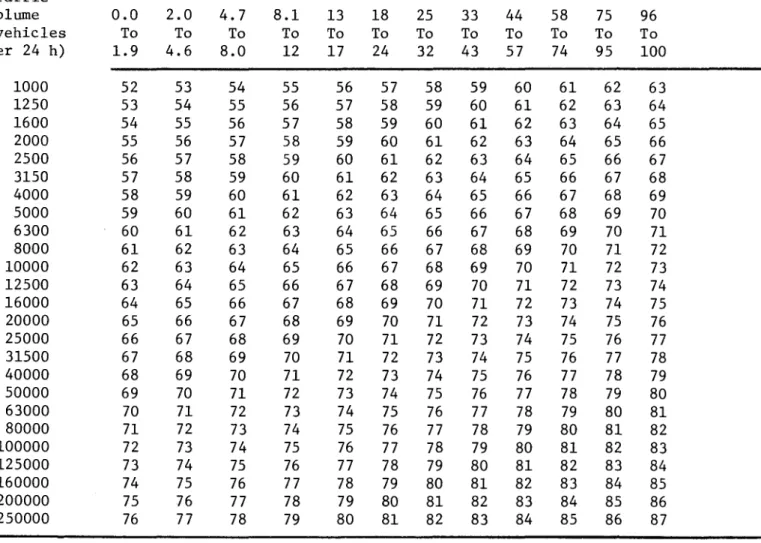
Table 3.5 - Correction (in dB) for distance from source to receiver and for total effective height above ground
Effective HORIZONTAL DISTANCE FROM SOURCE TO RECEIVING POINT (METRES) Total
Height up 11 15 19 23 28 36 46 58 73 91 113 143 181 226 276 351 451 Above to to to to to to to to to to to to to to to to to or Ground 11 14 18 22 27 35 45 57 72 90 112 142 180 225 2 75 350 450 over
Correction in dB if acoustically "soft" surface
58.0 or over +5 +4 +3 +2 +1 0 -1 -2 -3 -4 -5 -6 -7 —8 -9 -11 -13 -15 45.1 to 57.0 +5 +4 +3 +2 +1 0 -1 -2 -3 -4 -5 -6 -7 -8 -10 -12 -14 -16 36.1 to 45.0 +5 +4 +3 +2 +1 0 -1 -2 -3 -4 -5 -6 -7 -9 -11 -13 -15 -17 28.1 to 36.0 +5 +4 +3 +2 +1 0 -1 -2 -3 -4 -5 -6 -8 -10 -12 -14 -16 -18 22.1 to 28.0 +5 +4 +3 +2 +1 0 -1 -2 -3 -4 -5 -7 -9 -11 -13 -15 -17 -19 18.1 to 22.0 +5 +4 +3 +2 +1 0 -1 -2 -3 -4 -6 -8 -10 -12 -14 -16 -18 -20 14.1 to 18.0 +5 +4 +3 +2 +1 0 -1 -2 -3 -5 -7 -9 -11 -13 -15 -17 -18 -20 11.1 to 14.0 +5 +4 +3 +2 +1 0 -1 -2 -4 -6 -8 -10 -12 -14 -16 -17 -19 -21 9.1 to 11.0 +5 +4 +3 +2 +1 0 -1 -3 -5 -7 -9 -11 -13 -15 -17 -18 -20 -21 7.1 to 9.0 +5 +4 +3 +2 +1 0 -2 -4 -6 -8 -10 -12 -14 -16 -17 -19 -20 -22 5.6 to 7.0 +5 +4 +3 +2 +1 -1 -3 -5 -7 -9 -11 -13 -14 -16 -18 -19 -20 -22 4.1 to 5.5 +5 +4 +3 +2 0 -2 -4 -6 -8 -10 -12 -14 -15 -17 -18 -20 -21 -23 2.6 to 4.0 +5 +4 +3 +1 0 -2 -4 -6 —8 -10 -12 -14 -16 -18 -19 -21 -22 -24 up to 2.5 +5 +4 +3 +1 -1 -3 -5 -7 -9 -11 -13 -15 -17 -19 -21 -22 -23 -25
Correction in dB if acoustically "hard" surface
All Heights +5 +4 +3 +2 +1 0 -1 -2 -3 -4 -5 -6 -7 -8 -9 -10 -11 -12 E ffe c tiv e to ta l h e ig h t a b o v e g r o u n d S o u r c e R e c e iv e r S o u r c e s t P
N o b a r r ie r — e ffe c tiv e to ta l h e ig h t = s + r W ith b a r rie r
— e ffe c tiv e to ta l h e ig h t = s + t + p + r
W ith b a rr ie r ( d e p r e s s e d r o a d )
— e ffe c tiv e to ta l h e ig h t = s + t + p + r
W ith b a r r ie r ( d e p r e s s e d s ite )
Table 3.6 - Effective barrier length ratio (w) for asymmetric barriers Ratio v/g over 9.5 8.6 to 9.5 7.6 to 8.5 6.6 to 7.5 5.6 to 6.5 4.6 to 5.5 3.6 to 4.5 Ratio u/g 2.8 2.3 to to 3.5 2.7 1.8 to 2.2 1.3 to 1.7 0.9 to 1.2 0.6 to 0.8 0.36 to 0.50 0.15 to 0.35 less than 0.15 over 9.5 10.0 9.0 9.0 8.0 7.0 6.0 5.0 4.0 4.0 3.0 2.0 1.5 1.0 1.0 0.7 0.7 8.6 - 9.5 9.0 9.0 8.0 7.0 7.0 6.0 5.0 4.0 4.0 3.0 2.0 1.5 1.0 1.0 0.7 0.7 7.6 - 8.5 9.0 8.0 8.0 7.0 7.0 6.0 5.0 4.0 4.0 3.0 2.0 1.5 1.0 1.0 0.7 0.7 6.6 - 7.5 8.0 7.0 7.0 7.0 6.0 6.0 5.0 4.0 3.0 3.0 2.0 1.5 1.0 1.0 0.7 0.7 5.6 - 6.5 7.0 7.0 7.0 6.0 6.0 5.0 5.0 4.0 3.0 3.0 2.0 1.5 1.0 1.0 0.7 0.7 4.6 - 5.5 6.0 6.0 6.0 6.0 5.0 5.0 4.0 4.0 3.0 3.0 2.0 1.5 1.0 1.0 0.7 0.7 3.6 - 4.5 5.0 5.0 5.0 5.0 5.0 4.0 4.0 3.0 3.0 2.5 2.0 1.5 1.0 1.0 0.7 0.7 2.8 - 3.5 4.0 4.0 4.0 4.0 4.0 4.0 3.0 3.0 2.5 2.5 2.0 1.5 1.0 1.0 0.7 0.7 2.3 - 2.7 4.0 4.0 4.0 4.0 4.0 3.0 3.0 2.5 2.5 2.0 2.0 1.5 1.0 1.0 0.7 0.7 1.8 - 2.2 3.0 3.0 3.0 3.0 3.0 3.0 2.5 2.5 2.0 2.0 1.5 1.5 1.0 1.0 0.7 0.7 1.3 - 1.7 2.0 2.0 2.0 2.0 2.0 2.0 2.0 2.0 2.0 1.5 1.5 1.0 1.0 1.0 0.7 0.7 0.9 - 1.2 1.5 1.5 1.5 1.5 1.5 1.5 1.5 1.5 1.5 1.5 1.0 1.0 0.7 0.7 0.7 0.5 0.6 - 0.8 1.0 1.0 1.0 1.0 1.0 1.0 1.0 1.0 1.0 1.0 1.0 0.7 0.7 0.5 0.5 0.3 0.36- 0.5 1.0 1.0 1.0 1.0 1.0 1.0 1.0 1.0 1.0 1.0 1.0 0.7 0.5 0.5 0.3 0.0 0.15-less 0.35 than 0.7 0.7 0.7 0.7 0.7 0.7 0.7 0.7 0.7 0.7 0.7 0.7 0.5 0.3 0.3 0.0 0.15 0.7 0.7 0.7 0.7 0.7 0.7 0.7 0.7 0.7 0.7 0.7 0.5 0.3 0.0 0.0 0.0 C e n tr e lin e o f r a ilw a y ^ ^ L _ _ _ _ _ _ _ _ _ _ _ _ _ _ _ _ _ _ v_ _ _ _ _ _ _ _ _ _ . 1 1 1 U 1 r - T 1 B a r r ie r g , i l 1 1 1 1 1 1 !— * R e c e iv e r F ig . 3 d — P la n v ie w o f r o a d s id e b a rr ie r
Table 3.7 - Barrier attenuation (in dB) for various values of the effective barrier length ratio (w)
Path Length Difference
0.3 0.5 0.7
Effective Barrier Length Ratio 1.0 1.5 2.0 2.5 3.0 4.0 5.0 6.0 (w) 7.0 8.0 9.0 10.0 Infinite Length (in metres)
Barrier Attenuation (in dB)
barrier 0.06 0 0 0 0 0 0 0 0 0 0 0 0 0 0 0 0 does not 0.05 0 0 1 1 1 1 1 1 1 1 1 1 1 1 1 1 interrupt 0.04 1 1 2 2 2 2 2 2 2 2 2 2 2 2 2 2 line of 0.03 1 2 2 2 3 3 3 3 3 3 3 3 3 3 3 3 sight 0.02 1 2 2 3 4 4 4 4 4 4 4 4 4 4 4 4 0.00 1 2 2 3 4 5 5 5 5 5 5 5 5 5 5 5 0.03 1 2 3 4 5 6 6 6 6 6 6 6 6 6 6 6 barrier 0.07 1 2 3 4 5 6 6 6 7 7 7 7 7 7 7 7 does 0.13 1 2 3 4 6 7 7 7 8 8 8 8 8 8 8 8 interrupt 0.20 1 2 3 4 6 7 7 8 9 9 9 9 9 9 9 9 line of 0.30 1 2 3 4 6 7 8 9 9 10 10 10 10 10 10 10 sight 0.41 1 2 3 4 6 7 8 9 10 10 11 11 11 11 11 11 0.55 1 2 3 4 6 8 9 10 11 11 12 12 12 12 12 12 0.79 1 2 3 4 6 8 9 10 11 11 12 12 12 12 12 13 1.0 1 2 3 4 6 8 9 10 11 12 12 13 13 13 13 14 1.4 1 2 3 4 6 8 9 10 11 12 12 13 14 14 14 15 1.8 1 2 3 4 6 8 9 10 12 13 13 14 14 14 15 16 2.5 1 2 3 4 6 8 9 10 12 13 14 15 15 15 16 17 3.3 1 2 3 4 6 8 9 11 12 13 15 15 16 16 17 18 4.5 1 2 3 4 6 8 9 11 12 14 15 16 17 17 18 19 6.0 2 3 3 5 7 8 10 11 13 15 16 17 18 18 19 20
Source : National Research Council of Canada, Division of Building Research, June 1980. NOTE : 1) Where the calculated path length difference is not found in the table,
P A R T 4 — R A IL T R A F N C N O I S h
C o n te n ts
Section A - Rail Traffic Noise Introduction
Cautionary Note
Main Sources of Noise
Section B - Prediction of Outdoor Noise From Rail Traffic Step 1 Traffic Characteristics Step 2 Calculation of Engine Noise Step 3 Calculation of Wheel-Rail Noise Step 4 Correction for Distance
Step 5 Correction for Barriers
. Attenuation for a Barrier of
Infinite Length
. Correction for Actual Barrier Length
. Numerical Example of Work Procedure
Step 6 Calculation of Whistle Noise
Tables
4.1 Engine noise at 30 m from track for train speed of 80 km/h
4.2 Correction (in dB) to engine noise for actual train speed
4.3 Wheel-Rail noise (in dB) at 30 m from track
4.4 Correction (in dB) for distance from source to receiver and for total effective height above ground 4.5 Effective barrier length ratio (w)
for asymmetric barriers
4.6 Barrier attenuation (in dB) for various values of the effective barrier length ratio (w)
4.7 Whistle noise (in dB) for a single train travelling at 80 km/h if ground surface is "hard"
4.8 Correction (in dB) to be subtracted from whistle noise level if ground surface is "soft"
4.9 Correction (in dB) to whistle noise for train speed and number of trains
Figures
4a Effective total height above ground 4b Basic barrier model (vertical section) 4c Necessary dimensions for calculation
of barrier attenuation
4d Plan view of railside barrier
4e Plan view of an equivalent parallel barrier
4f Numerical example of work procedure 4g Plan view of barrier for whistle
noise where receiving point is within whistle zone
4h Plan view of barrier for whistle
noise where receiving point is offset from whistle zone