HAL Id: hal-03002523
https://hal.archives-ouvertes.fr/hal-03002523
Submitted on 7 May 2021
HAL is a multi-disciplinary open access
archive for the deposit and dissemination of
sci-entific research documents, whether they are
pub-lished or not. The documents may come from
teaching and research institutions in France or
abroad, or from public or private research centers.
L’archive ouverte pluridisciplinaire HAL, est
destinée au dépôt et à la diffusion de documents
scientifiques de niveau recherche, publiés ou non,
émanant des établissements d’enseignement et de
recherche français ou étrangers, des laboratoires
publics ou privés.
Distributed under a Creative Commons Attribution| 4.0 International License
Moulting and mortality rates of copepods related to age
within stage: experimental results
Francois Carlotti, Suzanne Nival
To cite this version:
Francois Carlotti, Suzanne Nival. Moulting and mortality rates of copepods related to age within
stage: experimental results. Marine Ecology Progress Series, Inter Research, 1992. �hal-03002523�
Vol. 84: 235-243, 1992 MARINE ECOLOGY PROGRESS SERIES Mar. Ecol. Prog. Ser.
l
Published August 13
Moulting and mortality rates of copepods related
to age within stage: experimental results
Franqois Carlotti, Suzanne Nival
Station Zoologique, U.A. 716, BP 28. F-06230 Villefranche-sur-Mer, France
ABSTRACT Patterns of copepod mortality a n d moulting related to a g e within s t a g e , d e s c n b e d by a mathematical model of population d y n a m ~ c s , w e l e tested experimentally o n C e n t r o p a g e s t y p ~ c u s Individuals of t h e s a m e brood w e r e obseived separately a t regular time intervals fiom copepodite I to adult, sorted a s l ~ v i n g or d e a d , a n d checked for s t a g e T h e results obtained f o ~ the pooled copepods enabled a reconstruction of the m e a n d u r a t ~ o n s of e a c h s t a g e for the whole cohoit, a n d to interpret them ~ 7 1 t h respect to the information acquired for each individual P r o b a b ~ l i t ~ e s of moulting a n d dying w e r e not constant but d e p e n d e d on a g e within s t a g e In all copepodite stages, t h e d i s t r ~ b u t i o n of durations In r e l a t ~ o n to a g e within s t a g e was asymmetrical around a m o d e A minimum moitality rate (0 01 to 0 02 d ') was present before the m o d e of the duration distribut~on Beyond the m o d e , inortality Increased up to a maxlmum of 0 1 for those i n d ~ v i d u a l s w h ~ c h stdyed In a s t a g e twlce as long as normal A conceptual model of moulting a n d mortality rates d u r ~ n g the moult cycle is proposed Modelling a n d esperimentation suggest that the variable development of copepods bred from a synchronous cohoit does not proceed a s a purely random phenomenon, but s e e m s to b e determined by the diverse physiological conditions displayed by d ~ f f e r e n t members oi the s a m e population We show h e r e that m o d e l l ~ n g does not only have a q u a n t ~ t a t i v e purpose - it should also lead to a better understanding of the phenomena involved
INTRODUCTION
Herbivorous copepods a r e the main consumers of phytoplankton in large parts of the oceans, and it is necessary to know the relationship between their pro- duction and environmental conditions. It is important to be aware of the development times and mortality rates of copepods when calculating the production of a popula- tion, and to understand the populations d y n a m c s (Landry 1978,1983, McLaren 1978, Aksnes & Magnesen 1983, Vidal& Smith 1986, Davis 1987). Different methods of assessing instar durations have been worked out in the last decade with a view to constructing life tables (Bergmans 1981, Landry 1983, Hairston & Twombly 1985). Conceptual models of developnlent have been proposed, concerning isochronal (Mlller et al. 1977, Uye 1980, Landry 1983) and equiproportional (Corkett 1984, Corkett et al. 1986) development, as well as the sigmoidal pattern of development (Peterson 1986). Nevertheless, no method can be truly infahble, owing to the combined effects of varying recruitment in instars
a n d mortality rates (Matthews et al. 1978), so that researchers have to find the technique most suited to their particular purposes (Peterson & Painting 1990). Usually, mortality rates a r e estimated throughout the development of a n entire cohort (Paffenhofer 1970, 1976). Nevertheless, stage-specific mortality rates are often difficult or impossible to measure (Fager 1973, Myers & Runge 1983). For this reason Landry (1983) assumed that an error in the estimation of stage-speciflc mortality rates would be proportional to the error in assessing the difference in duration between adjacent instars, i.e. influenced by isochronal development.
Current methods of calculating production a n d models of population dynamics a r e based on the following assumptions:
(1) In constant environmental conditions, mortality rates vary among the instars, but they a r e considered to b e constant within each instar (see Matthews et al. 1978, Wroblewski 1982, Peterson 1986, Sciandra 1986). They have been seen to vary with food (Paffenhofer
1970) a n d temperature (Tande 1988). 0 Inter-Research 1992
236 Mar. Ecol. Prog. Ser. 84: 235-243, 1992
(2)
Stage durations can be estimated in reverse ratio
to moulting rates and are determined by incubating
samples of single stages in static cultures of natural
seawater, for a given period immediately after capture
(Burkill
&Kendall 1982, Falkowski et al. 1983, Miller
et al. 1984, Runge et al. 1985, McLaren et al. 1989).
Consequently, moulting rates in population dynamics
models a r e formulated a s being inversely proportional
to instar durations (Wroblewski 1980, 1982, Sciandra
1.986, Davis 1987, Hofmann
&Ambler 1988). Some-
times, Belehradek's relationship between stage dura-
tions a n d temperature (McLaren 1978) can be intro-
duced into the formulation of moulting rates vs instar
durations (McLaren et al. 1989).
In other words, these
assumptions mean that a g e structure within a life-
history stage is uniform, recruitment into the stage is
constant and all individuals have the same duration in
this stage (no variability).
In fact, however, individual variability does occur in
the development and growth of copepods (Thompson
1982, Miller et al. 1984, Carlotti
&Nival 1991), d u e to
i.ndividua1 variability of the bioenergetic processes
(Bbmstedt 1988). The latter author indicates further-
more that once this variability has been defined, new
models can be set up [see also the Marine Zooplankton
Colloqui.um
1(1989)l.
The deterministic model presented by Carlotti
&Sciandra (1989). Carlotti (1990) a n d Carlotti
&Nival
(1992) combines several hypotheses on the functional
relationships between 2 representation levels: the indi-
vidual a n d the population. Hypotheses concerning the
parameters of population dynamics (mortality rate,
moulting rate, i.e. transfer rate) are related to biologi-
cal criteria (growth rate, weight). Time and age do not
intervene in these processes. On the other hand, simu-
lated growth and development results can be ex-
plained as a function of age within stage and of time
(see Figs.
7
&l 0 of Carlotti
&Nival 1992), a n d their
time course can then be interpreted in relation to the
conceptual scheme proposed.
Th.e purpose of the present experiment was to deter-
mine the time course of moulting and mortality rates
as a function of a g e within stage, and to compare
the experimental results wlth those from the model.
Individuals from the same brood were selected shortly
after having entered a given stage, then put separately
in identical small bowls and submitted to the same
constant conditions of food and temperature. They
were then observed at regular time intervals, sorted
into living or dead a n d checked for stage. The overall
results obtained for the copepods made it possible to
reconstruct the mean durations in each stage for the
whole cohort, and to interpret them In light of the
information acquired for each individual. The results
produced by the model raised a certain number of
questions which we attempted to answer: (1) How does
the individual variability of life duration in each stage
develop, i.e. what is the time course of the probability
of moulting as a function of age within stage? (2) At
what moment in the stage duration does the death of
a n individual take place?
MATERIALS AND METHODS
Wild
Centropages typicus
(Copepoda, Calanoida)
were collected at the entrance to the Bay of Villefranche
in spring 1987. Water temperature and salinity were
15 "C and 38
%Orespectively. Adults of both sexes were
sorted and placed into a cool room (15 "C)
in 5 1 beakers,
where the females could lay their eggs. To prevent the
eggs from being eaten by the adults, they were put
inside a plastic cylinder, closed at the bottom by a
300 pm mesh net, and suspended inside the beaker.
Food was added in excess (16000 cells ml-' of the
haptophycean
Hymenornonas elongata,
ca 12 pm in
diameter). We transferred the adults into other beakers
every 12 h, so as to obtain synchronous egg-layings. The
largest clutch was chosen for the experiment.
The cohort was observed every day until naupliar
stage
V(NV). 260
NVwere then isolated by groups of
5 in 120 m1 bowls, in order to facilitate the observation
of the moulting from NV to copepodite I (CI). As soon
as the first C1 appeared, the bowls were checked at 4 h
intervals and the freshly moulted C1 were put into 20
m1 bowls. A total of 129
C1were sorted out from the
different 120 m1 bowls over 4 d , and w e observed them
throughout their development. The same quantity of
food was added daily to each small (20 ml) individual
bowl, in order to assure that food was not limiting.
Fecal pellets, exuviae, and uningested sedimented
food were carefully removed daily from the bottom of
the bowls, and the water and algae were renewed
every other day. The bowls, protected with aluminum
foil, were kept at 15 "C under a natural die1 light
rhythm. Observations of
Centropages typicus
were
made a t 4 h intervals for the first 2 stages (CI, CII), then
at intervals of 12 h for the following stages, until adult.
RESULTS
Developmental stage durations at 15 ' C
The development of each copepodite was known to
a n accuracy of 12 h (4 h for C1 and CII). Thus it was
possible to calculate the mean duration and standard
deviation for each stage of the whole cohort (Table 1).
Development was not isochronal, since the mean dura-
tions of the stages were unequal and the duration of
Cdrlottl & N ~ v a l : Moulting a n d mortality rates of copepods 237 Stdge M e a n SD n No. of d e a d duratlons ( d ) copepods C1 2 . 7 3 0 5 8 112 17 C11 2 21 0.91 9 0 2 2 CIII 2 48 1.47 7 6 14 CIV 2.93 1.17 64 12 C V 3.47 1.32 52 12 Adult males 16.27 3 80 24 Adult females 14 80 4.59 28
Table 1 Centropages t y p ~ c u s . M e a n durations of c o p e p o d ~ t e Moulting related to age within stage stages at 15 'C, calculated for isolated i n d ~ v i d u a l s . The
n u m b e r of ~ n d i v ~ d u a l s w h ~ c h died in each instar is also shown
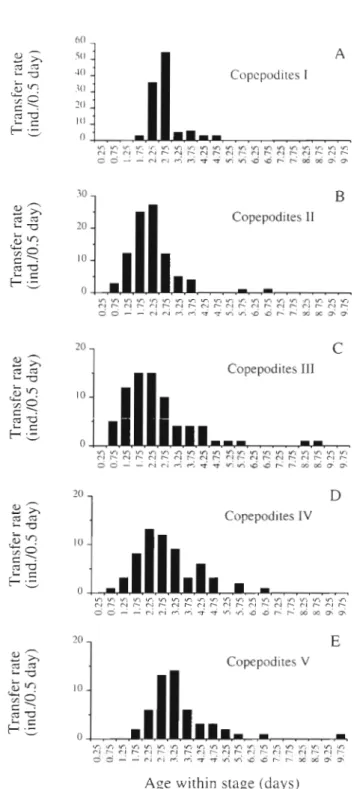
In all copepodite stages, the distribution of durations
T h e experiment b e g a n w ~ t h 129 Individuals a t stage NVIin relation to a g e within stage was asymmetrical
(Fig. 1).
After a minimum length of time spent in the
stage, a large proportion of the individuals changed
stage at the same time, a n d the rest then moulted pro-
gressively. Some individuals were found to remain in a
stage 4
times longer than most of the others (see e . g .
CIII). This phenomenon strongly affected the m e a n
calculated duration (Table 1). For copepodite
111,the
m e a n duration was 2.5 d , whereas the mode was 2 d .
The mode of this distribution apparently provides a
more realistic value of the stage duration than does the
m e a n (see Carlotti & Nival 1991 for details).
the naupliar phase was less than 54.5
%of the total
development time (see Landry 1983). Duration of life
for males was appreciably longer than for females. Of
the copepods which reached adulthood, 46 %
were
males.
Other authors have estimated life durations for
stages or groups of stages (Table 2). We found rather
short durations compared to those reported by Smith &
Lane (1987) for mass cultures at the same temperature.
However, these authors found quite different values of
life durations depending on which method they used
for estimation (see Table 2 ) .
Mortality related to age within stage
O n e of the aims of our experiment was to observe
whether the death rate remains constant throughout
the duration of a stage, or increases at certain times
during the moulting cycle. Although the number of
copepods observed was high (129), the number of d e a d
copepods in each stage was too small (12 to 22) to pro-
vide sound information for every stage (Fig. 2). At best,
we can note that the number of d e a d copepods w a s
about the same on both sides of the duration distribu-
Table 2. Centropages typicus. Companson of d u r a t ~ o n s (in d ) of development obtamed In different studies A D u r a t ~ o n calculated from differences in tune of first ~ndividual's entering each stage; B. calculated from the day when 5 0 % of individuals entered e a c h stage;C a n d D a r e 2 different cultures (see Fryd et al. 1991) Generation tlme is tlme from e g g to e g g . Values In parentheses a r e ranges Study: Present Smith & Lane Gaudy Miller et al. Lawson & G n c e Nassogne Fryd et al.
(1987) (1976) (1984) (1970) (1972) (1991)
Culture: I n d i v ~ d u a l Population In silu - P o p u l a t ~ o n P o p u l a t ~ o n In d ~ v i d u a l Population
Food. Hymenomonas Thalassios~ra - - Mixture Mixture Rhodomonas baltjca,
elongata we~ssflogi O x y r r h ~ s marina
Temperature: 1 5 "C 15 5 1 ° C 1 8 ° C 15°C 18-19 "C 1 8 "C 1 8 "C 17 2 0 . 5 "C A B C D - Egg to NVI 12 14.1 16.4 8 8 (6-15) 8 (6-10) NI1 to NVI 5 . 4 6 5.99 C1 2.73 1.9 2.3 2 1 26 1.29 C11 2.21 2 9 4.2 3 1 3 8 1 . 9 1 C111 2 4 8 3 5 4.7 4 1 5 8 1 3 1 CIV 2.93 4 8 4.9 5 5 2.18 2 04 C V 3.47 3 . 5 0.5 6 2.70 2 29 Adult males 16.27 Adult females 14.80 C1 to adult 13.82 1 2 (8-14) l 1 (6-14) E g g to adult 25.82 30.7 33.0 28 16 16 Generation time 33 22 38 (29-44)
238 Mar. Ecol. Prog. Ser. 84: 235-243, 1992
Copcpodites I
Copepodites I1
4Copepodites I1
3 'Copepodites
111Copepodites
111D
Copepodites IV
Copepodites lV
E
Copepodites V
Copepodites
VAge within stage (days)
Age within stage (days)
Fig. 1 Centropages typicus.Number of
individuals moultingfrom one copepodite stage to the next ds a function of age within stage. The transfer rate is expressed as individuals
per 0.25 d
Fig. 2. Centropages typicus. Number of dead individuals as a function of age within stage. The mortality rate is expressed
as individuals per 0.25 d
tion, except for CI, which implies that the intrinsic
mortality rate (number of dead in each class /number
of survivors) is higher for individuals which stay in a
stage for longer than the mean duration. The higher
mortality rate at the beginning of stage CI can be
attributed to the NVI-CI metamorphosis.
Pattern of moulting and mortality rates in copepodite
stages
With a view to establishing rules, w e can assume
that moulting and mortality functions are the same for
all copepodite stages. As a matter of fact, development
Carlotti & Nival Moulting and mortality rates of copepods 239
--
of copepodite stages is subdivided into moults, and
physiological processes follow the same rules (Vidal
1980a, b, c). Thus we cumulated the values obtained in
all stages (Fig, 3) after having normalized them, i.e.
after having divided the ages of transfer or death in
each stage by the distribution mode shown in Fig.
1.The reference unit thus becomes the 'life duration
unit'. The durations obtained were arranged in groups
of one fourth of the life duration unit.
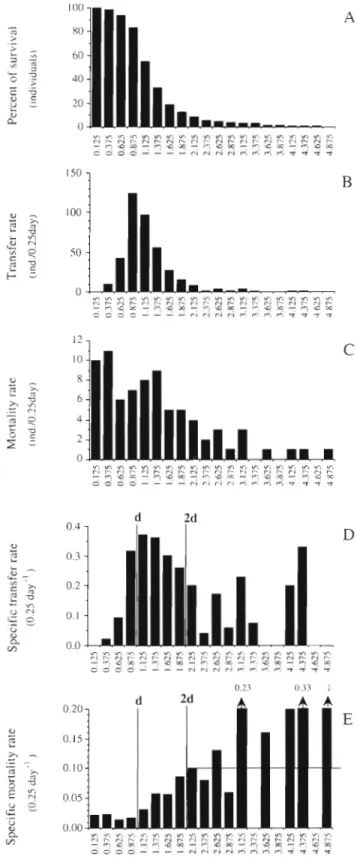
When a large number of individuals is observed, we
can refine the shape of the curves representing the
survival (Fig. 3A) and the transfer function (Fig. 3B)
according to the copepods age. Two parts can be dis-
tinguished: after a compulsory period of time in the
stage, the probability of passing to the next one
increases exponentially, goes through a maximum,
then decreases again exponentially, but with a more
moderate slope than for the increase. The specific
transfer rate (Fig. 3D) follows a pattern similar to the
transfer rate, with the second part decreasing more
slowly. The variability in the last few values is due to
the small number of individuals (see Fig.
3 legend).
The number of copepods which died during each
period of time decreased with age (Fig 3C), but the
intrinsic mortality rate increased (Fig. 3E). Starting at
a value of 0,02,
i t reached a maximum of 0.1 for indi-viduals which stayed in a stage twice as long as
normal. The final fluctuations after 2 life duration units
are attributable to the small numbers of copepods
remaining (e.g. 1 dead animal for 3 survivors = 0.33).
We can estimate graphically the mean of this maxi-
mum death rate at around 0.1 to 0,12.
DISCUSSION
If the copepods are considered individually, moulting
and death are discrete events compared to life duration,
and their probability varies with biological characteris-
tics. For copepods, these biological characteristics are
Fig. 3. Centropages typicus. (A) Survival curves
in
a copepodite stage (mean of survival curves from the 5 copepodite stages). (B & C) Mean distribution of transfer rate and mortality rate for individuals of all copepodite stages. (D & E) Specific transfer rate and specific mortality rate (per 0.25 d) obtained by the ratios of graphs B and C, respectively, to the absolute abun- dance. The life duration unit, indicated by 'd' in panels D & E, corresponds to the mode of the duration of copepodite stages in Fig. 1 (after normalization). The maximum transfer rate occurs at this value. For the specific rates, there is a strong variability at the end of the curves, d u e to the individuals which progres- sively disappeared (for instance, at 4.875 duration units, the death of the last individual induces a mortality rate of 100 %). Individuals which stay within a stage longer than 2 X d reach amaximum mortality rate (horizontal line)
not well known and account for the hypothesis that
growth and development may be uncoupled by a hor-
monal mechanism (Miller et al. 1977;
see their Fig. 8).
This is due to the difficulty in experimentally estab-
24 0 Mar. Ecol. Prog. Ser. 84: 235-243. 1992
lishing
laws
linking processes
which vary
simultane-
copepods
bred
from
a
synchronous
cohort
no
longer
ously, e . g .
growth
rate and mortality
rate, which
cannot
appears to
be
a
purely
random phenomenon,
but seems
be controlled. It
is
impossible
to
discriminate
the
effect
to
be
determined
by
the diversity
of
physiological
of
deterministic
fluctuations
of
processes
from
those
conditions displayed
by different
members
of
the same
generated
by
individual
variability.
It
is
easier to
ob-
population.
serve
life durations
in
stages
and survival
as
functions
of
variables
which can be
controlled:
food
level, tempera-
ture,
etc. However,
when
interpreting results
obtained
Mortality rate
by such a n approach, we must
bear
in mind that not all
the functional
steps
have
been
taken into account.
The
experimental
results
(Fig. 3C)
show
that
the
The
use of
a physiological model
(Carlotti
& Sciandraintrinsic mortality
rate
in
a
stage
is
not
constant, but
1989,
Carlotti
&Nival
1992) is probably
another
means
varies
with
age. It
increases when the
copepods live
of
obtaining
information
for
interpreting
the
popula-
longer
than
the
mean
life
duration
and
reaches
a
tion
dynamics
of
planktivorous
animals. There may
be
maximum
when
thls
duration
doubles.
This
observation
processes
or variables
to which
the
experimenter
has
is
due to
a decay
in
the
physiological state
of
the
organ-
no
access,
because
fluctuations
are
hidden
by
other
ism
as a function of
age.
The model (Carlotti
& Sciandraprocesses
or
even
by
individual
variability
(see
func-
1989,
Carlotti
&Nival1992)
proposes
a
relation
between
tion f4
of
the model;
Carlotti
&Sciandra
1989,
Carlotti
mortality rate
and
growth
rate.
We have
seen
that
the
Pc
Nival
1992).
That
is why
processes and variables
are
tails of
the
distribution
of
the individuals
in
a
stage
were
ignored
in
conceptual
schemes
established
wlth
ex-
influenced by
a n
increasingly
lower
growth
rate
of
the
perimental
data.
The
model,
however,
is
capable
of
organisms. It follows that these low
growth
rates
are
the
representing
the patterns of
functional relations
which
cause of
a
higher probability of
death.
underlie
developmental
a n d
growth
phenomena,
as
The
natural
mortality
rate of
the
copepod
Centropages
well
as
testing
them.
The
results
presented
here
con-
typicus,
i.e.
the mortality
caused by
physiological
decay,
stitute
an
experimental
check
of
the
simulations
of
a
varies
from0.01
to
0.1
d - ' among copepodite stages.
'll-Lls
physiological
model.
Therefore
w e discuss
below
the
is
generally
the range
of
mortality
rates
observed
in cul-
hypotheses
suggested
by
the
model:
how
do
the
tures and sometimes in
situ under
favourable
conditions
physiological
processes
involved in
growth and
devel-
(Fager
1973,
Landry
1978,
Parslow et
al.
1979,
Uye
1982,
opment
influence
the
pattern of
moulting and mortality
Yassen 1984,
Strathmann
1985,
Tande
1988).
The differ-
rate during
the moulting
cycle?
ence
between
the
lowest
and
highest mortality
rates
is
attributable
to
the
ageing of
organisms in
a
given
stage
and
to
their
failure
to prepare
for moulting.
Moulting
rate
Actually,
it
is
almost
certain that, in situ,
the
portion
of
natural
mortality
that
has
a
physiological
cause
is
The
probability
of
moulting
depends
on age
within
represented by
the
minimum mortality rate
(see
Fig.
3),
stage,
and
thus
is
not
constant. An individual
which
has
since
the
individuals
which
live longer
than
normal
die
just moulted
cannot
immediately moult to the
following
more
easily
due
to
physiological
deficiency,
and
are
stage;
it
must
acquire
the
capacity to
do
so.
Conse-
also
more easily
caught by
predators.
quently,
it
must
stay
in
a
stage
for
a
minimum length of
It
would
be
interesting to
repeat
this
experiment in
time.
In
the
model, the
transfer
rate
;.S
controlled
by
order
to
determine
the
minimum
mortality
rate
at
weight and
by the
mean
growth
rate
over
the
preceding
different
temperatures, and
compare the
results
with
hours
(for
details
see the
hypotheses
in Carlotti
&Nival
those
obtained
by
Tande
(1988).
Since the
mortality
1992).
The distribution
of
individual
duratlons in a cope-
rate
in
the
model
(Carlotti
&Nival
1992)
depends
on
podite
stage
(Fig.
3B)
falls into
2
distinct
parts,
like
the
the
growth
rate,
and
as
it is
relatively easy
to obtain the
distributions
obtained
by
simulation (Fig 7
in
Carlotti
&growth
rates
at
different
temperatures
(see
e.g.
Miller
Nival 1992),
suggesting
that at
least 2 biological factors
et al.
1977),
the
accuracy
of
the
function
used
to predict
play a
role.
In
the
model,
the weight
function
influences
mortality
can
be checked.
the
first
part.
The
hypothesis
that the
critical
moulting
weight
is
the
same
for
all the
individuals
in
a
stage, i.e.
that
it
is
a
specific
characteristic
of
growth,
means
there
Conceptual
model of
moulting
and
mortality
rates
1s a rapid
increa.se
in moulting
probability when
the in.-
during
the
moulting
cycle
dividuals
come
close
to that
weight. Individual
variabil-
ity
in
growth
rate
is
the
only
factor
which
can
generate a
Miller
et
al.
(1984) attempted
to
establish
whether
spreading
of
the
moulting
age
in
the population.
With
moulting
rate
was
inverse1.y related
to
stage
duration,
this
type
of
model,
the
variability
in
development
of
using
numerous
examples.
They
observed
this
some-
Carlotti & Nival: Moulting and mortality rates of copepods 24 1
times, but not always. Their forn~ulation
was based on
the assumption that copepods are uniformly distri-
buted within a given stage (Fig.
4 A ) .This is possible i f :
(1)recruitment is constant at the start (when the cope-
pods enter the first stage);
(2)there is no phys~ologl-
cally caused mortality during development (no loss of
animals); (3) the copepods moult as soon as they reach
the end of the stage duration time; ( 4 )
there is no mor-
tality of copepods which have moulted (thls would lead
to an incorrect interpretation of results). Fig.
4 Bshows
the distribution obtained in a particular case of con-
stant recruitment (see Fig. 10 in Carlotti & Nival 1992)
with the time course of transfer and mortality rates pro-
ceeding as a function of the moulting cycle, estab-
lished by the model and the experiment (see Fig.
3 ) .At
first, due to a minimum physiological mortality
(1to
2 %),
some individuals disappear, thus inducing a
slight decrease in the abundance. The animals then
moult according to the transfer rate rule or, if they stay
in the stage, they disappear because of a n increasing
probability of death.
The distribution can then spread more or less widely,
according to the shapes of the curves for the transfer
and mortality rates. If the transfer rate function is very
densely clustered around its mode, the population dis-
appears rapidly. This phenomenon will occur only
when food and temperature conditions are the most
favourable for development of the organisms (see
Fig. l 1 in Carlotti & Sciandra 1989). Under favourable
conditions, the minimum mortality rate will be a few
Transfer Constant recruitment Spec~fic / transfer rare Survival Specific
Age within stage
Fig. 4. (A) Uniform distribution of age within stage. Such a distribution would require constant recruitment, no mortality and a typical moulting age. (B) Distribution obtained with realistic rates of moulting and mortality related with age. Only with constant recruitment, and optimal environmental
conditions, can a nearly uniform distribution be obtained
per cent and the distribution of individuals in the stage,
will be almost uniform, as long as recruitment is con-
tinuous. Under unfavourable conditions, there would
be a broader spreading of the transfer and mortality
curves, and recruitment into the stage would pre-
sumably be discontinuous.
When following the growth of individuals of the
same population under identical conditions, a slrnilar
mean pattern with some individual variability 1s ob-
served. The growth of an individual of a given species
can then be assumed to go through characteristic onto-
genic phases, and the time spent in the different com-
pulsory phases depends on the growth rate. Thus, the
relation between transfer rate and a g e within stage is
a consequence of biological phenomena. What really
matters, therefore, is the discovery of suitable bio-
logical criteria. Any essentially analytical biological
model should be free from functions related simply to
a g e or time. In our model, we suggest the existence of
acritical moulting weight, which can possibly decrease
with temperature (see discussion in Carlotti & Sciandra
1989). To validate this approach, it would be necessary
to explore it experimentally, for instance by following
the development of the progeny of
1female under
different temperature conditions.
Acknowledgements. This work was part of a doctoral t h e s s at the University of Paris 6 (Carlotti 1990), supported by UA 716 of CNRS. We thank P. Nival and Q. Bone for comments on an earlier draft, and M. Delahaye for improving the English. We extend our gratitude to the anonymous reviewers for thelr constructive comments.
LITERATURE CITED
Aksnes, D. L., Magnesen, T (1983). Distribution, develop-
ment, and production of Calanus finmarchicus (Gun-
nerus) in LindAspollene, western Norway. 1979. Sarsia 68:
195-208
Bbmstedt, U. (1988). Ecological significance of individual variability in copepod energetics. Hydrobiologia 167/168:
43-59
Bergmans, M. (1981). A demographic study of the life cycle
of Tisbe furcata (Baird, 1837) (Copepoda, Harpacticoida).
J. mar. biol. Ass. U.K. 61: 691-705
Burkill, P. H., Kendall, T F. (1982). Production of the copepod Eurytemora affinis in the Bristol channel. Mar. Ecol. Prog.
Ser. 7: 21-31
Carlotti. F. (1990). Modele de recrutement d'especes marines. Couplage du bilan d e matiere individuel et d e la dy- namique d e population. These d e Doctorat d e 1'Universite
Pierre et Marie Curie, Universite Paris V1
Carlotti, F., Nival, S. (1991). Individual variability of develop- ment in laboratory reared Temora stylifera copepodites:
consequences for the population dynamics and inter-
pretation in the scope of growth and development rules.
J . Plankton Res. 13(4): 801-813
Carlotti, F., Nival, P. (1992). Adodel of copepod growth
Mar. Ecol. Prog. Ser. 84: 235-243, 1992
physiological processes during an individual moult cycle. Mar. Ecol. Prog. Ser. 84: 219-233
Carlotti, F., Sciandra, A. (1989). Population dynamics model of Euterpina acutifrons (Copepoda: Harpacticoida) coupling individual growth and larval development. Mar. Ecol. Prog. Ser. 56: 225-242
Corkett. C. J . (1984). Observations on development in cope- pods. Crustaceana (Suppl.) 7: 150-153
Corkett, C. J . , McLaren, I. A., Sevigny, J . M. (1986). The rearing of marlne copepods Calanus finmarchicus (Gun- nerus), C. glacialis Jaschnov and C. hyperboreus Kroyer with comment on the equiproportional rule (Copepoda). Syllogeus (Nat. hlus. Can.) 58: 539-546
Davis, C S. (19871. Components of the zooplankton produc- tion cycle in the temperate ocean. J . mar. Res. 45: 947-903 Fager. E. W. (1973). Estimation of mortality coefficients
from field samples of zooplankton. Limnol. Oceanogr. 18: 297-301
Falkowski, P. G., Vidal, J., Hopkins, T. S., Rowe, G. T., Whiteledge, T E., Harnson, W. G . (1983). Summer nutrient dynamics in the Middle Atlantic Bight: primary production and utilization of phytoplankton carbon. J . Plankton Res. 5: 515-537
Fryd, M-, Haslund, 0. H., Wohlgemuth, 0. (1991). Develop- ment, growth and egg production of the two copepod species Centropages hamatus and Centropages typicus in the laboratory .I. Planktnn RPS. 13(4): 683-689
Gaudy, R. (1976) Etude du plancton de la zone nord de la rade de Villefranche a la fin du printemps. 111. Production secondaire des copepodes pelagiques. Vie Milieu (S&. B.) 26: 77-106
Hairston, N. G . , Twombly, S (1985). Obtaining life table data from cohort analysis. a critique of current methods. Limnol. Oceanogr. 30: 886-893
Hofmann. E. E.. Ambler, J . M. (1988). Plankton dynamics on the outer southeastern U.S. continental shelf. Part. 11. A dependent biolog~cal model J . mar. Res. 46: 883-91.7 Landry, M. R. (1978). Population dynamics of the planktonic
marine copepod Acartia clausi Giesbrecht in a small temperate lagoon. Int. Revue ges. Hydrobiol. 63: 77-119 Landry, M . R. (1983). The development of marine calanoid
copepods with comment on the isochronal rule Limnol. Oceanogr. 28: 614-624
Lawson. T. J., Grice, G. (1970). The development stages of Centropages typicus Kreyer (Copepoda, Calanoida). Crustaceana 18. 187-208
Marine Zooplankton Colloquium 1 (1989). Future marine zooplankton research - a perspective. Mar. Ecol. Prog. Ser. 55: 197-206 '
Matthews, J . B. L., Hestad, L , Bakke, J L. W. (1978) Eco- logical studies In Korsfjorden, western Norway The generation and stocks of Calanus hyperboreus and C. finmarchicus in 1971-1974. Oceanol. Acta 1 277-284 McLaren, I. A. (1.9781. Generation lengths of some temperate
marine copepods! estimations, production and implica- tions. J . Fish. Res. Bd Can. 345: 1330-1342
McLaren, I. A., Tremblay, M. J., Corkett, C. J., Roff, J . C. (1989). Copepod production on the Scotian Shelf based on life-history analyses and laboratory rearings. Can J Fish. Aquat. Sci. 46: 560-583
Miller, C. B., Huntley, M. E., Brooks, E. R. (1984). Post- collection molting rates of planktonic marine copepods: measurement, applications, problems. Limnol. Oceanogr. 29: 1274- 1289
Miller, C. B., Johnson, J. K., Heinle, D. R. (1977). Growth rules in the marine copepod genus Acartia. Limnol. Oceanogr. 22: 326-335
Myers, R A., Runge, J . A. (1983). Predictions of seasonal natural mortality rates in a copepod population uslng life- history theory. Mar. Ecol. Prog. Ser. 11: 189-194
Nassogne, A. (1972). Etudes preliminaires du zooplankton dans la constitution et le transfert de la matiere organique au sein de la chaine alimentaire marine en Mer Ligure. Ph.D. dissertation, Univ. of Amsterdam
Paffenhofer, G. A. (1970). Cultivation of Calanus helgo- landicus under controlled conditions. Helgolander wiss. Meeresunters. 20. 346-359
Paffenhofer, G. A. (1976). Feeding, growth and food conver- sion of the marine planktonic copepod Calanus helgo- landicus. Limnol. Oceanogr. 21. 39-50
Parslow, J . , Sonntag, N. C . , Matthews, J . B. L. (1979). Tech- nique of systems identification applied to estimating cope- pod population parameters. J. Plankton Res. 1: 137-152 Peterson, W. T. (1986). Development, growth and survivorship
of the copepod Calanus marshallae in the laboratory. Mar. Ecol. Prog. Ser. 29: 61-72
Peterson, W. T., Painting, S. J. (1990). Developmental rates of the copepods Calanus australis and Calanoides carinatus in the laboratory, with discussion of methods and for cal- culation of development time. J . Plankton Res. 12: 283-293 Runge, J . A . , McLaren, I. A., Corkett, C. J., Bohrer, R. N.,
Koslow. J. A. (1985). Molting rates and cohort develop- ment of Calanus finmarchicus and C. glacialis in the sea of southwest Novia Scotia. Mar. Biol. 86: 241-246
Sciandra, A. (1986). Study and modelling of development of Euterpina acutifrons (Copepoda, Harpacticoida). J. Plank- ton Res. 8: 1149-1 162
Smith, S. L., Lane, P. V. 2. (1987). On the life history of Centropages typicus: response to a fall diatom bloom in the New York R~ght. Mar. Blol 95: 305-313
Strathmann. R. (1985). Feeding and non feeding larval devel- opment and life history evolution in marine invertebrates. Ann. Rev. Ecol. Syst. 16: 339-361
Tande, K S. (1988) Aspects of developmental and mortality rates in Calanus finmarchicus related to equiproportional development. Mar. Ecol. Prog. Ser. 44: 51-58
Thompson, B. M. (1982). Growth and development of Pseudocalanus elongatus and Calanus sp. in the labora- tory. J . mar. biol. Ass. U.K. 62: 359-372
Uye, S. (1980). Development of neritic copepods Acartia clausi and A. steueri. 2. Isochronal larval development at various temperatures. Bull. Plankton Soc. Jap. 27: 11-18 Uye, S. (1982). Population dynamics and production of Acartia
clausi Giesbrecht (Copepoda. Calanoida) In inlet waters. J. exp. mar. Biol. Ecol. 57: 55-83
Vidal, J . (1980a). Physioecology of zooplankton. I. Effects of phytoplankton concentration, temperature, and body size on the growth rate of Calanus pacificus and Pseudo- calanus sp. Mar. Biol. 56: 111-134
Vidal, J . (1980b). Physioecology of zooplankton. 11. Effects of phytoplankton concentration, temperature and body size on the development and moltlng rates of Calanus pac~fi- cus and Pseudocalanus sp. Mar. Biol. 56: 135-146
Vidal. J . ( 1 9 8 0 ~ ) . Physioecology of zooplankton. 111. Effects of phytoplankton concentration, temperature, and body size on the metabolic rate of Calanus pacificus Mar. Biol. 56: 195-202
Vidal, J., Smith, S. L. (1986). Biornass, growth and develop- ment of populations of herbivorous zooplankton in the southeastern Bering Sea during spring. Deep Sea Res. 33(4]: 523-556
Wroblewski. J S. (1980). A simulation of the distribution of Acartia clausi during the Oregon upwelling. August 1973. J . Plankton Res. 2: 46-68
Carlotti & Nival: Moultlng a n d mortality rates of copepods 243
Wroblewski, J S. (1982). Interaction of currents and vertical Yassen, S. T (1984). Competition entre trois especes d e mlgratlon in maintaining Calanus marshallae in the copepodes planctoniques e n elevage: E u t ~ r p i n a acuti- Oregon upwelling zone - a simulation. Deep Sea Res. 29: frons, Temora stylifera, Acartia clausi. Etude ecophysio-
665-686 l o g ~ q u e . These d e Doctorat d'Etat, Universite Paris V1
This article was submitted to the editor Manuscript first received. March 15, 1991 Revised version accepted. June 9, 1992