Analysis of Airspace Traffic Structure and Air
Traffic Control Techniques
by
Emilio Alverne Falc˜
ao de Albuquerque Filho
Submitted to the Department of Aeronautics and Astronautics
in partial fulfillment of the requirements for the degree of
Master of Science in Aeronautics and Astronautics
at the
MASSACHUSETTS INSTITUTE OF TECHNOLOGY
June 2012
c
Massachusetts Institute of Technology 2012. All rights reserved.
Author . . . .
Department of Aeronautics and Astronautics
March 9, 2012
Certified by . . . .
R. John Hansman
Professor of Aeronautics and Astronautics
Thesis Supervisor
Accepted by . . . .
Eytan H. Modiano
Professor of Aeronautics and Astronautics
Chair, Graduate Program Committee
Analysis of Airspace Traffic Structure and Air Traffic
Control Techniques
by
Emilio Alverne Falc˜
ao de Albuquerque Filho
Submitted to the Department of Aeronautics and Astronautics on March 9, 2012, in partial fulfillment of the
requirements for the degree of
Master of Science in Aeronautics and Astronautics
Abstract
Air traffic controller cognitive processes are a limiting factor in providing safe and efficient flow of traffic. Therefore, there has been work in understanding the factors that drive controllers decision-making processes. Prior work has identified that the airspace structure, defined by the reference elements, procedural elements and pattern elements of the traffic, is important for abstraction and management of the traffic. This work explores in more detail this relationship between airspace structure and air traffic controller management techniques.
This work looks at the current National Airspace System (NAS) and identifies different types of high altitude sectors, based on metrics that are likely to correlate with tasks that controllers have to perform. Variations of structural patterns, such as flows and critical points were also observed. These patterns were then related to groupings by origins and destinations of the traffic. Deeper pilot-controller voice communication analysis indicated that groupings by flight plan received consistent and repeatable sequences of commands, which were identified as techniques. These repeated modifications generated patterns in the traffic, which were naturally associ-ated with the standard flight plan groupings and their techniques.
The identified relationship between flight plan groupings and management tech-niques helps to validate the grouping structure-base abstraction introduced by Histon and Hansman (2008). This motivates the adoption of a grouping-focused analysis of traffic structures on the investigation of how new technologies, procedures and con-cepts of operations will impact the way controllers manage the traffic. Consideration of such mutual effects between structure and controllers’ cognitive processes should provide a better foundation for training and for engineering decisions that include a human-centered perspective.
Thesis Supervisor: R. John Hansman
Acknowledgments
This work was financially supported by FAA grant 06-G-006 and NASA Cooperative Agreement NN06CN23A. Anton Koros and Eddie Sierra were the technical sponsors and provided valuable feedback and assistance.
Thanks to Jonathan Histon from University of Waterloo for intellectual feedback and collaboration throughout this research.
Contents
1 Introduction 17
1.1 Motivation . . . 17
1.2 Structure in the Air Traffic Control System . . . 18
1.3 Focus of Research . . . 21
1.3.1 Focus: Patterns in the Structure . . . 21
1.3.2 Focus: High and Super High Altitude Airspace . . . 21
1.4 Objective . . . 22
1.5 Document Overview . . . 24
2 Literature Review 25 2.1 Decision Making . . . 25
2.1.1 Recognition-Primed Decision Making . . . 27
2.2 Air Traffic Control Cognitive Process Model . . . 28
2.2.1 Structure-Based Abstractions . . . 31
2.2.2 Strategies and Techniques in ATC Domain . . . 34
2.3 Complexity in Air Traffic Control . . . 38
2.3.1 Estimating Situation Complexity . . . 40
2.4 Identifying Patterns in the Structure . . . 43
2.4.1 Identifying Structural Patterns . . . 44
2.5 Summary . . . 46
3 Analysis of NAS-wide Traffic Patterns 49 3.1 Methodology . . . 50
3.1.1 Evaluation Data . . . 50
3.1.2 Selected traffic metrics . . . 51
3.1.3 Clustering Method . . . 57
3.2 Results . . . 60
3.3 Summary . . . 69
4 Analysis of Structural Patterns 71 4.1 Methodology . . . 71
4.1.1 Evaluation Data . . . 74
4.2 Observed Variations of Structural Features . . . 74
4.3 Analysis of Origins and Destinations . . . 79
4.3.1 OD Analysis: Cleveland 59 (ZOB59) . . . 85
4.3.2 OD Analysis: Boston 38 (ZBW38) . . . 90
4.3.3 OD Analysis: Fort Worth 90 (ZFW90) . . . 94
4.3.4 OD Analysis: Albuquerque 98 (ZAB98) . . . 97
4.4 Summary . . . 100
5 Analysis of Impact of Structure on ATC Techniques 103 5.1 Methodology . . . 103
5.1.1 Evaluation Data . . . 105
5.1.2 Analysis of voice communication . . . 107
5.2 Limitations of Voice Communication Analysis . . . 109
5.3 Results of Voice Communication Analysis . . . 111
5.3.1 Communication Analysis: New York 10 (ZNY10) . . . 112
5.3.2 Communication Analysis: Chicago 25 (ZAU25) . . . 136
5.3.3 Communication Analysis: Miami 40 (ZMA40) . . . 143
5.4 Summary . . . 150
6 Conclusion 153 6.1 Thesis Summary . . . 153
References 157
A Background: Air Traffic Control System 165
A.1 The Airspace . . . 167
B Flight Plan Groups and Techniques 171
B.1 Flight Plan Groups: Chicago 25 (ZAU25) . . . 171 B.2 Flight Plan Groups: Miami 40 (ZMA40) . . . 181
List of Figures
1-1 Structure hierarchy (Histon & Hansman, 2008). . . 19 1-2 Example of structure. . . 20 1-3 Adopted classification of airspace sectors by altitude . . . 22 1-4 Simplified cognitive process model (adapted from Histon and Hansman
(2008)). . . 23 2-1 A model of the mental and physical processes required in ATC (after
Pawlak, Brinton, Crouch, and Lancaster (1996)). . . 29 2-2 Cognitive Process Model (Histon & Hansman, 2008). . . 30 2-3 Sector Knowledge Pyramid: sector knowledge items organized by
alti-tude (Kalbaugh & Levin, 2009). . . 31 2-4 Structure-based abstractions identified by Histon and Hansman (2008). 32 2-5 Notional air traffic controller operating modes (adapted from Histon
and Hansman (2008)). . . 37 2-6 Simplified Model of the ATC process and uses of the term complexity
(Histon & Hansman, 2008). . . 40 3-1 Analysis Methodology. . . 50 3-2 Traffic and distribution of percentage of traffic to specific destinations
for Los Angeles 26 (ZLA26) and Kansas City 07 (ZKC07) . . . 53 3-3 Traffic and distribution of directions for Los Angeles 25 (ZLA25) and
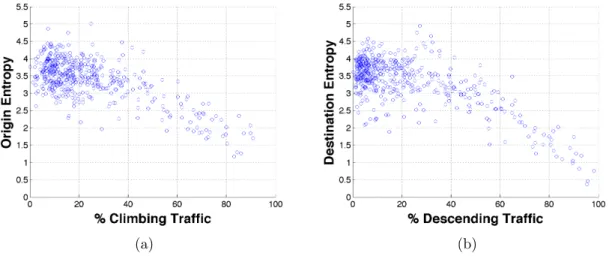
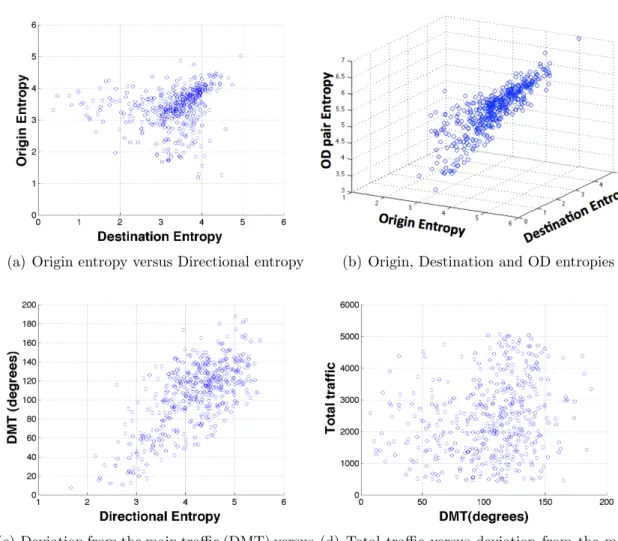
Denver 32 (ZDV32) . . . 55 3-4 Relationship between altitude transition metrics and entropy of the
3-5 Climbing versus Descending traffic per sector . . . 61
3-6 Relationship between other metrics . . . 62
3-7 Scatter plots for all clusters. . . 64
3-8 Boxplots for each cluster identified among the High and Super High Altitude Sectors . . . 66
3-9 Clusters identified for High and Super High Altitude Sectors . . . 68
4-1 Fort Worth 89 (ZFW89) . . . 73
4-2 Examples of dense flows (highlighted in red) . . . 76
4-3 Examples of converging/diverging (C/D) flows . . . 76
4-4 Critical Points: crossing . . . 77
4-5 Critical Points: merge / split . . . 78
4-6 Critical Points: Stars . . . 78
4-7 External structure analysis of ZOA33 . . . 80
4-8 Zoomed in view and route structure for ZJX49 . . . 81
4-9 Zoomed out view of ZJX49 . . . 82
4-10 Illustration of cluster membership of analyzed clusters. . . 84
4-11 ZOB59: Zoomed out view . . . 85
4-12 ZOB59: 3D histogram containing top 15 Origin and Destinations . . 86
4-13 ZOB59: Histograms of top 15 Origins and Destinations . . . 86
4-14 Correlating traffic with top destinations . . . 87
4-15 Correlating traffic with top Origins . . . 87
4-16 ZOB59: Structural features correlated with top Origins and Destinations 88 4-17 ZOB59: Zoomed out view and altitude changes . . . 89
4-18 ZBW38: Zoomed out view . . . 90
4-19 ZBW38: 3D histogram containing top 15 Origin and Destinations . . 91
4-20 ZBW38: Histograms of top 15 Origins and Destinations . . . 91
4-21 ZBW38: Structural features correlated with top Origins and Destinations 92 4-22 ZBW38: Zoomed out view and altitude changes . . . 92
4-23 ZBW38: Zoomed out view and altitude changes for MHT – PHL traffic
(transparency level set to 10%) . . . 93
4-24 ZFW90: Zoomed out view and altitude changes . . . 94
4-25 ZFW90: 3D histogram containing top 15 Origin and Destinations . . 95
4-26 ZFW90: Histograms of top 15 Origins and Destinations . . . 96
4-27 ZFW90: Structural features correlated with top Origins and Destinations 96 4-28 ZAB98: Zoomed out view . . . 97
4-29 ZAB98: 3D histogram containing top 15 Origin and Destinations . . 98
4-30 ZAB98: Histograms of top 15 Origins and Destinations . . . 98
4-31 ZAB98: Zoomed out view and altitude changes for traffic related to DFW . . . 99
5-1 Cognitive Process Model including observations (adapted from Histon and Hansman (2008)). . . 104
5-2 Illustration of analyzed sectors in each cluster. . . 106
5-3 Selected sectors for pilot-controller communication analysis . . . 107
5-4 ZNY10: Structural framework . . . 113
5-5 ZNY10: Impact of the weather on planned and flown trajectory for ASA35 . . . 114
5-6 ZNY10: Number of flights per group. . . 115
5-7 ZNY10: Trajectories and estimate position of commands for all the traffic on 03/18, 9:00-10:00AM . . . 117
5-8 ZNY10: Summary of identified flight plan groups . . . 118
5-9 ZNY10: Distribution of commands for flight plan groupings not af-fected by weather. . . 119
5-10 ZNY10: Distribution of commands for flight plan groupings affected by weather. . . 120
5-11 ZNY10: Results for 7 flights in group 1 on 06/17, 09:00 – 10:00 AM . 121 5-12 ZNY10: Results for 5 flights in group 2 on 03/18, 09:00 – 10:00 AM . 123 5-13 ZNY10: Results for group 3 . . . 125
5-14 ZNY10: Results for 9 flights in group 4 on 07/05, 05:30 – 06:30 PM . 128
5-15 ZNY10: Results for group 5 . . . 129
5-16 ZNY10: Results for 2 flights in group 6 on 03/18, 09:00 – 10:00 AM . 131 5-17 ZNY10: Background traffic . . . 132
5-18 ZNY10: Summary of identified tasks and techniques for flight plan groups . . . 134
5-19 ZAU25: Structural framework . . . 136
5-20 ZAU25: Number of flights per group. . . 137
5-21 ZAU25: Summary of identified flight plan groups . . . 138
5-22 ZAU25: Types of commands and flight plan groups. . . 139
5-23 ZAU25: Summary of identified tasks and techniques for flight plan groups . . . 140
5-24 ZMA40: Structural framework . . . 143
5-25 ZMA40: Summary of identified flight plan groups . . . 145
5-26 ZMA40: Types of commands and flight plan groups. . . 146
5-27 ZMA40: Summary of identified tasks and techniques for flight plan groups. . . 147
B-1 ZAU25: Results for 28 flights in group 1 on 06/17, 09:00 – 11:00 AM 172 B-2 ZAU25: WYNDE THREE Arrival Procedure. Source: www.flightaware.com173 B-3 ZAU25: Results for 5 flights in group 2 on 06/17, 05:00 – 07:00 PM . 174 B-4 ZAU25: Results for 12 flights in group 3 on 06/17, 09:00 – 11:00 AM 175 B-5 ZAU25: Results for 6 flights in group 4 on 06/17, 05:00 – 07:00 PM . 176 B-6 ZAU25: Results for 4 flights in group 5 on 06/17, 05:00 – 07:00 PM . 178 B-7 ZAU25: Results for 5 flights in group 6 on 06/17, 09:00 – 11:00 AM . 179 B-8 ZAU25: Background traffic . . . 180
B-9 ZMA40: Results for 10 flights in group 1 on 07/05, 05:30 – 06:30 PM 181 B-10 ZMA40: Results for 7 flights in group 2 on 07/11, 05:00 – 06:00 PM . 183 B-11 ZMA40: Results for 6 flights in group 3 on 07/23, 09:00 – 10:30 AM . 184 B-12 ZMA40: Background traffic . . . 187
List of Tables
3.1 Summary of selected traffic metrics . . . 52
3.2 Summary of clusters for High and Super High sectors . . . 69
5.1 ZNY10: General information about analyzed traffic intervals . . . 113
5.2 ZNY10: Pilot requests from aircraft in group 1. . . 122
5.3 ZNY10: Pilot requests from aircraft in group 3. . . 126
5.4 ZNY10: Pilot requests from aircraft in group 5. . . 130
5.5 ZAU25: General information about analyzed traffic intervals . . . 137
5.6 ZMA40: General information about analyzed traffic intervals . . . 144
B.1 ZAU25: Pilot requests from aircraft in group 1. . . 172
B.2 ZAU25: Pilot requests from aircraft in group 2. . . 174
B.3 ZAU25: Pilot requests from aircraft in group 3. . . 175
B.4 ZMA40: Pilot requests from aircraft in group 1. . . 182
B.5 ZMA40: Pilot requests from aircraft in group 2. . . 183
B.6 ZMA40: Pilot requests from aircraft in group 2. . . 184 B.7 ZMA40: Minor flight plan groups and traffic count for each traffic period.186
Chapter 1
Introduction
1.1
Motivation
Air traffic is forecast to grow dramatically in the following years and the current system is already being pushed to the limits. In order to better accommodate this increasing demand, the Federal Aviation Administration (FAA) plans several im-provements to the current National Airspace System (NAS). These imim-provements fit in a major program, the Next Generation Air Traffic Control (NextGen), that antic-ipates the increase and addition of capabilities that are expected to allow a proper response to the future needs of the United States Air Transportation System.
These modifications include improvements in communications, navigation and surveillance systems. These changes, combined with new technologies and procedural changes are likely to alter the structure of the Air Traffic Control (ATC) System.
For the purposes of this thesis, structure of ATC is defined as the framework elements, procedural elements and pattern elements of the traffic. This definition is based on observations conducted by Histon and Hansman (2008). The current structure of ATC has been mentioned by many as a primary source of inefficien-cies, its major drawbacks being narrow guidelines and rigid framework (Nolan, 2011; Chatterji, Zheng, & Kopardekar, 2008; Zelinski & Jastrzebski, 2010; Kopardekar & Magyarits, 2003; Howell, Bennett, Bonn, & Knorr, 2003). It is inevitable, however, that the structure in ATC impacts the tasks, the dynamics of the air traffic situations
and the commands available to the controller (Histon & Hansman, 2008). Indeed, structure ultimately affects the cognitive processes that controllers use, generating factors that impact the mental models and abstractions.
Therefore, the transition to new concepts of operation or improvements in the NAS will be better achieved with a well-grounded understanding of what aspects of the ATC structure impact the cognitive processes of controllers. Consideration of such impacts of structure should provide a better foundation for engineering decisions that include a human-centered perspective.
1.2
Structure in the Air Traffic Control System
Histon and Hansman (2008) observed components of the ATC system and charac-teristics of the airspace, thereby identifying three distinct levels of the structure of ATC. These levels or layers of structure were then incorporated into a hierarchical framework, as presented in Figure 1-1.
At the base of this hierarchy is the framework layer of the structure, which is sub-divided in physical elements, reference elements and airspace boundaries. These elements (illustrated in Figure 1-2) establish the foundation and context of an air traffic situation (Histon & Hansman, 2008).
Built on the context of the framework layer is the procedure layer, which is sub-divided in published procedures and ATC procedures. Published procedures are the regulations that govern any air traffic activity. Other examples of published pro-cedures are trajectory propro-cedures for arrivals and departures and communication protocols. The ATC procedures, including formal and informal operating proce-dures. Formal procedures include the Standard Operating Procedures (SOPs) and Letters of Agreement (LOAs) that dictate how the interface between sectors should occur. During field studies, Histon and Hansman (2008) observed controllers follow-ing undocumented, or informal, procedures that imposed structure in the air traffic situation.
Figure 1-1: Structure hierarchy (Histon & Hansman, 2008).
the top-most layer of the structure: the patterns within the structure (Histon & Hansman, 2008). From focused interviews and visualizations and reconstruction of traffic, Histon and Hansman (2008) identified three key traffic patterns: standard flows, critical points, and groupings.
The ATC structure evolved over time in order to accommodate the increase in air traffic. For instance, in order to assist an increasing body of air traffic con-trollers, there was a continuous introduction of new procedures and automated sys-tems. Hence, the current structure of the NAS is the result of engineering decisions on the design of a human-centered separation assurance system (Nolan, 2011).
An example of characterization of structure is how responsibility over the airspace is distributed. Due to the continental dimensions of the american airspace, FAA has given the responsibility of separation to Air Route Traffic Control Centers (ARTCCs) or “Centers”. The Centers, in turn, are further partitioned into sectors, taking in con-sideration the resultant workload for managing the traffic flows. Moreover, several
elements of the framework of the structure become evident when looking to a car-tographic chart of an airspace sector. Figure 1-2 presents such a chart describing Brewton High sector, Jacksonville 11 (ZJX11). For instance, in this Figure, the fol-lowing elements can be noticed:
• Minimum and maximum altitudes of the sector and its surrounding sectors;
• Lateral boundaries of the sector;
• Lateral boundaries of the Center that the sector pertains to;
• Jet routes;
• Navigational fixes; and
• Different sorts of airspaces (e.g. special use, military)
Figure 1-2: Example of structure: cartographic chart describing Brewton High sector, Jacksonville 11 (ZJX11).
1.3
Focus of Research
1.3.1
Focus: Patterns in the Structure
This thesis is primarily about how the patterns in the structure in the NAS are used by the air traffic controllers. One can refer to patterns in the structure and in the traffic in different ways. For the sake of coherence, the following convention is going to be adopted throughout this thesis:
• Structural features correspond to the distinct elements or pieces of the overall pattern, such as flows and critical points.
• Structural patterns consist on the overall pattern, the arrangement and combi-nation of structural features.
1.3.2
Focus: High and Super High Altitude Airspace
As mentioned before, in the United States, the controlled airspace is typically divided into areas of responsibility known as sectors. A three dimensional airspace sector can be imagined as a complex union of arbitrarily shaped blocks. In this work, sectors entirely above FL340 are considered Super High, sectors with floor below FL340 and ceiling above FL240 are considered High and sectors with ceiling below FL240 are considered Low (Figure 1-3).
There are many different sectors covering the continental US, as well as oceanic airspace, from ground to 60,000 feet. Thus, the air traffic control services are pro-vided in a wide range of operational environments, such as in different classes of airspace, positive controlled versus controlled airspace, continental or oceanic and ramp, ground, terminal and en route airspace (Belobaba, Odoni, & Barnhart, 2009). The airspaces may also feature different characteristics or elements, such as special use airspaces, prohibited areas, mix of traffic performance, local rules or procedures, ter-rain obstacles and even susceptibility to weather interferences (some of these airspaces can be seen in Figure 1-2). The types of decisions, working mental models, decision
Figure 1-3: Adopted classification of airspace sectors by altitude. Sectors with floor greater or equal to FL340 are considered Super High. Sectors with ceiling greater or equal to FL240 and floor below FL340 are considered High. Sectors with ceiling below FL240 are considered Low.
support systems and tasks related to each of these environments can also vary signif-icantly.
Thus, in order to limit the scope for meaningful conclusions, this thesis only focuses in a subset of these environments. Namely, the scope of the structural analyses in this thesis is on radar surveillance of en route control of High and Super high altitude airspace.
Airspace in the higher stratum of the NAS is also more amenable to implementa-tion of new concepts of operaimplementa-tion. The raimplementa-tionale for this greater opportunity is that these sectors are less impacted by local operational constraints and characteristics.
1.4
Objective
The objective of this research is to investigate how distinct structural patterns are used by controllers for managing the traffic.
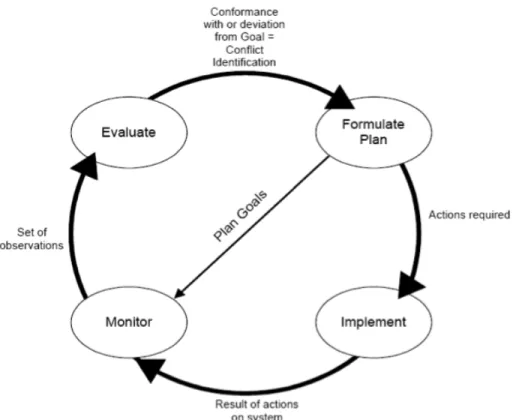
Figure 1-4 presents a simplified model of the ATC process. In this model, the air traffic controller perceives the states of the air traffic situations and recognizes the
impact of structure on the tasks that must be performed. Based on the surveilled states, on knowledge stored in the long-term memory and on the perception of tasks from the structure, the controller generates commands that influence the evolution of the air traffic situation.
As proposed by Histon and Hansman (2008) and illustrated in this simplified model, structure is internalized into the long-term memory of the controller’s mental model. This internalization process occurs mainly via training (academic studies and on-the-job training) and experience (exercising the profession itself). The result of learning is the development of abstractions and mental models. As an essential part of the developed abstractions and mental models, the learned strategies and techniques account for sector-specific dynamics and structural elements.
An important distinction has to be made, as techniques are commonly associated with strategies. For the purposes of this work, both are distinguished as follows:
• Technique: Sequence of actions, way of manipulating the traffic for accomplish-ing a given task or purpose;
• Strategy: Plan of how to use the acquired techniques to achieve safe and efficient
Figure 1-4: Simplified cognitive process model (adapted from Histon and Hansman (2008)).
throughput of traffic.
Thus, in order to accomplish the proposed objective, the approach can be sub-divided into two types of analyses:
1. Identify structural patterns in the NAS;
2. Investigate what factors of the structural patterns impact the required tech-niques.
1.5
Document Overview
Chapter 2 presents relevant literature review for this work. Chapter 3 identifies how structure manifests in the NAS via the investigation of potential structural similar-ities. It presents a NAS wide analysis of the dynamics of the traffic. This analysis permitted the identification of different types of dynamics that can be found in the NAS and how airspace sectors can be grouped in this matter.
In Chapter 4, the objective is to identify variations of structural features (flows and critical points) and to generate hypotheses about how controllers manage the traffic. Visualizations of the traffic are the main employed technique for this matter. Chapter 5 aims to understand how techniques that controllers used are related to each structural feature. The analysis is leveraged on insights obtained in Chapter 4. Chapter 5 presents a detailed voice and traffic dynamics analysis for the investigation of how controllers manage the traffic.
Chapter 6 summarizes the main steps that were taken in this work and presents conclusions that are pertinent to the better understanding of use of structure.
Chapter 2
Literature Review
This Chapter reviews pertinent material to the thesis. This review starts by discussing about decision making in the broad context, subsequently moving to specific topics in the ATC domain. These topics are: ATC Cognitive Models and how they relation to the structure in ATC, complexity in ATC and identification of patterns in the structure.
This text assumes that the reader is familiar with the ATC system. Some details about the system can be found in Appendix A.
2.1
Decision Making
As presented in Chapter 1, this work is concerned with the required knowledge for an air traffic controller to operate a given airspace. This work goes beyond proce-dural knowledge (knowing how to do things) and declarative knowledge (knowing about facts). More specifically, the concern is on identifying the library of techniques (stored in long-term memory) of proficient controllers and understanding how this same library is related to the structure of the airspace under control. It is inevitable that, by eliciting this kind of knowledge, the decision process of proficient controllers must be assessed.
In the context of decision making research, Naturalistic Decision Making (NDM) is of particular importance for this research, because this line of research is concerned
with proficient decision makers. NDM is defined by Lipshitz, Klein, Orasanu, and Salas (2001) as an attempt to understand how people make decisions in real-world contexts that are meaningful and familiar to them.
In order to better characterize NDM, however, it is useful to understand the Classical Decision Making (CDM), which takes a normative or prescriptive approach to decision making. Essentially, it tries to prescribe what choice a rational decision maker should take according to criteria of optimality. Lipshitz et al. (2001) points out major characterizes of CDM that can be found from different authors:
1. Making a choice – Decision making as selecting an optimal solution from an identified set of alternatives (Hogarth, 1987).
2. Input-output orientation – given a set of preferences, there will be a best or a set of best alternatives that the decision maker should choose (Funder, 1987).
3. Comprehensiveness – decision making is an analytical process that requires a relatively thorough information search (Payne, Johnson, Bettman, & Coupey, 1990).
4. Formalism – abstract and context free models susceptible to quantitative testing and experimentation (Coombs, Dawes, & Tversky, 1970).
The gradual transition to NDM occurs as many of these characteristics are ques-tioned as valid representations of the human decision making process. Features of the rational choice mode are then replaced for more descriptive features. For instance, processing the required information entailed by comprehensiveness is potentially ex-haustive and futile, thereby leading to systematic deviations from the rational choice (Simon, 1978).
By placing the bounded rational and proficient decision maker at its center of interest, NDM replaces comprehensives by matching, choice and input-output ori-entation by process oriori-entation and formalism by context-bound informal modeling (Lipshitz et al., 2001).
The Recognition Primed Decision Making (RPD) can serve as the prototypical NDM model (Klein, Orasanu, & Calderwood, 1993). The following section presents the RPD model in the context of expert decision makers.
2.1.1
Recognition-Primed Decision Making
In a field research conducted by Klein, Calderwood, and MacGregor (1989) regarding how firefighters could handle time pressure and uncertainty, data suggested that the commanders were not comparing any options in their decision making process. There was evidence that they were typically carrying out the first identified course of action. The decision maker simply recognized the pattern in a problem from the available cues. This pattern is used to categorize or fit the situation to a given template, which allows the expert to realize what kind of problem is being faced. Also from experience, the expert knows what kind of solution works from every typical situation. Therefore, recognition of a situation leads to a minimization of analytical thinking for understanding and search and choice of a course of action.
RPD works well on situations where there are multiple highly correlated cues, which calls for what Hammond, Hamm, Grassia, and Pearson (1987) referred to as intuitive form of information integration based on pattern recognition. Naturally, it takes experience to know what are the relevant patterns of problems and what are the associated solutions to them. Wickens and Hollands (1999), however, notes that just because experts can make rapid decisions under time pressure and high stake situations, it does not imply that these decisions are optimal or even good, nor that experts will always employ RPD. Hammond et al. (1987) point out that there might be situations that invite for a different, more analytical or even innovative approach for decision making. This might happen when no time pressure exists or when the situation does not fit to any internalized pattern.
On a second variation of RPD, Kaempf, Klein, Thordsen, and Wolf (1996) identi-fied what happens when the situation is not clear. In this case, the decision maker will often rely on simulation of the sequence of events that plausibly led to the current situation, thereby allowing the construction of a mental model that explains what
happened.
A third variation of RPD clarifies how decision makers cope with the constraints and stressors found in the operational environment. The evaluation of a decision is conducted by mentally simulating the course of action, in order to look for its ef-fectiveness and for any unintended consequences. Patel and Groen (1986); Larkin, McDermott, Simon, and Simon (1980) found that people with greater expertise are more likely to use this forward-chained variation of RPD, whereas less experienced decision makers rely more on backward-chained reasoning for understanding the sit-uation. Klein (1998) identified that RPD strategies are most likely to hold when the decision maker has reasonable experience and when the situation is characterized by time pressure, uncertainty and/or ill-defined goals. Also, RPD is less likely to hold with highly combinatorial problems, when justifications for actions are required, and in cases where different stakeholders have to be taken in consideration. These constitute some of the boundary conditions for the RPD model.
2.2
Air Traffic Control Cognitive Process Model
Pawlak et al. (1996) identified major ATC cognitive tasks that must be performed, which can be extended to any type of procedure for ATC. Figure 2-1 illustrates these four major controller activities, combined in one single diagram.
Regarding the controllers cognitive tasks, Pawlak et al. (1996) noticed that three of these processes (namely planning, monitoring, and evaluating) combine to create mental effort for the controller. From these four general tasks that controllers must perform, only implementation can be observed, although Pawlak et al. (1996) observe that some form of implementation can be done without observable action, such as planned co-ordination.
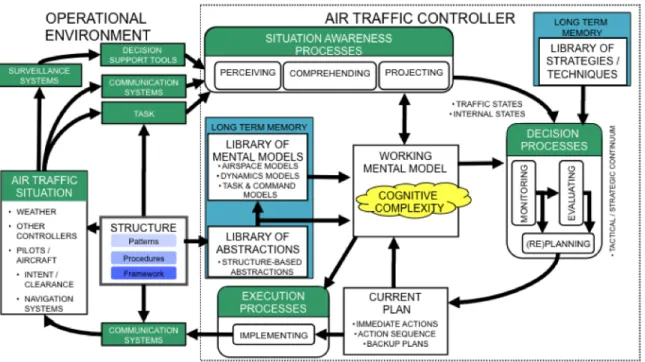
The cognitive process model used in this work is the one developed by Histon and Hansman (2008) and presented in Figure 2-2. This model is an explicit combination of Endsley (1995) model of situation awareness and the decision making processes iden-tified by Pawlak et al. (1996). It also includes the operational environment elements
Figure 2-1: A model of the mental and physical processes required in ATC (after Pawlak et al. (1996)).
of the plant or system being controlled. Most importantly, this model incorporates structure as already presented before and its influences on the cognitive processes and its many impacts on the operational environment, such as tasks, air traffic situation and commands and communications.
Three stages or steps represent situation awareness in this model: perception, comprehension and projection. Naturally, perception is related to the observation of the states of the operational environment, mainly through automations, communi-cation systems and tasks that have to be accomplished. Comprehension occurs in the context of these same tasks, which then drives the projection process through knowledge of the status and dynamics of the situation.
Awareness of traffic states and controllers internal states contribute to the decision making process (Kallus, Barbarino, & Damme, 1997). The long-term memory directly impacts the decision processes via the library of strategies and techniques. Long-term memory also indirectly impacts the decision processes, as the working memory
Figure 2-2: Cognitive Process Model (Histon & Hansman, 2008).
accesses information from the libraries of mental models and abstractions.
The library of mental models encompasses general knowledge of air traffic rules, procedures, dynamics of aircraft and weather as well as specific knowledge about the airspace the controller is responsible.
The knowledge requirements also depend on the type of airspace being controlled. Kalbaugh and Levin (2009) identified 102 knowledge elements that were required for controllers to manage and understand the traffic. These elements were then orga-nized by altitude of the airspace, and later validated by subject matter experts. The resulting graphical representation of required knowledge elements per altitude was coined “Sector Knowledge Pyramid” (SKP), which is presented in Figure 2-3.
According to the findings presented in the SKP, approximately 64% less infor-mation is required for Super High sectors than for sectors in the lower stratum of the NAS. The difference from the Super High to High is of 36% less information requirements (Kalbaugh & Levin, 2009).
The working memory holds operative information and is the one responsible for all forms of active processing, such as pattern matching, mental arithmetic and support for situation awareness (Cardosi & Murphy, 1995).
Figure 2-3: Sector Knowledge Pyramid: Illustration of how the amount of information a controller needs to know decreases as the sector altitude stratum increases.
102 identified sector knowledge items were organized by altitude: Ultra-low (below 10K) - 99/102; Low (10K to FL230) - 98/102; High (FL240 to FL340) - 55/02; and Ultra-high (FL350 to FL600) - 35/102 (Kalbaugh & Levin, 2009).
2.2.1
Structure-Based Abstractions
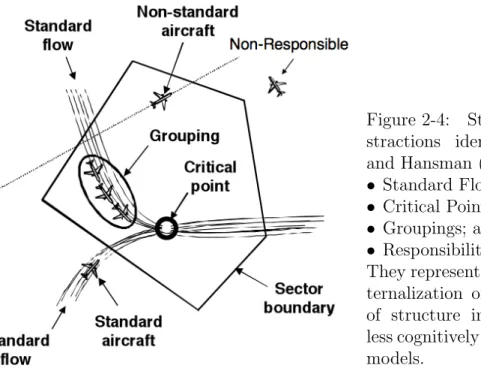
Long-term memory plays a large role in decision making, as the current situation has to be matched to stored patterns. This matching process triggers techniques that are known to solve specific situations (Cardosi & Murphy, 1995). Histon and Hansman (2008) identified structure-based abstractions (Figure 2-4) as “a controllers internalization of the influences of that structure on the dynamics of an air traffic situation, on available commands and the task.” Therefore, these abstractions are simplifications of the controllers working mental model, thereby allowing the use of mental models that are less cognitively demanding, but still remarkably effective (Histon & Hansman, 2008).
Structure-based abstractions pre-solve certain tasks, by segregating parts of the air traffic situation. The ultimate result is task decomposition, since certain indepen-dent relationships and comparisons are not relevant. Also by removing unnecessary comparisons, Histon and Hansman (2008) argued that the effective degrees-of-freedom for projection of future air traffic behavior is reduced. By removing dimensions of the search space, the required cognitive resources such as time and effort can be
signifi-Figure 2-4: Structure-based ab-stractions identified by Histon and Hansman (2008):
• Standard Flows; • Critical Points; • Groupings; and • Responsibility.
They represent the controller’s in-ternalization of the patterns the of structure into simplified and less cognitively demanding mental models.
cantly diminished, albeit a less accurate representation of the real world is used. Another contribution of structure-based abstraction on the simplification of men-tal models occurs on the processes of evaluating and (re)planning the situation. Via pattern matching, such abstractions allow task decomposition into standard and non-standard aircraft. This suppresses the need for detailed evaluation and facilitates conformance monitoring to trajectories as complicated as those depicted in standard procedures. Regarding (re)planning, Histon and Hansman (2008) point out that “structure-based abstractions can also be used as the basis of the controllers current plan, reflecting key decision points and implementation points for commands.”
Histon and Hansman (2008) also observed strategies and techniques by which controllers took advantage of the structure and of the structure-based abstractions to transform the task. Examples about the use of structure included exploiting es-tablished procedures and directing aircraft to reference points to expedite the traffic through airspace. Strategies and techniques related to structure-based abstractions were mainly related to enforcing structure on the situation, as a basis for simplify-ing abstractions. Examples included constant velocity (Davison & Hansman, 2003) and conformance to patterns by denying shortcuts and forcing adherence to interface procedures (Histon & Hansman, 2008).
The types of structure-based abstractions identified by Histon and Hansman (2008) were: standard flows, critical points, groupings and responsibility. Each of these abstractions is briefly discussed below.
Standard Flow Abstractions
Histon and Hansman (2008) define standard flows as “recurring patterns of aircraft sharing common lateral paths; typically in-trail of each other.” He also acknowledges that a standard flow can be associated with a vertical behavior and it can also interact with other flows, by splitting, merging or crossing. In the current NAS, standard flows are very related to the ground-based navigation system, thereby coinciding most of the times with existing jet routes. Standard flow abstractions correspond to the internalization of these expected flow patterns within and near the sector (Histon & Hansman, 2008).
Critical Point Abstractions
According to Histon and Hansman (2008), critical points are high priority regions in the airspace. Therefore, a critical point can be a location characterized by any recurring problem. Sabhnani et al. (2010) characterize a critical point as an explicit intersection of standard flows. This intersection of flows could then be further char-acterized as a merge or crossing of two or more flows.
Grouping Abstractions
Histon and Hansman (2008) introduced grouping abstraction as the result of a crite-rion that collects together parts of the traffic situation. As such, a grouping abstrac-tion can be composed of aircraft, weather objects or restricted airspace. Examples of grouping criteria include aircraft flying the same flight levels, or aircraft that share characteristics in a given time, such as heading, speed, altitude transition or are just in proximity to each other.
Responsibility Abstractions
As noted by Histon and Hansman (2008), responsibility abstractions are an inter-natization of the delegation of portions of the task to other agents in the system. They are based on elements of the framework (mainly due to airspace boundaries) and the procedural (mainly through ways by which controllers offloads the tasks to other controller and even pilots) layer of the structure.
2.2.2
Strategies and Techniques in ATC Domain
Seamster, Redding, Cannon, Ryder, and Others (1993) argue that, due to intrinsic characteristics of the ATC job, there is a need not only for domain knowledge, but also efficient problem-solving strategies within the time-critical limits of the task. According to them, air traffic control strategies are heuristics that help controllers execute procedures more efficiently. Therefore, strategies may or may not include procedures and they are usually characterized by expertise.
A controller is dependent on these strategies in order to detect and prevent conflicts, while maintaining efficient traffic throughput (Nunes & Mogford, 2003). Sperandio (1978) postulated that strategies are used to moderate the levels of work-load, by that means ensuring the picture of the situation. Hopkin (1995) defines the picture as:
“The controllers picture consists of all that is perceived and is meaningful, interpreted in the context of recalled events preceding the current situa-tion, anticipated events predicted from the current situasitua-tion, and the pro-fessional knowledge and experience used to maintain control over the air traffic through sanctioned rules, practices, procedures and instructions”
A number of studies have been conducted on ATC strategies. In a review of such studies, Nunes and Mogford (2003) focus on strategies for conflict detection that are used to maintain the picture. In their review, trajectory prediction or altitude comparison could be used for conflict detection, depending on the unfolding situation, experience, training and preference.
In a study conducted by EUROCONTROL (2002), 45 controllers in 7 European countries were interviewed to determine their conflict resolutions for various scenarios. Strategies (also mentioned in the document as principles) were identified and catego-rized in five categories: (1) generic and non-contextual, (2) generic and contextual, (3) country based, (4) airspace based and (5) scenario based. Many of the strategies were only cited once, by a single controller, suggesting either strategic individuality or some degree of tacit knowledge.
In the EUROCONTROL (2002) study, controllers were also asked to elicit factors impacting their resolution strategies. The first cited factor is a combination of highly correlated features: aircraft type, aircraft performance and rate of climb. Noteworthy is the fact that high workload was mentioned by a number of controllers as a driver for simpler resolutions. Authors argue that alternate resolutions would be more optimal for the individual aircraft, but would clearly over-complicate an already busy scenario. Non-nominal aircraft were indicated as a complicating factor, as a source of secondary conflicts that were not internalized or accounted for. Interestingly, aircraft destination was the second most cited factor, incident that did not draw much of the authors attention.
This study also sheds light on techniques that controllers would NOT implement on conflict resolution. These were mainly airspace and conflict scenario specific. There was complete agreement that in one of the scenarios speed maneuver should not be used. The results, however, largely indicate personality biases on control strategies. Some controllers, for instance, would consider it unnecessarily risky to expedite the climb in one of the scenarios, whereas others would indeed adopt such resolution.
In a FAA report, D’Arcy and Rocco (2001) found many trends regarding the decision making and planning of specialists and novices, also differentiating Terminal and ARTCC controllers. They found that more experienced controllers are more likely to act immediately when a conflict is uncertain. Their results also suggest that experienced controllers tend to use the first strategy that they think of. Moreover, the statistical significance for these findings is stronger when looking only at Terminal controllers instead of ARTCC controllers, due to the more time-critical nature of the
job. In this study, careful attention was given to the formulation of backup plans, since participants emphasized its importance. As noted by the authors, this aspect is not explicitly found in previous ATC decision making studies that adopted a recognition-primed decision making perspective (Hutton, Thordsen, & Mogford, 1997; Mogford, Harwood, Murphy, & Roske-Hofstrand, 1994; Mogford, Murphy, Roske-Hofstrand, Yastrop, & Guttman, 1994).
Taking stock of the role of expertise and broadening the spectrum of analyzed strategies, Seamster et al. (1993) conducted a cognitive task analysis and found clear differences between experts and novices. Namely, experts alternated the focus on maintaining separation with managing deviations from standard operating proce-dures. Experts also spent more effort on organizing the traffic and attending pilot requests. The novices, however, spent most of the initial time focusing only on separa-tion. Experts appeared to maintain a more comprehensive view and to be more global in their analysis of problem solutions. Novices, however, had a sequential approach to problem solving and dedicated almost all of the effort satisfying only separation assurance.
In a broad cognitive task analysis research conducted by Redding et al. (1992), three categories of ATC strategies were identified: display (involving the planning and monitoring of the sector), control (involving the execution of control activities in the sector) and workload reduction strategies (employed to reduce the controllers work-load). They found that experts used relatively more workload reduction strategies. Moreover, certain strategies were unique to the expert participants: letting speed take effect, speed up to expedite, tighten separation, slow to intermediate speeds, shortcutting and early pilot notification.
In contrast, some planning strategies were unique to novices. Redding et al. (1992) found key differences in monitoring, planning and decision making, where novices usually got detained on constant monitoring and evaluation, whereas experts tended to adhere to a higher level plan to deal with the overall problem scenario.
The 22 cognitive strategies from Redding et al. (1992) were expanded to 40 strate-gies by Seamster et al. (1993) and regrouped under planning, monitoring and
work-load reduction management. A number of trends emerged from their study. Experts tended to account for or include more aircraft in their strategies and, even though they used strategies less frequently, they tended to use a greater variety of them. Experts also tended to use workload management strategies more frequently.
The authors also suggested that experts might be using strategies at the event level rather than at the individual aircraft level. By categorizing or grouping aircraft in terms of important sector events, the expert can (a) work with more aircraft, (b) better formulate a sector plan and (c) use fewer control and strategies (Seamster et al., 1993).
From the cognitive process model of Figure 2-2, Histon and Hansman (2008) observe the controllers ability to manipulate the presence of structure supporting his/her own abstractions about the traffic. By analyzing the en route inefficiency using Enhanced Traffic Management System (ETMS) data, Howell et al. (2003) ob-served dynamic variability in the use of structure as a function of traffic volume. Histon and Hansman (2008) also noticed variations in standard flows and identified operating modes representing broad changes in strategies and practices in response to the evolution of the air traffic situation. These operating modes, notionally shown in Figure 2-5, constitute on a dynamic use of strategies and structure-based abstractions, according to the cognitive demands.
Figure 2-5: Notional air traffic controller operating modes (adapted from Histon and Hansman (2008)).
“Transitioning to a new mode changes the strategies, techniques, and working mental models used by the controller, reducing the perceived complexity” (Histon & Hansman, 2008). In the opportunity mode, difficulty and workload is likely to scale with the number of aircraft, as there is enough free cognitive resources for the con-troller to optimize each aircrafts trajectory. When in the route structure mode, most aircraft remain in the pre-determined route, allowing the controllers to take advan-tage of their structure-based abstractions. Resources are allocated to the abstractions themselves, or to non-nominal aircraft, thereby permitting the controller to accom-modate higher traffic without significant increase in cognitive demand. In congestion mode, the capacity limits of flows and critical points are reached. This forces the con-troller to remove some aircraft from the flows and to monitor the interaction between aircraft conforming to the flow structure. Buffers such as path stretching and holding patterns are activated, resulting in increasing inefficiencies. In certain situations of outstanding demand or sudden change in the environment, the pre-existing structure may become unusable or irrelevant, leading to the system shock mode. In this mode, the controller is forced to quickly create contingency plans.
2.3
Complexity in Air Traffic Control
There is a clear consensus among the ATC research and operational communities that complexity drives controller workload, which in turn is thought of ultimately limiting airspace sector capacity (Christien, Benkouar, Chaboud, & Loubieres, 2003; Majumdar & Ochieng, 2002). Histon and Hansman (2008) explain how complexity ends up limiting the airspace capacity and efficiency:
“In order to protect controllers from situations that are too cognitively complex and, as a result, threaten the safety of the ATC system, con-straints are imposed on when and where aircraft can fly. While regu-lating cognitive complexity, these constraints also limit the capacity and efficiency of the ATC system.”
Nevertheless, not all researchers are confident that it will ever be possible to ad-equately and mathematically express the functional relationship between complexity and perceived workload (Hilburn, 2004). Ath`enes, Averty, Puechmorel, Delahaye, and Collet (2002) describe complexity as a way to characterize air situations and it is in fact a source of workload, but they also note that the functional relationship between these two is largely unknown. Mogford, Guttman, Morrow, and Kopardekar (1995) define complexity as “a multidimensional concept that includes static sector characteristics and dynamic traffic patterns.” (Meckiff, Chone, & Nicolaon, 1998) rec-ognize that the operational procedures and practices as well as the “characteristics and behavior of individual controllers” play a key role.
According to Warfield and Cardenas (1995), complexity is the combination of two components defined by him: situational complexity and cognitive complexity. Cognitive complexity is the dilemma presented to the human mind when it engages with conceptualizations that are beyond its unaided powers. Situational complexity represents those aspects of phenomena that are intercepted by the mind which induce cognitive complexity (Loureiro, 2003). Histon and Hansman (2008) observe:
“it is not always clear whether complexity is being presumed to be an in-trinsic property of the configuration of traffic (situation complexity), a sub-jective experience of the controller (perceived complexity), or a property of the processes being used to perform the ATC task (cognitive complexity).”
These distinctions made by Histon and Hansman (2008) for different constructs involving complexity are those used in this work. They are illustrated in Figure 2-6. Interest in defining and developing metrics of mental workload has grown dramat-ically since the mid 1970s (Hilburn, 2004). Most attempts to define mental workload have grown by way of analogy out of the concept of physical workload (Meshkati, Han-cock, & Rahimi, 1989). The lack of a clear definition for complexity and workload is reflected in the disagreement over appropriate metrics (Hilburn, 2004).
Workload can be interpreted as an interaction between task and operator; there-fore it varies for different task-operator combinations (Leplat, 1978). In this sense,
Figure 2-6: Simplified Model of the ATC process and uses of the term complexity (Histon & Hansman, 2008).
many factors can influence the human cost of performing a given task, such as time pressure, noise, stress, and distraction (Hancock, Chignell, & Kerr, 1988; Jorna, 1993). Other factors more related to the controller have also been cited, such as aptitude, skill, experience, operating behaviors, and personality (Bisseret, 1971; Sperandio, 1978). It can be concluded from these studies that the same given task might repre-sent a different workload, depending on the controller (whether he/she is an experi-enced operator, or a novice, for example). The distinction is generally made between taskload (the objective demands of a task) and workload (the subjective demand experienced in the performance of a task) (Hilburn, 2004).
2.3.1
Estimating Situation Complexity
Among all the complexity factors listed in the literature, traffic density is the most cited and most associated with complexity. Because of its large use and the multiple attempts to improve the complexity metrics upon this basic factor, traffic density has been used with many different definitions and terminologies. Common associated denominations are number of aircraft in a fixed airspace over some defined period of time, number of aircraft per unit of airspace volume, average density encountered by each flight, or simply the number of aircraft in the airspace (Hilburn, 2004). In this work, traffic density, traffic load or traffic count are understood as the same
complexity factor and they are going to be considered as the instantaneous number of aircraft in the sector.
As noted by Hilburn (2004), the body of literature seems at the same time to praise the concept of traffic density (as the best available indicator of complexity), and to criticize it (mainly on the theoretical grounds that it does not capture the richness of what controllers find complex (Kirwan, Scaife, & Kennedy, 2001; Mogford et al., 1995; Ath`enes et al., 2002)). The critics about the effectiveness of traffic count, as a complexity factor, agree with Edmonds (1999), who observes that, even though the size or number of elements in a system may be a good indicator of complexity, size by itself may not describe its full richness. Therefore, since the early stages of ATC complexity research, significant effort has been placed on identifying drivers of complexity. In a comprehensive literature review, Hilburn (2004) provides a list of such complexity factors.
By aggregating different complexity metrics, researchers have come up with mod-els of Dynamic Density (DD). The weights or contribution of each complexity metric is based on subjective ratings from workload or complexity probes or based on phys-ical activity data (Prandini, Piroddi, Puechmorel, & Br´azdilov´a, 2011). This kind of research has been applied for evaluating the contribution of different factors on the traffic complexity (Chatterji & Sridhar, 2001; Kopardekar, Schwartz, Magyarits, & Rhodes, 2007), as well as for forecasting the complexity for the next minutes (Kopardekar et al., 2007). Complexity is also usually estimated in the context of evaluation of a range of future Concepts of Operations, such as four-dimensional tra-jectories (L. Li & Hansman, 2009), multisector planner (Flener, Pearson, & Agren, 2007; L. Li, Palacios, & Hansman, 2010) , dynamic airspace configuration (Yousefi & Donohue, 2004; Yousefi, 2005; Masalonis, Callaham, & Wanke, 2003) and, more recently, generic airspace concept (Simmons, 2010; Bloem, Grupta, & Lai, 2010).
DD is analogous to complexity or difficulty of an air traffic situation (Kopardekar & Magyarits, 2003). Kopardekar and Magyarits (2003) considered DD as “the col-lective effect of all factors, or variables, that contribute to the sector level air traffic control complexity or difficulty at any given time.” RTCA Task Force 3 report (1995)
defines DD as “the essential factors affecting conflict rate in both en route and termi-nal airspace.” Laudeman, Shelden, and Branstrom (1998), on the other hand, starts defining DD as a metric of air traffic controller workload. Nonetheless, Laudeman et al. (1998) concurs with other definitions when clarifies that DD is based on air traffic characteristics, what makes it special for the development of both air traffic management automation and air traffic procedures.
Kopardekar and Magyarits (2003) describes in his paper a year, multi-organizational research initiative related to the measurement and prediction of sector level complexity through the use of DD. This research focused on identifying com-plexity factors and then applying regression equations for properly predicting instan-taneous and look-ahead time complexity.
In the conclusion of this multi-organizational work, it was pointed out that DD metrics have promise, most notably as a unified metric with contributing variables of metrics from different parties. Laudeman et al. (1998) and Kopardekar and Magyarits (2003) concluded that the DD metrics, as a combination of effects of traffic charac-teristics, perform better than the simple aircraft count, which is the basis of the standard complexity gauge. Nonetheless, the performance of the built DD predictor with look-ahead time obtained by Kopardekar and Magyarits (2003) was marginally better than the predicted aircraft count.
In the context of multisector planning, Flener et al. (2007) introduced a time-smoothed version of DD, as an estimate of complexity. Their metric, Interval Com-plexity (IC), is a 5-10 min average of a linear combination of number of aircraft, number of aircraft on non-level segments and number of aircraft close to the airspace boundary. The weights are sector dependent.
Many researchers recognized that non-linear approaches for DD could yield good results (Kopardekar & Magyarits, 2003; Hilburn, 2004), thereby tentatively resem-bling the non-linear combination of complexity factors that results on the overall complexity. Chatterji and Sridhar (2001) employed a successful non-linear regres-sion via neural networks, also including several interesting metrics as mathematical representations of the situation complexity.
Ideally, a complexity metric should apply independent of such factors as equipment sophistication, traffic density, or size of the controlled airspace (Chaboud, Hunter, Hustache, Mahlich, & Tullet, 2000). But there seems to be more and more agreement in the literature that complexity is far from being context-free. This is based in a critical aspect of human cognition, namely, that what is complex in one context is not necessarily complex in another (Hilburn, 2004).
Kirwan et al. (2001) have noted that what works well in one setting might not work well in another site, or even at another time of the day. As a parallel to the interactions and connectedness of the elements in complex systems (Hitchins, 2000; Christien et al., 2003; Koros, Rocco, Panjwani, Ingurgio, & D’Arcy, 2003) noted that the interactions between the complexity factors (as a way of determining what is complex) might vary depending on the context.
2.4
Identifying Patterns in the Structure
Before deepening on mathematical representations of the traffic, it is worth mention-ing the work of Chatterji et al. (2008). They looked at characteristics of the airspace sectors. In their analysis, traffic and geometric metrics are taken into consideration.
As noted in their paper, “design of sectors has evolved over a long period of time based on incremental addition of new technologies and procedures for air traffic con-trol.” Their traffic metrics included seven traffic-count metrics, five separation metrics and three flow metrics, extracted from references such as Pawlak, Goel, Rothenberg, and Brinton (1998); Christien et al. (2003); Yousefi and Donohue (2004). The geomet-ric metgeomet-rics were three geographical location metgeomet-rics, four sector dimension metgeomet-rics, three shape attribute metrics, five route attribute metrics and three neighborhood attribute metrics. Some of the traffic metrics had to be calculated, especially those involving conflicts, since conflicts or near-conflicts are rare in the real operational data.
Chatterji et al. (2008) considered 364 sectors. Some of their traffic findings include: most sectors in the current airspace have fewer than 20 aircraft at any given time and
most sectors have less than five aircraft in climb phase, fifteen in cruise phase and five in descent phase.
Among geometric findings, a wide variation was found in sector volume, area, height and length. Most sectors showed to be aligned with the main traffic flows. A maximum of 17 airways was found in any given sector and 328 sectors had ten or fewer airway intersections. Notably, only 29 sectors were farther than 200 nautical miles from what they considered to be the 74 major U. S. airports.
2.4.1
Identifying Structural Patterns
This section reviews what has been done on identification of features on the pattern layer of the structure (flows and critical points) presented in Figure 1-1
In general, the methods for identification of structural features can be either bottom-up (first critical points then flows are identified) or top-down (first flows and then critical points are identified). Moreover, they can be either grid based (extract-ing traffic information through two- or three- dimensional partitions of the airspace) or trajectory based (overall trajectory is considered in the analysis). There are also other methods reliant on visualization of traffic density. This text presents some of relevant works done under each methodological approach.
Trajectory clustering has been analyzed in a number of domains, such as video surveillance (Piciarelli, Foresti, & Snidaro, 2005), coastal surveillance (Dahlbom & Niklasson, 2007) and even for hurricane and animal movement data (J.-G. Lee, Han, & Whang, 2007). An interesting review covering different kinds of trajectory clustering problems can be found at (http://movementpatterns.pbworks.com/Patterns-of -Movement).
J. Lee and Han (2007) presented a methodology based on partitioning trajectories into segment lines, which are then regrouped based on perpendicular, parallel and angular distances. Other methods are based on longest common subsequences, such as the one presented by Vlachos, Kollios, and Gunopulos (2002). Evaluating benefits from performance-based navigation, Eckstein (2009) presents an automated flight track taxonomy. Trajectories are resampled, and then clustered using k-means.
Combining characteristics of these methods, Gariel, Srivastava, and Feron (2010) propose two separate and successful trajectory clustering algorithms for airspace mon-itoring. One of these methods is called “waypoint-based clustering”, as turning points are first identified and then clustered in order to generate waypoints. Trajectories are then represented as a sequence of these waypoints, which in turn are clustered in order to generate meaningful flows within the traffic.
In the second and most promising method, Gariel et al. (2010) propose improve-ments over the method introduced by Eckstein (2009). The algorithm is called “trajectory-based clustering”. They include an intermediate step where the data is augmented by calculating several statistics from the radar track data, such as an-gular position, distance to the center, heading, among others. The augmented data is then reduced via a principal component analysis and the final vectors for each flight are clustered via a density based clustering algorithm.
Most of the recent work on air traffic pattern identification has been in the context of dynamic airspace configuration (Martinez, Chatterji, Sun, & Bayen, 2007; Zelinski & Field, 2008; J. Li, Wang, Savai, & Hwang, 2009; Sabhnani, 2009; Xue, 2010; Zelinski & Jastrzebski, 2010). Some of these tried to capture information about the traffic through dimensional grid cells. For instance, Xue (2010) determined if a two-dimensional grid cell was either a member of a major traffic flow or an intersection point based on the heading variance of flights. Martinez et al. (2007) used light occupancy counts within each grid cells to create abstract network flow graph of the traffic.
Other methods spent effort on characterizing structure as connections between flows and critical points (Zelinski & Field, 2008; Sabhnani et al., 2010; Zelinski & Jastrzebski, 2010). Sabhnani et al. (2010) proposed different trajectory based greedy algorithms, as well as a grid based method that is less dependent on the variability of individual tracks. These methods output standard flows, from which intersections are identified and, once clustered, critical points are obtained. Tackling the pattern identification from a different perspective, Zelinski and Field (2008) first identified critical points from flight tracks. The method first finds intersection points that are
then differentiated into merging and crossing points. Intersection points are then clustered into critical points, in a process that showed that the number of crossing critical points was far higher than the number of merging critical points. Most of these critical points could be paired with airway intersections, revealing the relevance of the Structure in the current system.
Zelinski and Jastrzebski (2010) extended the methodology of Zelinski and Field (2008) by adding an altitude component and linking the critical points to form the flows. The dynamic change of these structural patterns was analyzed over the course of a day and under the influence of weather. They showed that more and more unpublished links began to appear as airways started to saturate with increasing traffic. The influence of structure was evident when great circle routes presented much more intersecting links than the flight plan routes.
Another class of research on identification of structural features relies on visual-ization of traffic densities. Histon and Hansman (2008) presented several examples of flows and critical points based on such visualizations. Naturally, such visualizations are still dependent on the airspace grids or transparency levels for the radar tracks. Such methodologies tend to be subjective and to rely on the analysts understanding of traffic behavior, existing procedures and the airspace structure itself. In this pro-cess, the identification of critical points, flows, holding patterns and path-shortening features occur concomitantly, which makes the differentiation between top-down and bottom-up approaches less important. The finding of these features usually comes with insights about possible traffic bottlenecks and controllers tasks. Evaluating the opportunity of generic airspace, Cho and Histon (2010) apply this methodology on high altitude sectors with ceiling above FL350, thereby identifying several patterns across the NAS
2.5
Summary
This Chapter started by reviewing the role of expertise on decision making and then how controllers abstract and manage the traffic. Human Factors in ATC was reviewed
by presenting some of the cognitive process models in the literature, giving more attention to the cognitive process model introduced by Histon and Hansman (2008), whereupon this work is leveraged. From Histon and Hansman (2008), it is known that complexity is an intrinsic property of the controllers working mental model, which is also related to the use of structure-based abstractions. Such abstractions are internalizations of the patterns of the traffic in the controller’s long-term memory, which, in turn, is a genuine fruit of training and expertise.
Moreover, there has been work on identification of strategies and techniques that controllers use in order to manage the traffic. To the knowledge of the authors of this work, these studies have mainly focused on specific de-conflicting tasks or overall differences between experts and novices. The role of structural patterns in strategies and techniques was identified by Histon and Hansman (2008), but not evaluated in great detail.
Many strategies have been associated with “workload management” and mental models used by controllers were characterized by the complexity of these models. As such, in the ATC domain, the evaluation of the nature of a problem can hardly be disassociated from the notion of cognitive complexity and workload, which was also briefly reviewed. These studies indicated several metrics that probe the dynamics of the traffic and are likely to correlate with the tasks that controllers must perform.
Literature on identification of structural patterns was then surveyed, due to ev-idence these that structural patterns are intrinsically related to how experts make decisions. It was found that many algorithmic studies on identification of flows and critical points have been done. However, little effort has been focused on evaluating in more detail the relevance of these patterns on how controllers manage the traffic. Moreover, these studies usually force a model to which the traffic has to fit, ignoring possible variations of patterns.
This thesis fits in the broader literature by examining alternative approaches for structural pattern identification, as well as by exploring how these patterns are man-aged by the controller.
Chapter 3
Analysis of NAS-wide Traffic
Patterns
As presented in Chapter 2, literature on decision making has found that experts internalize the patterns in their workspace and often have techniques that respond to these patterns. Based on this literature review, the objective of this Chapter is to identify different types of sectors, which may be an indicative of different mental models.
The types of sectors were identified by evaluating and comparing their traffic structure. This evaluation was conducted by considering metrics for the dynamics of the traffic. In order to identify appropriate metrics for traffic dynamics, the approach was to look metrics that had been used in prior studies to determine complexity and workload for air traffic controllers. The assumption is that these factors are important for the tasks that controllers must perform (Chatterji & Sridhar, 2001; Hilburn, 2004; Kopardekar et al., 2007) and, therefore, would be relevant for traffic pattern identification (Christien et al., 2003).
Four groups or classes of such traffic metrics were selected and calculated for each high altitude sector (aircraft count, altitude transition, concentration of traffic between origins and destinations and directional variability). Based on these metrics, this Chapter investigates whether there are high altitude sectors in the NAS with similar traffic dynamics.